. 2022 Mar 8;145(10):765-782.
doi: 10.1161/CIRCULATIONAHA.121.055888. Epub 2022 Feb 3.

CCL17 Aggravates Myocardial Injury by Suppressing Recruitment of Regulatory T Cells

Affiliations

CCL17 Aggravates Myocardial Injury by Suppressing Recruitment of Regulatory T Cells

Guoshuai Feng et al. Circulation. .

Abstract

Background: Recent studies have established that CCR2 (C-C chemokine receptor type 2) marks proinflammatory subsets of monocytes, macrophages, and dendritic cells that contribute to adverse left ventricle (LV) remodeling and heart failure progression. Elucidation of the effector mechanisms that mediate adverse effects of CCR2+ monocytes, macrophages, and dendritic cells will yield important insights into therapeutic strategies to suppress myocardial inflammation.

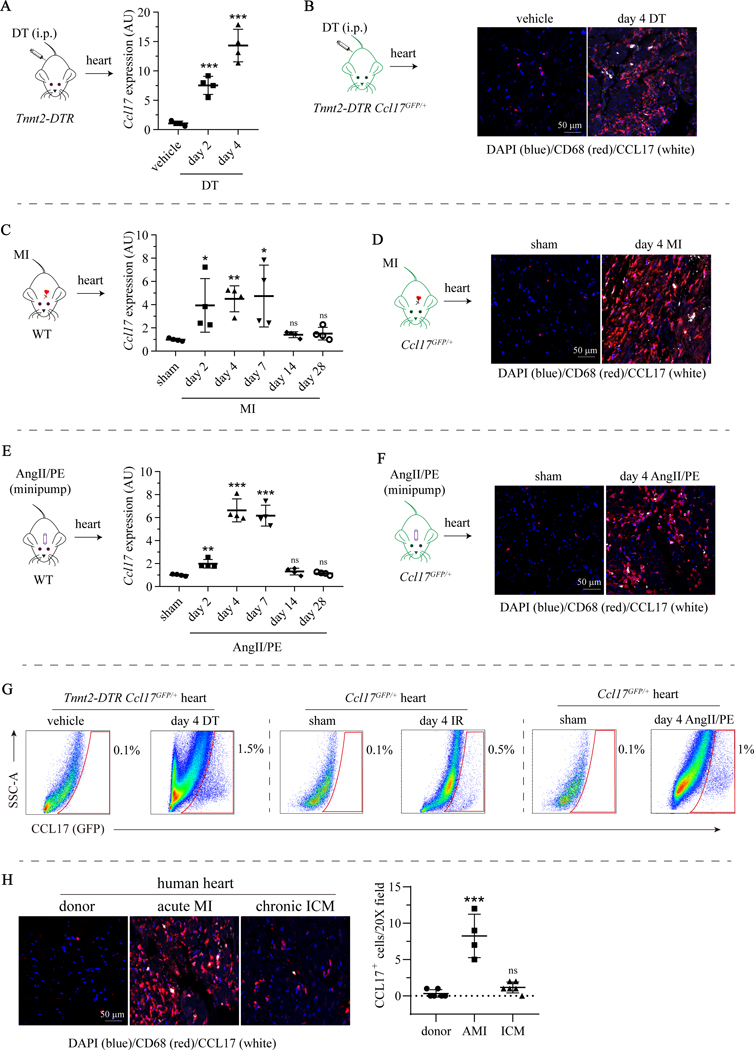
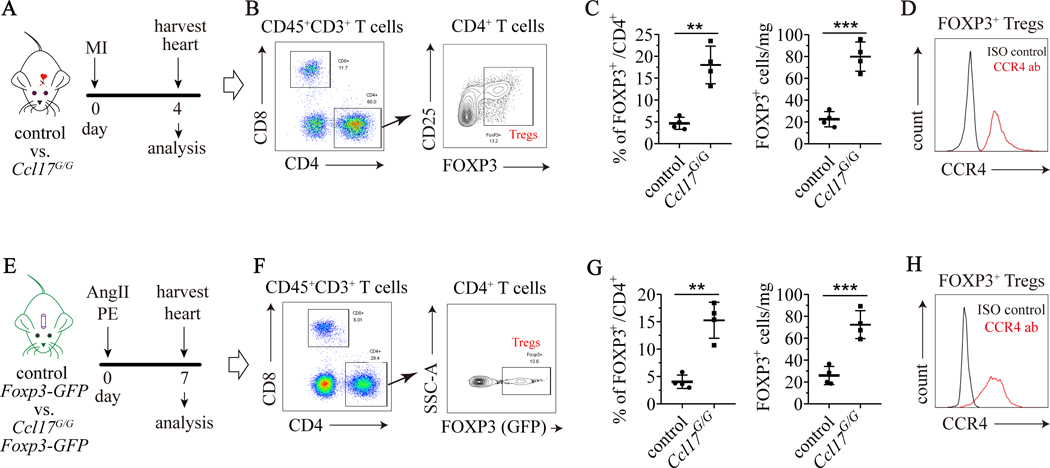
Methods: We used mouse models of reperfused myocardial infarction, angiotensin II and phenylephrine infusion, and diphtheria toxin cardiomyocyte ablation to investigate CCL17 (C-C chemokine ligand 17). We used Ccl17 knockout mice, flow cytometry, RNA sequencing, biochemical assays, cell trafficking studies, and in vivo cell depletion to identify the cell types that generate CCL17, define signaling pathways that controlled its expression, delineate the functional importance of CCL17 in adverse LV remodeling and heart failure progression, and determine the mechanistic basis by which CCL17 exerts its effects.

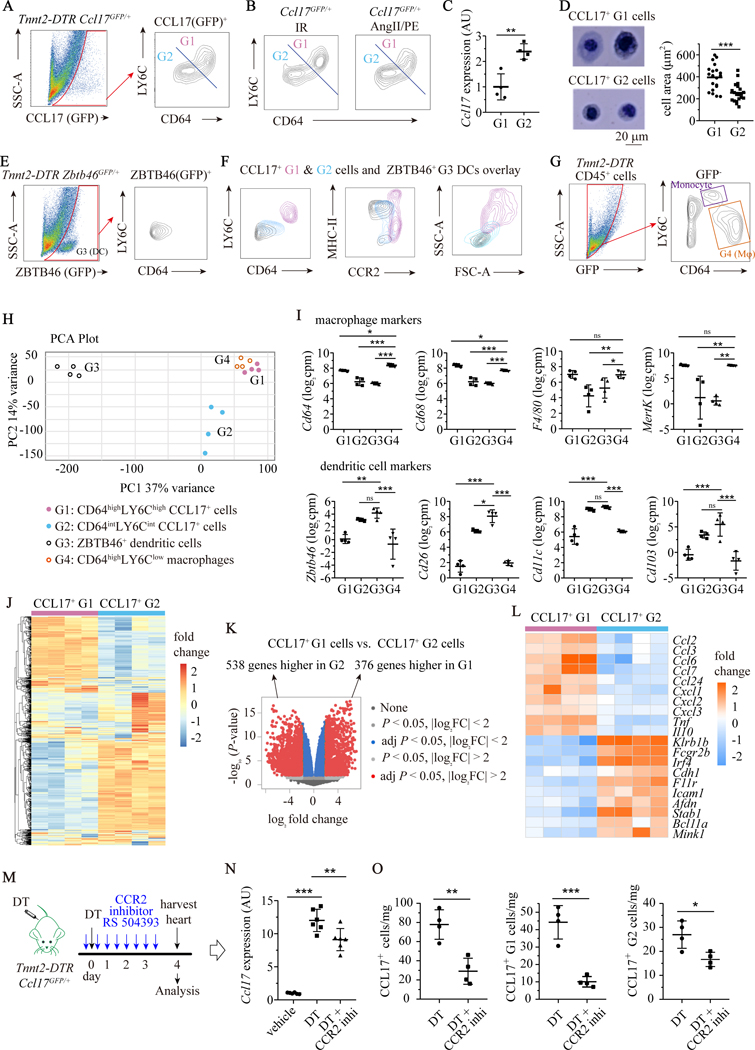
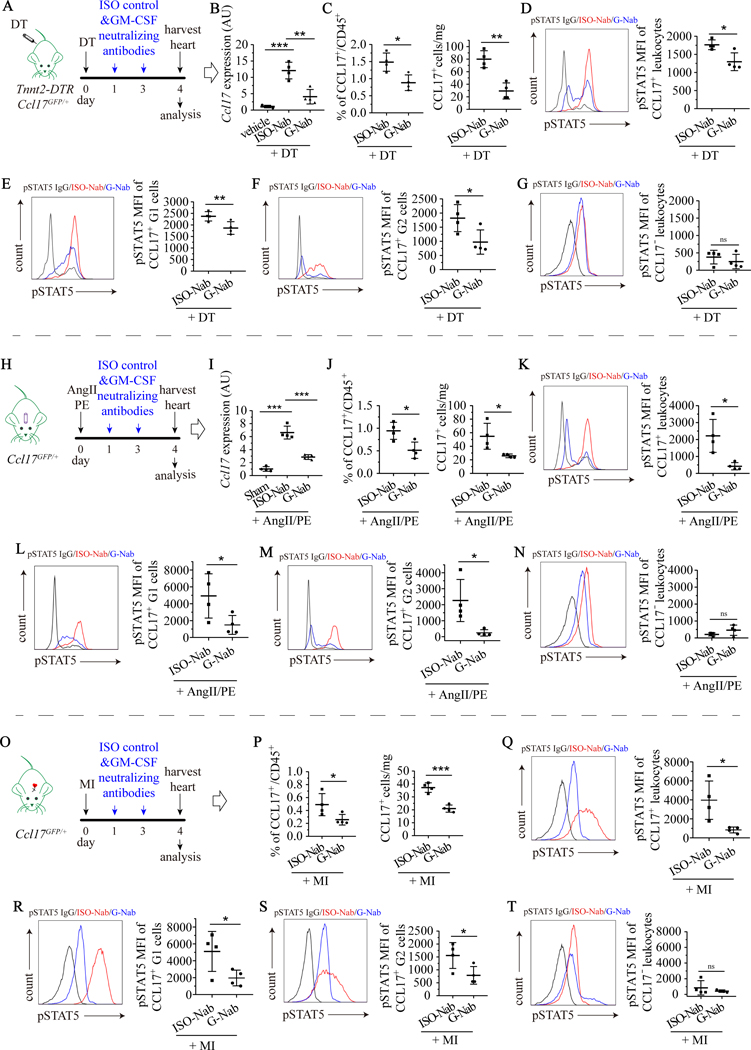
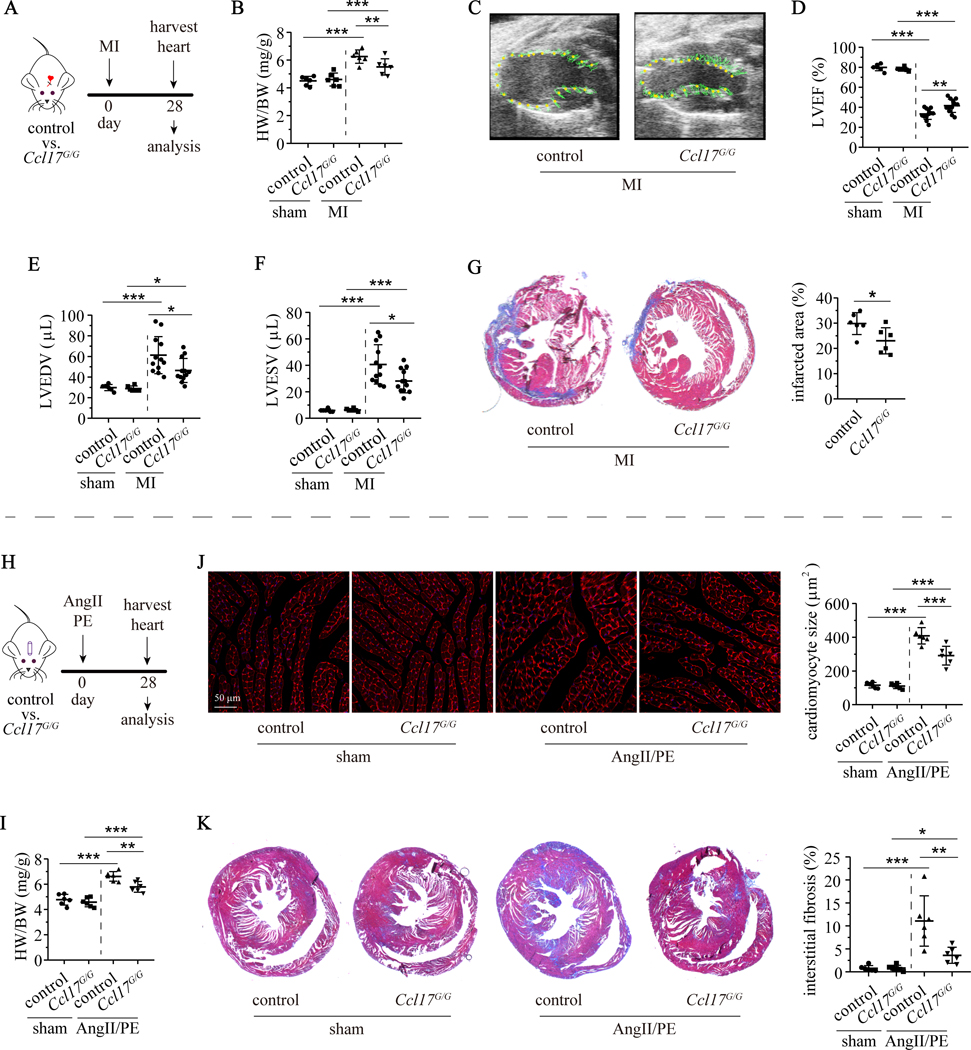
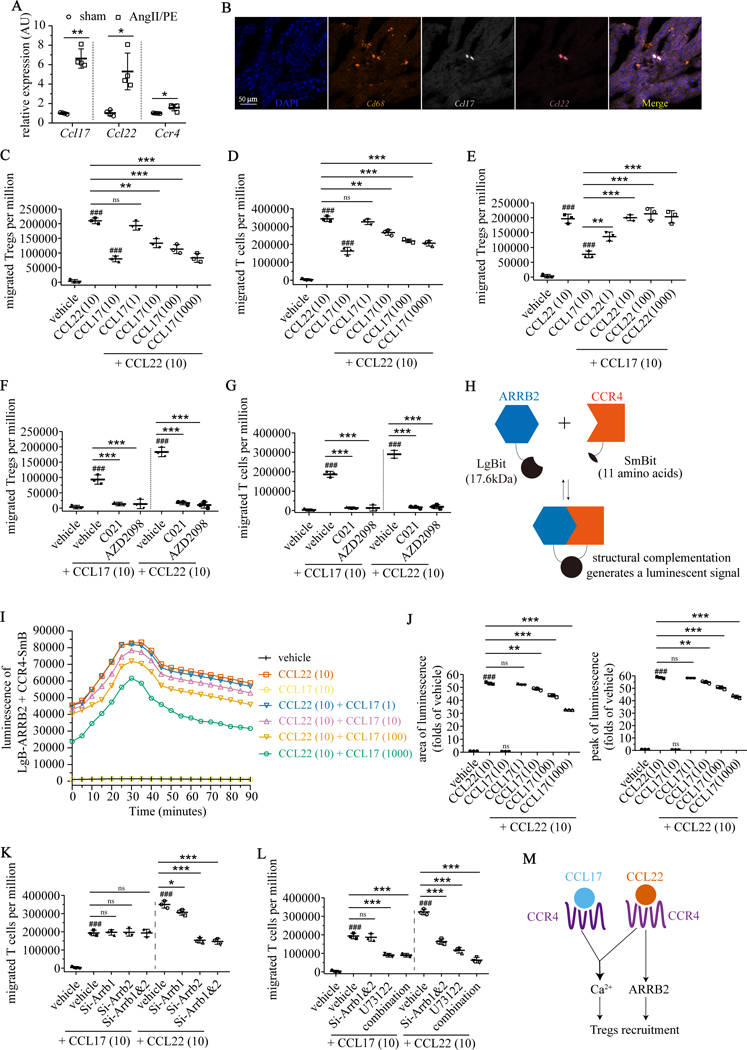
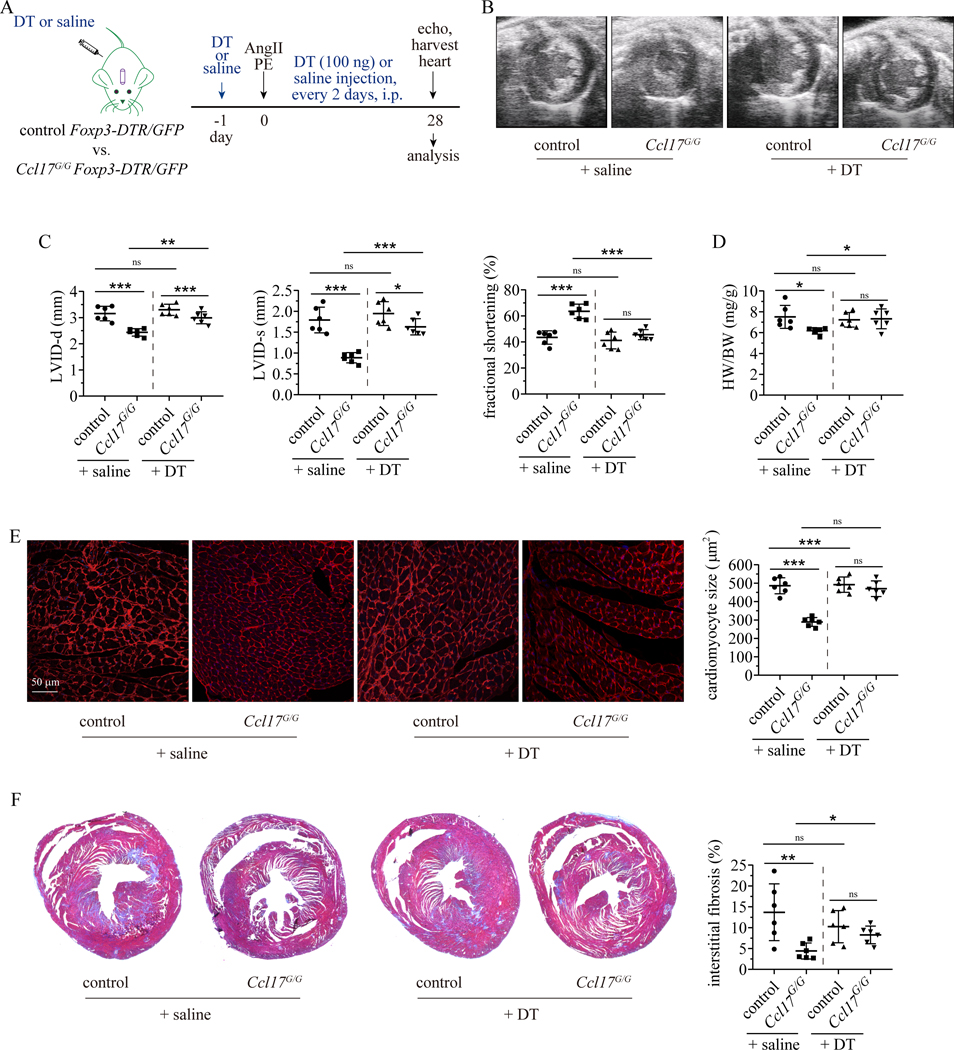
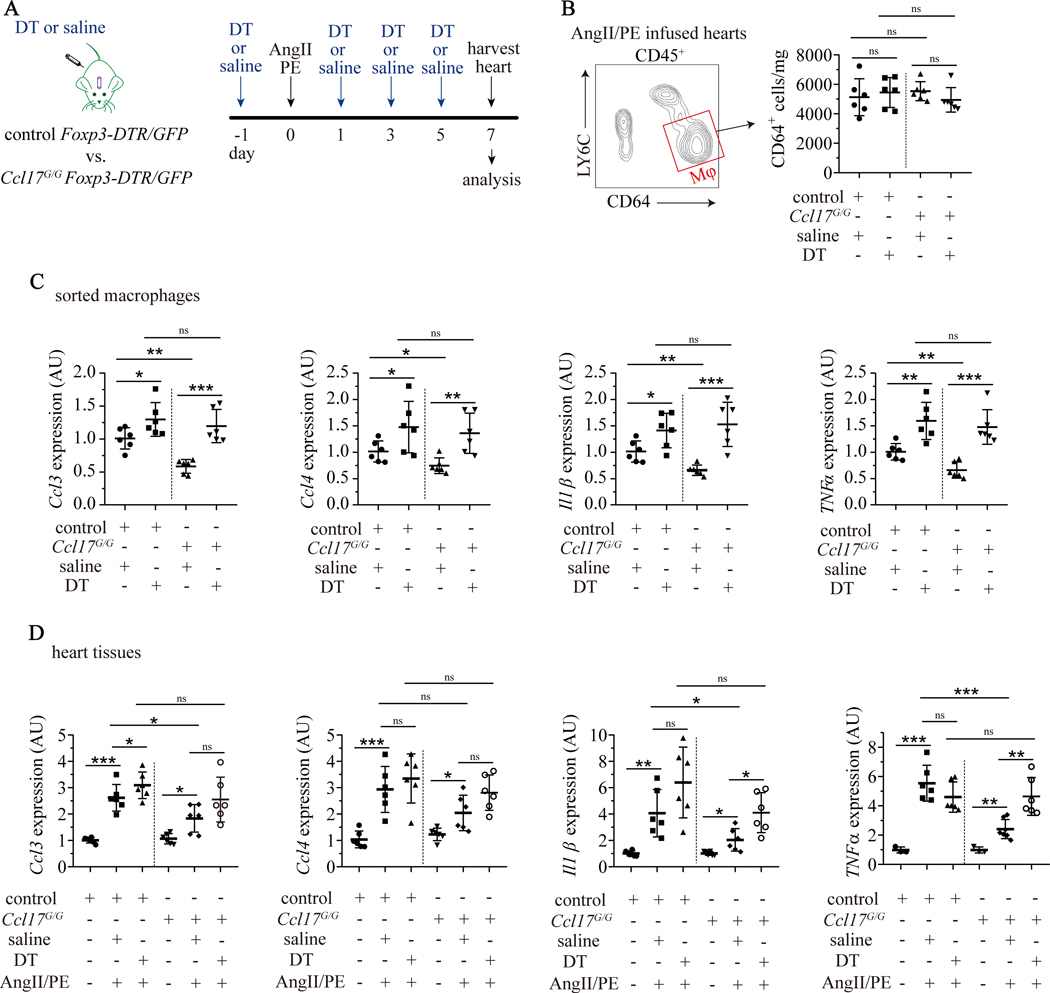
Results: We demonstrated that CCL17 is expressed in CCR2+ macrophages and cluster of differentiation 11b+ conventional dendritic cells after myocardial infarction, angiotensin II and phenylephrine infusion, and diphtheria toxin cardiomyocyte ablation. We clarified the transcriptional signature of CCL17+ macrophages and dendritic cells and identified granulocyte-macrophage colony-stimulating factor (GM-CSF) signaling as a key regulator of CCL17 expression through cooperative activation of STAT5 (signal transducer and activator of transcription 5) and canonical NF-κB (nuclear factor κ-light-chain-enhancer of activated B cells) signaling. Ccl17 deletion resulted in reduced LV remodeling, decreased myocardial fibrosis and cardiomyocyte hypertrophy, and improved LV systolic function after myocardial infarction and angiotensin II and phenylephrine infusion. We observed increased abundance of regulatory T cells (Tregs) in the myocardium of injured Ccl17 knockout mice. CCL17 inhibited Treg recruitment through biased activation of CCR4. CCL17 activated Gq signaling and CCL22 (C-C chemokine ligand 22) activated both Gq and ARRB (β-arrestin) signaling downstream of CCR4. CCL17 competitively inhibited CCL22 stimulated ARRB signaling and Treg migration. We provide evidence that Tregs mediated the protective effects of Ccl17 deletion on myocardial inflammation and adverse LV remodeling.

Conclusions: These findings identify CCL17 as a proinflammatory mediator of CCR2+ macrophages and dendritic cells and suggest that inhibition of CCL17 may serve as an effective strategy to promote Treg recruitment and suppress myocardial inflammation.

Keywords: T-lymphocytes, regulatory; chemokine CCL17; dendritic cells; inflammation; macrophages; monocytes.


Figures

Figure 1.
Figure 1.. CCL17 is expressed following myocardial injury.
A, Quantitative RT-PCR measuring Ccl17 mRNA expression in hearts of Tnnt2-DTR mice 2 and 4 days after diphtheria toxin (DT, n=4) or normal saline (vehicle, n=4) administration. B, Immunostaining for CCL17-GFP (white), CD68 (red) and DAPI (4’,6-diamidino-2-phenylindole; blue) showing the spatial distribution of GFP+ CCL17 expressing cells in hearts of Tnnt2-DTR Ccl17GFP/+ mice 4 days after DT or saline administration. C, Quantitative RT-PCR measuring Ccl17 mRNA expression in hearts of wild type mice 2, 4, 7, 14 and 28 days after closed chest ischemia-reperfusion (IR, n=4) surgery or sham (n=4) surgery. D, Immunostaining for CCL17-GFP (white), CD68 (red) and DAPI (blue) showing the spatial distribution of GFP+ Ccl17 expressing cells in hearts of Ccl17GFP/+ mice 4 days after IR or sham surgery. E, Quantitative RT-PCR measuring Ccl17 mRNA expression in hearts of wild type mice 2, 4, 7, 14 and 28 days after implantation of osmotic minipump containing normal angiotensin II/phenylephrine (AngII/PE, n=4) or saline (sham, n=4). F, Immunostaining for CCL17-GFP (white), CD68 (red) and DAPI (blue) showing the spatial distribution of GFP+ CCL17 expressing cells in hearts of Ccl17GFP/+ mice 4 days after AngII/PE or saline minipump implantation. G, Flow cytometry revealing GFP+ (CCL17 expressing) immune cells (gated on CD45+ cells) 4 days after DT injection, IR surgery, AngII/PE infusion, and corresponding saline injection or sham treatments. H, Immunostaining for CCL17 (white), CD68 (red) and DAPI (blue) showing the spatial distribution of CCL17 expressing cells in healthy donor hearts (n=6), acute MI hearts (n=4) and chronic ischemic cardiomyopathy hearts (n=6). All data are mean ± SD and one-way ANOVA followed by Dunnett test or Dunnett T3 test was performed. *P< 0.05, **P< 0.01, ***P< 0.001.
Figure 2.
Figure 2.. CCL17 is expressed in CCR2+ macrophages and conventional dendritic cells recruited to the injured heart.
A, Flow cytometry identified two populations of CCL17+ cells in hearts of Tnnt2-DTR Ccl17GFP/+ mice 4 days after DT administration: CCL17+CD64hiLY6Chi (G1) and CCL17+CD64loLy6Clo (G2). B, Flow cytometry demonstrating CCL17+CD64hiLY6Chi (G1) and CCL17+CD64loLY6Clo (G2) cells in hearts of CCL17GFP/+ mice 4 days after IR and AngII/PE injury. C, Quantitative RT-PCR comparing Ccl17 mRNA expression in CCL17+ G1 and G2 cells from DT injured hearts. n=4 per experimental group. D, Representative Hema-3 stained images of CCL17+ G1 (n=20) and G2 (n=20) cells from DT injured hearts (left panel) and quantification of cells area (right panel). E, Flow cytometry showing ZBTB46+CD64loLY6Clo dendritic cells (G3) in hearts of Tnnt2-DTR Zbtb46GFP/+ mice 4 days after DT administration. F, Flow cytometry overlay plots of CCL17+ G1 and G2 cells with ZBTB46+ dendritic cells (G3). G, Flow cytometry gating strategy for CD64hiLY6Clo macrophages (G4) in hearts of Tnnt2-DTR mice 4 days after DT administration. H, Principal component analysis (PCA) of RNA sequencing data obtained from CCL17+ G1 and G2 cells, ZBTB46+ dendritic cells (G3) and CD64hiLY6Clo macrophages (G4). n=4 per experimental group. I, Expression levels of characteristic macrophage markers (Cd64, Cd68, F4/80, MertK) and dendritic cell markers (Zbtb46, Cd26, Cd11c, Cd103). Plotted values are displayed as log2 counts per million (cpm). n=4 per experimental group. J, Hierarchical clustering of 1000 genes highlighting distinct signatures of CCL17+ G1 and G2 cells. K, Volcano plot showing genes differentially expressed between CCL17+ G1 and G2 cells. L, Heat map of genes associated with inflammation that were differentially expressed (P < 0.05) between G1 and G2 populations obtained from DT injured hearts. M, Schematic depicting the relative timing of DT injection, CCR2 inhibitor administrations, and flow cytometry analysis. N, Quantitative RT-PCR measuring Ccl17 mRNA expression in hearts of Tnnt2-DTR Ccl17GFP/+ mice treated with vehicle or RS 504393 4 days after DT administration. n=6 per experimental group. O, Numbers of total CCL17+ cells, G1, and G2 cells per mg of heart tissue from DT and RS 504393 treated mice, analyzed by flow cytometry. N=4 per experimental group and all data are mean ± SD. For comparisons between two groups (C, D and O), unpaired t test was performed. For multiple comparisons (I and N), one-way ANOVA followed by Tukey test or Games-Howell test was performed. *P< 0.05, **P< 0.01, ***P< 0.001, and ns indicates non-significance.
Figure 3.
Figure 3.. GM-CSF-STAT5 signaling is essential to specify CCL17+ cells.
A, Tnnt2-DTR Ccl17GFP/+ mice were treated with normal saline (vehicle) or DT on day 0, followed by isotype control (ISO-Nab) or GM-CSF neutralizing antibody (G-Nab) on days 1 and 3, and hearts harvested on day 4 for analysis. B, Quantitative RT-PCR measuring Ccl17 mRNA expression in hearts. C, Flow cytometry quantifying the percentage of CCL17+ immune cells (left panel) and the number of CCL17+ immune cells per mg heart tissue (right panel). D-G, Flow cytometry showing levels of phosphorylated STAT5 (pSTAT5) in all CCL17+ cells (D), CCL17+ G1 cells (E), CCL17+ G2 cells (F), and CD45+CCL17 cells (G) isolated from hearts. H, Ccl17GFP/+ mice were treated with saline (sham) or AngII/PE infusion via osmotic minipump on day 0 and administered ISO-Nab or GM-CSF neutralizing antibodies on days 1 and day 3. Hearts were harvested on day 4 for analysis. I, Quantitative RT-PCR measuring Ccl17 mRNA expression in hearts. J, Flow cytometry quantifying the percentage of CCL17+ immune cells (left panel) and the number of CCL17+ immune cells per mg heart tissue (right panel). K-N, Flow cytometry showing levels of pSTAT5 in all CCL17+ cells (K), CCL17+ G1 cells (L), CCL17+ G2 cells (M), and CD45+CCL17 cells (N) isolated from the hearts of mice treated with AngII/PE and ISO-Nab or G-Nab. O, Ccl17GFP/+ mice were subjected to closed-chest IR injury (90 minutes of ischemia) on day 0 and were administered ISO-Nab or G-Nab on days 1 and day 3. Hearts were harvested on day 4 for analysis. P, Flow cytometry quantifying the percentage of CCL17+ immune cells (left panel) and the number of CCL17+ immune cells per mg heart tissue (right panel). Q-T, Flow cytometry showing levels of pSTAT5 in all CCL17+ cells (Q), CCL17+ G1 cells (R), CCL17+ G2 cells (S), and CD45+CCL17 cells (T) isolated from hearts. D-G, K-N, Q-T, black: IgG control, red: pSTAT5 antibody and ISO control treatment, blue: pSTAT5 antibody and G-Nab treatment. For comparisons between two groups, unparied t tests were performed. For multiple comparisons, one-way ANOVA followed by Tukey test was performed. N=4 per experimental group and all data are mean ± SD. *P< 0.05, **P< 0.01, ***P< 0.001, and ns indicates non-significance.
Figure 4.
Figure 4.. Deficiency of Ccl17 attenuates LV remodeling following MI and AngII/PE infusion.
A, Control (Ccl17+/+) mice and Ccl17 knockout (Ccl17GFP/GFP, abbreviated as Ccl17G/G) mice were subjected to closed-chest IR injury or sham surgery on day 0. Hearts were harvested on day 28 after MI. B, Measurement of heart weight to body weight ratio (HW/BW) in control and Ccl17G/G mice following sham surgery (n=6) or MI (n=12). C, Representative end systolic echocardiographic images of control and Ccl17G/G hearts 28 days after MI. Regional LV displacement throughout the cardiac cycle is displayed. D-F, Quantification of LV ejection fraction (LVEF), LV end-diastolic volume (LVEDV) and LV end-systolic volume (LVESV) 28 days after IR surgery. G, Representative images of infarct area identified by trichrome staining (left panel). Quantification of infarct area (right panel). H, Control and Ccl17G/G mice were implanted with osmotic minipumps containing AngII/PE (n=6) or normal saline (sham, n=6) on day 0. Hearts were harvested on day 28 for analysis. I, Measurement of heart weight to body weight ratio (HW/BW) in control and Ccl17G/G mice implanted with osmotic minipumps containing AngII/PE or saline (sham). J, Represent WGA stained images (mid-LV) showing cardiomyocytes in cross-section (red, left panel) and quantification of cardiomyocyte cross-sectional area (right panel). K, Representative low magnification trichrome staining images to visualize interstitial fibrosis (left panel). Quantification of fibrotic area based on trichrome staining (right panel). All data are mean ± SD. For comparisons between two groups, unpaired t test was performed. For multiple comparisons, two-way ANOVA with Geisser-Greenhouse correction followed by Sidak test was performed. *P< 0.05, **P< 0.01, ***P< 0.001.
Figure 5.
Figure 5.. Ccl17 deficiency increases cardiac Treg abundance.
A, Control (Ccl17+/+) and Ccl17 knockout (Ccl17GFP/GFP, abbreviated as Ccl17G/G) mice were subjected to closed-chest IR injury on day 0 and hearts were harvested on day 4 for analysis. B, Flow cytometry gating scheme utilized to identify CD4+ FOXP3+ Tregs. C, Ccl17 deficiency led to expansion of Tregs expansion in hearts of IR injured mice. Flow cytometry showing the proportion of cardiac FOXP3+ Tregs among total CD4+ cells (left panel) and the number of FOXP3+ Tregs per mg heart tissue (right panel) after IR injury. D, Flow cytometry showing expression of CCR4 in cardiac Tregs from hearts of IR injured mice. Black: isotype control, red: CCR4 antibody. E, Control Foxp3-GFP mice and Ccl17G/G Foxp3-GFP were implanted with osmotic minipumps containing AngII/PE on day 0. Hearts were harvested on day 7 for analysis. F, Flow cytometry gating scheme utilized to identify FOXP3-GFP+ Tregs. G, Ccl17 deficiency increased Treg abundance in the hearts of AngII/PE infused mice. Flow cytometry demonstrating the proportion of cardiac FOXP3-GFP+ Tregs among total CD4+ cells (left panel) and the number of FOXP3-GFP+ Tregs per mg heart tissue (right panel) after AngII/PE infusion. H, Flow cytometry plots showing expression of CCR4 in Tregs from hearts of AngII/PE infused mice. Black, isotype control. Red, CCR4 antibody. N=4 per experimental group and all data are mean ± SD. Comparisons were calculated by unpaired t test. **P< 0.01, **P< 0.01.
Figure 6
Figure 6. CCL17 and CCL22 are competitive biased CCR4 ligands that differentially modulate Treg chemotaxis.
A, Quantitative RT-PCR measuring mRNA levels of Ccl17, Ccl22 and CCR4 in hearts of wild type mice 4 days after implantation of osmotic minipump containing AngII/PE (n=4) or normal saline (sham, n=4). B, Representative images of DAPI (blue), Cd68 (orange), Ccl17 (white) and Ccl22 (magenta) in hearts of AngII/PE infused mice by RNA in situ hybridization. C-D, Chemotaxis of primary induced-Tregs (C) and BW5147.3 T cells (D) in response to CCL22 (10 ng/mL) was suppressed by increasing concentrations of CCL17 (1, 10, 100, 1000 ng/mL). E, Chemotaxis of primary induced-Tregs in response to single dose CCL17 (10 ng/mL) was augmented by increasing concentrations of CCL22 (1, 10, 100, 1000 ng/mL). F-G, Chemotaxis of primary induced-Tregs (F) and BW5147.3 T cells (G) in response to CCL22 (10 ng/mL) and CCL17 (10 ng/mL) was abrogated by CCR4 antagonists (C021, AZD2098). H, Strategy to detect interactions between β-arrestin2 (ARRB2) and CCR4 using NanoBiT® Protein-Protein Interaction System. ARRB2 was fused to Large BiT (LgBit) and CCR4 was fused to Small BiT (SmBit). Constructs were expressed in BW5147.3 T cells. Interaction of fusion partners leads to structural complementation of LgBiT with SmBiT, generating a functional enzyme with a bright, luminescent signal. I, Luminescence intensity measured over 90 minutes in BW5147.3 T cells transfected with ARRB2-LgBit and CCR4-SmBit. Cells were treated with vehicle, CCL17, CCL22, and CCL22 + increasing concentrations of CCL17. J, Quantification of luminescence intensity measured by area under the curve (left panel) and peak intensity (right panel). K, Chemotaxis of BW5147.3 T cells in response to CCL22 (10 ng/mL), but not to CCL17 (10 ng/mL), was suppressed by small interfering RNAs targeting Arrb1 (Si-Arrb1), Arrb2 (Si-Arrb2), or Arrb1 and Arrb2 (Si-Arrb1&2). L, Effects of Si-Arrb1&2 and phospholipase C (PLC) inhibitor U73122 (10 μM) on the chemotaxis of BW5147.3 T cells in response to CCL22 (10 ng/mL) and CCL17 (10 ng/mL). Chemotaxis in response to CCL17 (10 ng/mL) was suppressed by U73122. Chemotaxis in response to CCL22 (10 ng/mL) was synergistically suppressed by U73122 with Si-Arrb1&2. M, Schematic of the proposed mechanism by which CCL17 and CCL22 differentially regulate Treg recruitment. All data are mean ± SD. Unpaired t test was performed in Figure A. For Figure B-L, n=3 per experimental group and one-way ANOVA followed by Tukey test was performed. ###P< 0.001, *P< 0.05, **P< 0.01, ***P< 0.001, and ns indicates non-significance.
Figure 7.
Figure 7.. Ccl17 deficiency suppresses LV remodeling through a Treg dependent mechanism.
A, Control (Ccl17+/+) and Ccl17G/G mice were crossed with Foxp3-DTR/GFP to generate control Foxp3-DTR/GFP and Ccl17G/G Foxp3-DTR/GFP mice in which Tregs are deleted after diphtheria toxin (DT) administration. Osmotic minipumps containing AngII/PE were implanted into control Foxp3-DTR/GFP and Ccl17G/G Foxp3-DTR/GFP mice. Mice were treated with DT or normal saline every two days. Echocardiography was performed on day 28 and hearts were harvested thereafter. B, Representative echocardiographic images of control + saline, control + DT, Ccl17G/G + saline, Ccl17G/G + DT hearts 28 days after AngII/PE infusion. C, Quantification of left ventricular internal diameter at end-diastole (left panel) and at end-systole (center panel) and left ventricular fractional shortening (right panel) 28 days after AngII/PE infusion. D, Quantification of heart weight to body weight ratio (HW/BW). E, WGA staining (red) examining the effects of Treg depletion on cardiomyocyte hypertrophy of control mice and Ccl17G/G mice 28 days after AngII/PE infusion (left panel). Quantification of cardiomyocyte cross-sectional area based on WGA staining (right panel). F, Low magnification trichrome stained images (left panel) examining the effects of Treg depletion on myocardial interstitial fibrosis in control and Ccl17G/G mice 28 days after AngII/PE injury. Quantification of fibrotic area based on trichrome staining (right panel). N=6 per group and all data are mean ± SD. Two-way ANOVA with Geisser-Greenhouse correction followed by Sidak test was performed. *P< 0.05, **P< 0.01, ***P< 0.001, and ns indicates non-significance.
Figure 8.
Figure 8.. Ccl17 deficiency suppresses macrophages associated inflammation through a Treg dependent mechanism.
A, Schematic of Treg depletion in control (Ccl17+/+) mice and Ccl17 deficient (Ccl17GFP/GFP, abbreviated as Ccl17G/G) mice infused with AngII/PE. Control Foxp3-DTR/GFP and Ccl17G/G Foxp3-DTR/GFP mice were implanted with minipumps containing AngII/PE and injected with DT (abbreviated as control + DT and Ccl17G/G + DT) or normal saline (abbreviated as control + saline and Ccl17G/G + saline) every two days. Hearts were harvested on day 7 for analysis. B, Effect of Treg deletion on cardiac macrophage abundance following AngII/PE infusion. Strategy to isolate CD45+LY6CCD64+ macrophages by FACS from AngII/PE infused hearts (left panel). Quantification of CD64+ macrophage number per mg heart tissue (right panel). C, Quantitative RT-PCR measuring mRNA levels of chemokine (C-C) ligand 3 (Ccl3), Ccl4, Interleukin 1β (Il1β) and tumor necrosis factor α (TNFα) in sorted macrophages from AngII/PE injured hearts. D, Quantitative RT-PCR measuring mRNA levels of Ccl3, Ccl4, Il1β and TNFα in heart tissue from saline and AngII/PE infused mice. N=6 per group and all data are mean ± SD. Two-way ANOVA with Geisser-Greenhouse correction followed by Sidak test was performed. *P< 0.05, **P< 0.01, ***P< 0.001 and ns indicates non-significance.

References

    1. Westermann D, Lindner D, Kasner M, Zietsch C, Savvatis K, Escher F, Von Schlippenbach J, Skurk C, Steendijk P, Riad A. Cardiac inflammation contributes to changes in the extracellular matrix in patients with heart failure and normal ejection fraction. Circulation: Heart Failure. 2011;4:44–52. - PubMed
    1. Marchant DJ, Boyd JH, Lin DC, Granville DJ, Garmaroudi FS, McManus BM. Inflammation in myocardial diseases. Circulation research. 2012;110:126–144. - PubMed
    1. Hanna A, Frangogiannis NG. Inflammatory Cytokines and Chemokines as Therapeutic Targets in Heart Failure. Cardiovascular Drugs and Therapy. 2020;34:1–15. - PMC - PubMed
    1. Gullestad L, Ueland T, Vinge LE, Finsen A, Yndestad A, Aukrust P. Inflammatory cytokines in heart failure: mediators and markers. Cardiology. 2012;122:23–35. - PubMed
    1. Adamo L, Rocha-Resende C, Prabhu SD, Mann DL. Reappraising the role of inflammation in heart failure. Nature Reviews Cardiology. 2020;17:269–285. - PubMed

Publication types