. 2022 Feb 4;375(6580):eabj4008.
doi: 10.1126/science.abj4008. Epub 2022 Feb 4.

CRISPR activation and interference screens decode stimulation responses in primary human T cells

Affiliations

CRISPR activation and interference screens decode stimulation responses in primary human T cells

Ralf Schmidt et al. Science. .

Abstract

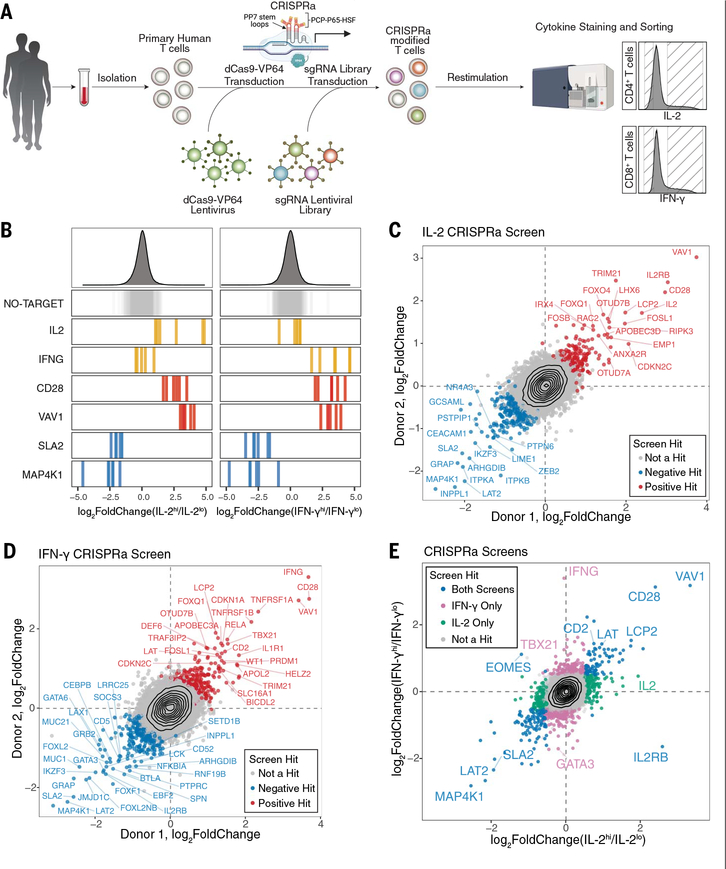
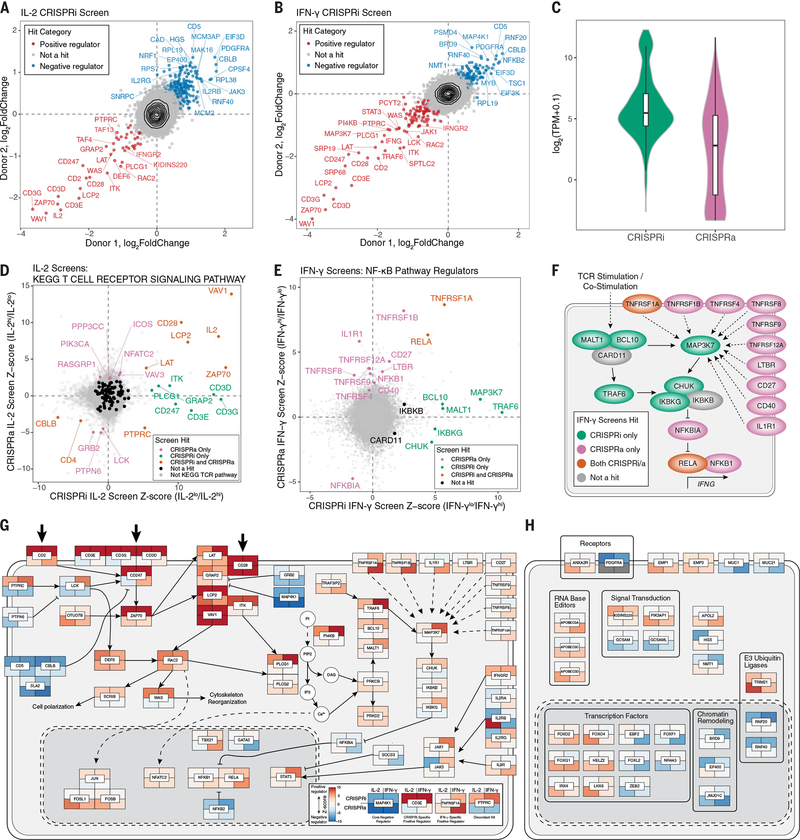
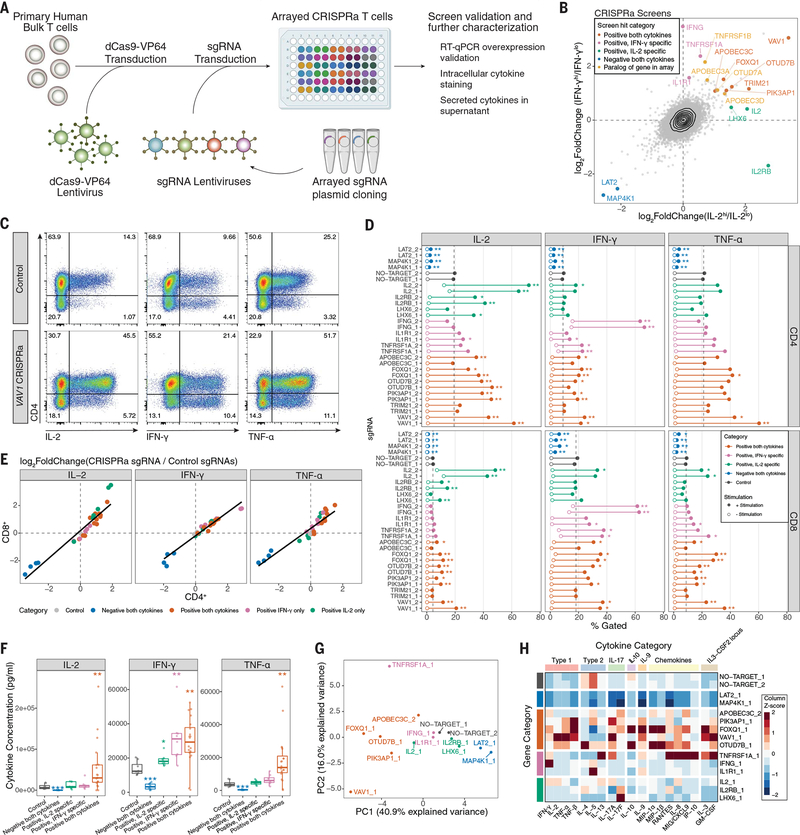
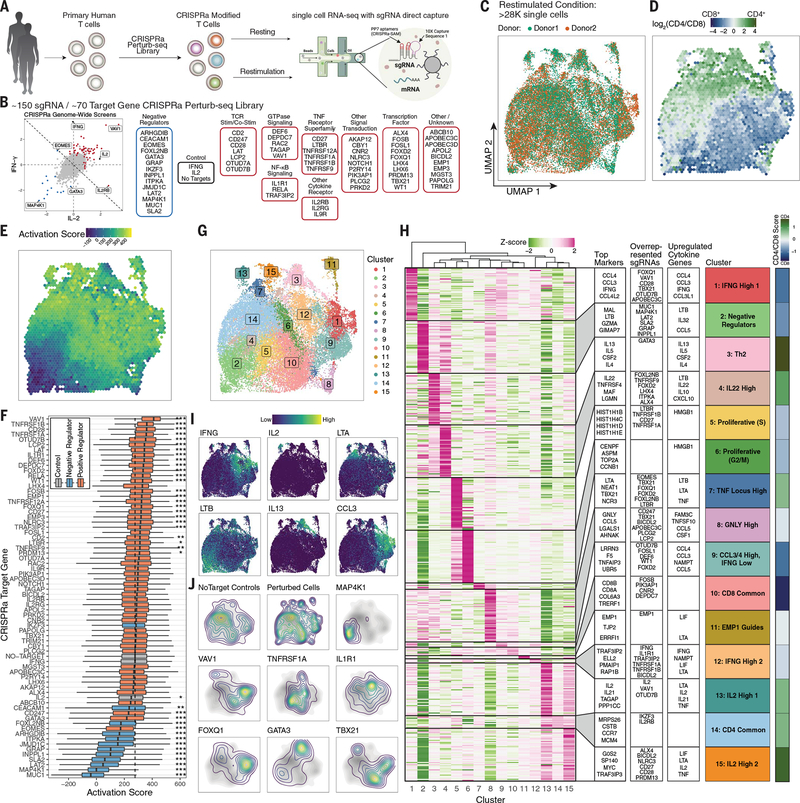
Regulation of cytokine production in stimulated T cells can be disrupted in autoimmunity, immunodeficiencies, and cancer. Systematic discovery of stimulation-dependent cytokine regulators requires both loss-of-function and gain-of-function studies, which have been challenging in primary human cells. We now report genome-wide CRISPR activation (CRISPRa) and interference (CRISPRi) screens in primary human T cells to identify gene networks controlling interleukin-2 (IL-2) and interferon-γ (IFN-γ) production. Arrayed CRISPRa confirmed key hits and enabled multiplexed secretome characterization, revealing reshaped cytokine responses. Coupling CRISPRa screening with single-cell RNA sequencing enabled deep molecular characterization of screen hits, revealing how perturbations tuned T cell activation and promoted cell states characterized by distinct cytokine expression profiles. These screens reveal genes that reprogram critical immune cell functions, which could inform the design of immunotherapies.


Conflict of interest statement

Competing interests: A.M. is a compensated cofounder, member of the boards of directors, and member of the scientific advisory boards of Spotlight Therapeutics and Arsenal Biosciences. A.M. and C.J.Y. are cofounders, members of the boards of directors, and members of the scientific advisory board of Survey Genomics. A.M. is a compensated member of the scientific advisory board of NewLimit. A.M. was a compensated member of the scientific advisory board at PACT Pharma and was a compensated adviser to Juno Therapeutics. A.M. owns stock in Arsenal Biosciences, Spotlight Therapeutics, NewLimit, Survey Genomics, PACT Pharma, and Merck. A.M. has received fees from Vertex, Merck, Amgen, Trizell, Genentech, AlphaSights, Rupert Case Management and Bernstein and is an investor in and informal adviser to Offline Ventures and a client of EPIQ. The Marson laboratory has received research support from Juno Therapeutics, Epinomics, Sanofi, GlaxoSmithKline, Gilead, and Anthem. C.J.Y. is a Scientific Advisory Board member for and holds equity in Related Sciences and ImmunAI, a consultant for and holds equity in Maze Therapeutics, and a consultant for TReX Bio. C.J.Y. has received research support from Chan Zuckerberg Initiative and Genentech. J.W.F. is a consultant for NewLimit. R.S., Z.S., and A.M. are listed as inventors on a patent application related to this work. The remaining authors declare no competing interests.

Figures

Fig. 1.
Fig. 1.. Genome-wide CRISPRa screens for cytokine production in stimulated primary human T cells.
(A) Schematic of CRISPRa screens. (B) sgRNA log2-fold changes for genes of interest in IL-2 (left) and IFN-γ (right) screens. Bars represent the mean log2-fold change for each sgRNA across two human blood donors. Density plots above represent the distribution of all sgRNAs. (C and D) Scatter plots of median sgRNA log2-fold change (high/low sorting bins) for each gene, comparing screens in two donors, for IL-2 (C) and IFN-γ (D) screens. (E) Comparison of gene log2-fold change (median sgRNA, mean of two donors) in IL-2 and IFN-γ screens.
Fig. 2.
Fig. 2.. Integrated CRISPRa and CRISPRi screens mapping the genetic circuits underlying T cell cytokine response in high resolution.
(A and B) Median sgRNA log2-fold change (high/low sorting bins) for each gene, comparing CRISPRi screens in two donors, for IL-2 (A) and IFN-γ (B) screens. (C) Distributions of gene mRNA expression for CRISPRa and CRISPRi cytokine screen hits in resting CD4+ T cells (this study). (D) Comparison of IL-2 CRISPRi and CRISPRa screens with genes belonging to the TCR signaling pathway (KEGG pathways) indicated in colors other than gray. (E) Comparison of IFN-γ CRISPRi and CRISPRa screens with manually selected NF-κB pathway regulators labeled. All other genes are shown in gray. (F) Map of NF-κB pathway regulators labeled in (D). (G) Map of screen hits with previous evidence of defined function in T cell stimulation and costimulation signal transduction pathways. Genes shown are significant hits in at least one screen and were selected based on review of the literature and pathway databases (e.g., KEGG and Reactome). Tiles represent proteins encoded by indicated genes with the caveat that, because of space constraints, subcellular localization is inaccurate because many of the components shown in the cytoplasm occur at the plasma membrane. Tiles are colored according to log2-fold change Z score, as shown in the subpanel, with examples of different hits. Large arrows at the top represent stimulation/costimulation sources. (H) Select screen hits with less well-described functions in T cells in the same format as (G). For (H), only significant hits from the top 20 positive and negative ranked genes by log2-fold change for each screen were candidates for inclusion.
Fig. 3.
Fig. 3.. Characterization of CRISPRa screen hits by arrayed profiling.
(A) Schematic of arrayed experiments. (B) Comparison of IL-2 (in CD4+ T cells) and IFN-γ (in CD8+ T cells) CRISPRa screens, with genes targeted by the arrayed sgRNA panel indicated, as well as their screen hit categorization. Paralogs of arrayed panel genes that were also highly ranked hits are additionally indicated. (C) Representative intracellular cytokine staining flow cytometry for indicated cytokines in control (NO-TARGET_1 sgRNA) or VAV1 (VAV1_1 sgRNA) CRISPRa T cells after 10 hours of stimulation. (D) Intracellular cytokine staining of full arrayed sgRNA panel, showing the percentage of cells that gated positive for the indicated cytokines in CD4+ or CD8+ T cells. Points represent the mean value of four donors, with and without stimulation. Dashed vertical lines represent the mean no-target control sgRNA control value with stimulation. *q < 0.05, **q <0.01, Mann–Whitney U test, followed by q value multiple-comparisons correction. Full data are provided in fig. S11B. The medium stimulation dose is shown for IL-2 and IFN-γ, and low-dose stimulation is shown for TNF-α. (E) Scatter plot comparison of log2-fold changes in the percentage of cytokine-positive cells for arrayed panel sgRNAs versus the mean of no-target control sgRNAs in stimulated CD4+ and CD8+ cells using the same data from (D). (F) Secreted cytokine staining arrayed panel grouped by indicated gene categories, with sgRNAs targeting the IL2 and IFNG genes removed. Points represent a single gene and donor measurement. *P < 0.05, **P < 0.01, ***P < 0.001, Mann–Whitney U test. (G) Principal component analysis of secreted cytokine measurements resulting from the indicated CRISPRa sgRNAs. (H) Heatmap of selected secreted cytokine measurements grouped by indicated biological category. Values represent the median of four donors, followed by Z-score scaling for each cytokine.
Fig. 4.
Fig. 4.. CRISPRa Perturb-seq captures diverse T cell states driven by genome-wide cytokine screen hits.
(A) Schematic of CRISPRa Perturb-seq experiment. (B) Categorical breakdown of genes targeted by the sgRNA library comprising hits from our primary genome-wide CRISPRa cytokine screens as indicated. Genes with a summed log2-fold change less than zero across both screens (diagonal line) are categorized as negative regulators. (C) UMAP projection of post–quality control filtered restimulated T cells, colored by blood donor. (D) Distribution of CD4+ and CD8+ T cells across restimulated T cell UMAP projection. Each bin is colored by the average log2(CD4/CD8) transcript levels of cells in that bin. (E) Restimulated T cell UMAP colored by average cell activation score in each bin. (F) Boxplots of restimulated T cells’ activation scores grouped by sgRNA target genes. Dashed line represents the median activation score of no-target control cells. *P < 0.05, **P < 0.01, ***P < 0.001, Mann–Whitney U test with Bonferroni correction. (G) Restimulated T cell UMAP with cells colored by cluster. (H) Heatmap of differentially expressed marker genes in each cluster. The top 50 statistically significant (FDR < 0.05) differentially up-regulated genes for each cluster are shown, with genes that are up-regulated in multiple clusters being given priority to the cluster with the higher log2-fold change for the given gene. To the right of the heatmap are (left to right), the top marker genes by log2-fold change in each clusters’ section, the top overrepresented sgRNAs in each cluster by odds ratio (full data are provided in fig. S20G), and the top differentially up-regulated cytokine genes in each cluster. Mean cell log2(CD4/CD8) cell transcript values in each cluster are shown on the far right. (I) Restimulated T cell UMAP with the expression of indicated genes shown. (J) Contour density plots of restimulated cells assigned to indicated sgRNA targets in UMAP space. The no-target control contour is shown in grayscale underneath. “Perturbed cells” represents all cells assigned a single sgRNA other than no-target control sgRNAs.

Comment in

References

    1. Abbas AK, Trotta E, R Simeonov D, Marson A, Bluestone JA, Revisiting IL-2: Biology and therapeutic prospects. Sci. Immunol. 3, eaat1482 (2018). doi: 10.1126/sciimmunol.aat1482 - DOI - PubMed
    1. Ni L, Lu J, Interferon gamma in cancer immunotherapy. Cancer Med. 7, 4509–4516 (2018). doi: 10.1002/cam4.1700 - DOI - PMC - PubMed
    1. Castro F, Cardoso AP, Gonçalves RM, Serre K, Oliveira MJ, Interferon-gamma at the crossroads of tumor immune surveillance or evasion. Front. Immunol. 9, 847 (2018). doi: 10.3389/fimmu.2018.00847 - DOI - PMC - PubMed
    1. Ivashkiv LB, IFNγ: Signalling, epigenetics and roles in immunity, metabolism, disease and cancer immunotherapy. Nat. Rev. Immunol. 18, 545–558 (2018). doi: 10.1038/s41577-018-0029-z - DOI - PMC - PubMed
    1. Malek TR, The biology of interleukin-2. Annu. Rev. Immunol. 26, 453–479 (2008). doi: 10.1146/annurev.immunol.26.021607.090357 - DOI - PubMed

Publication types

MeSH terms