. 2022 Feb 4;375(6580):515-522.
doi: 10.1126/science.abe7489. Epub 2022 Feb 3.

Critical assessment of DNA adenine methylation in eukaryotes using quantitative deconvolution

Affiliations

Critical assessment of DNA adenine methylation in eukaryotes using quantitative deconvolution

Yimeng Kong et al. Science. .

Abstract

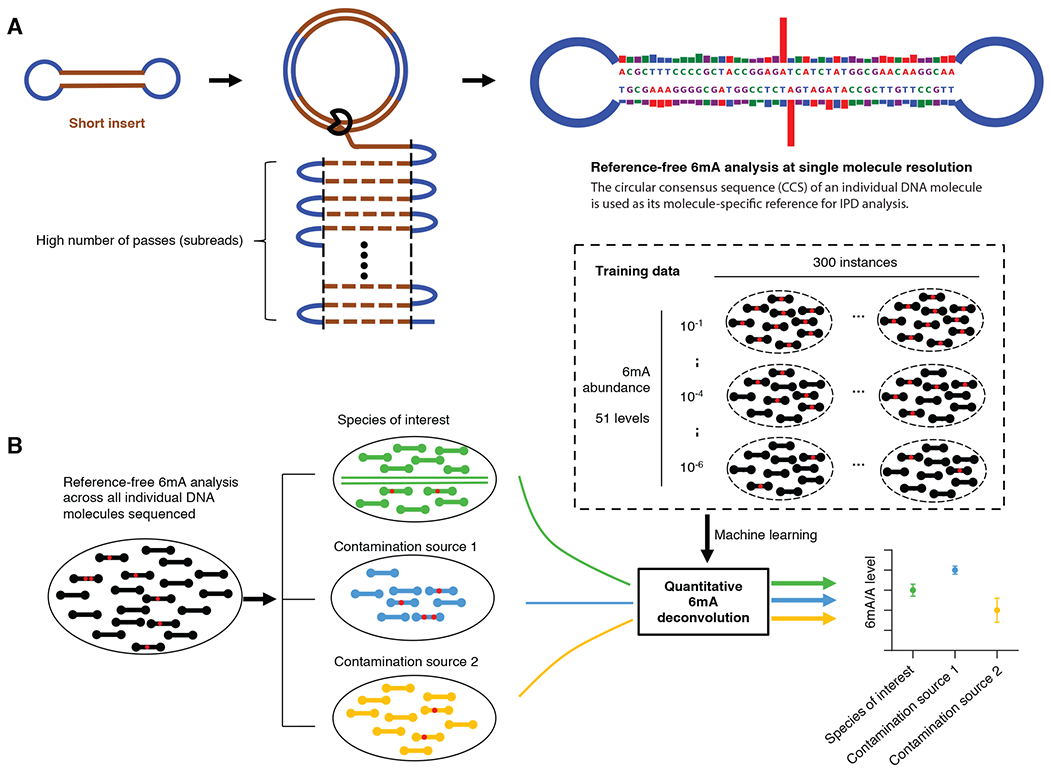
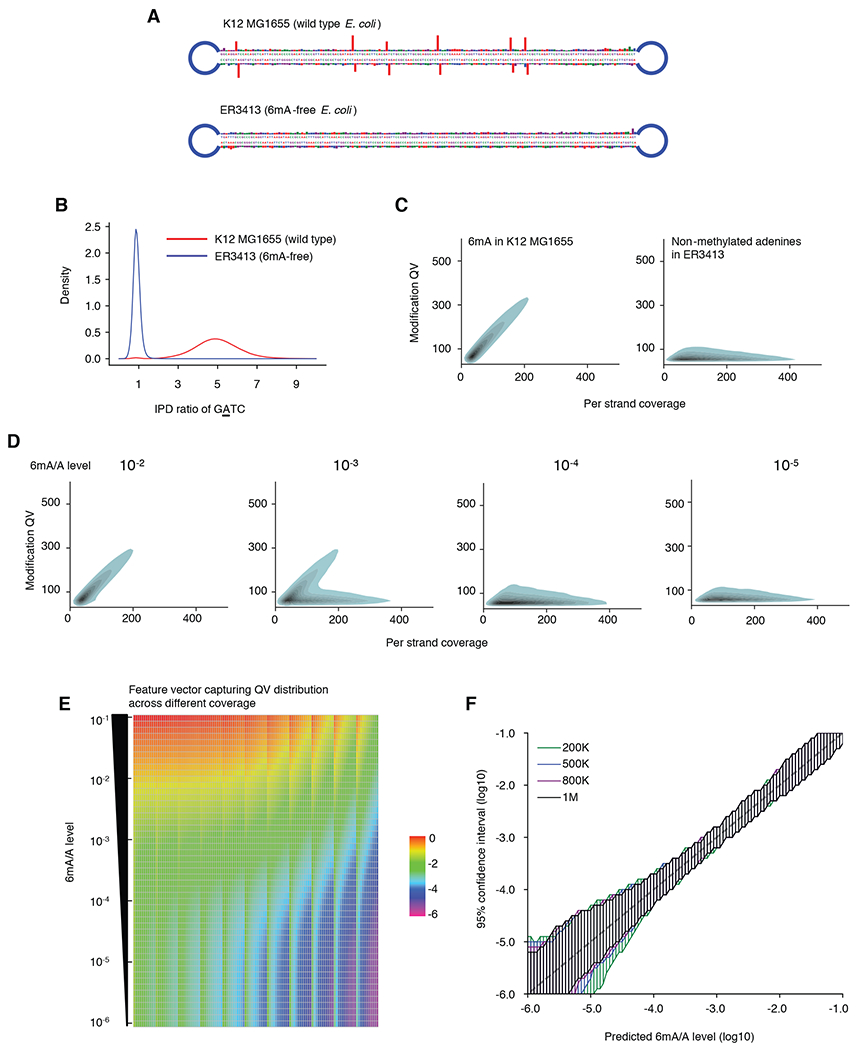
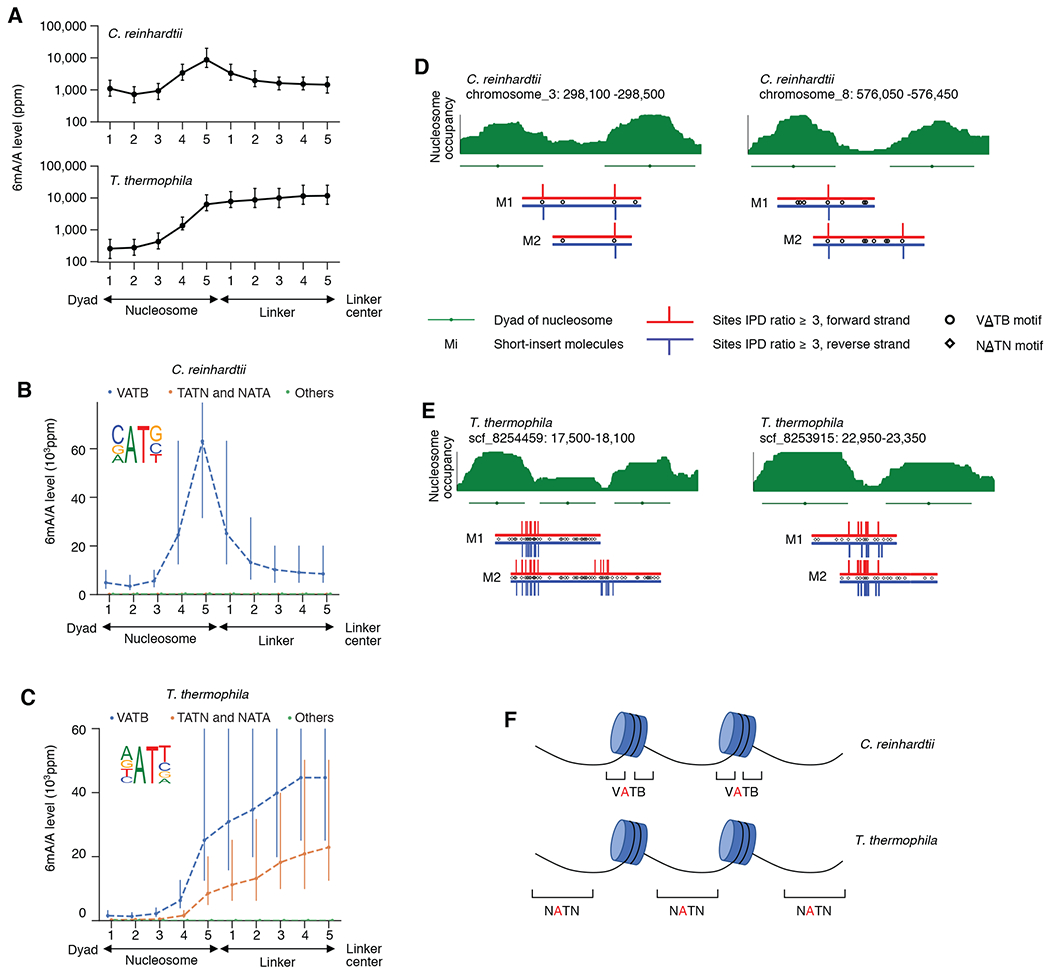
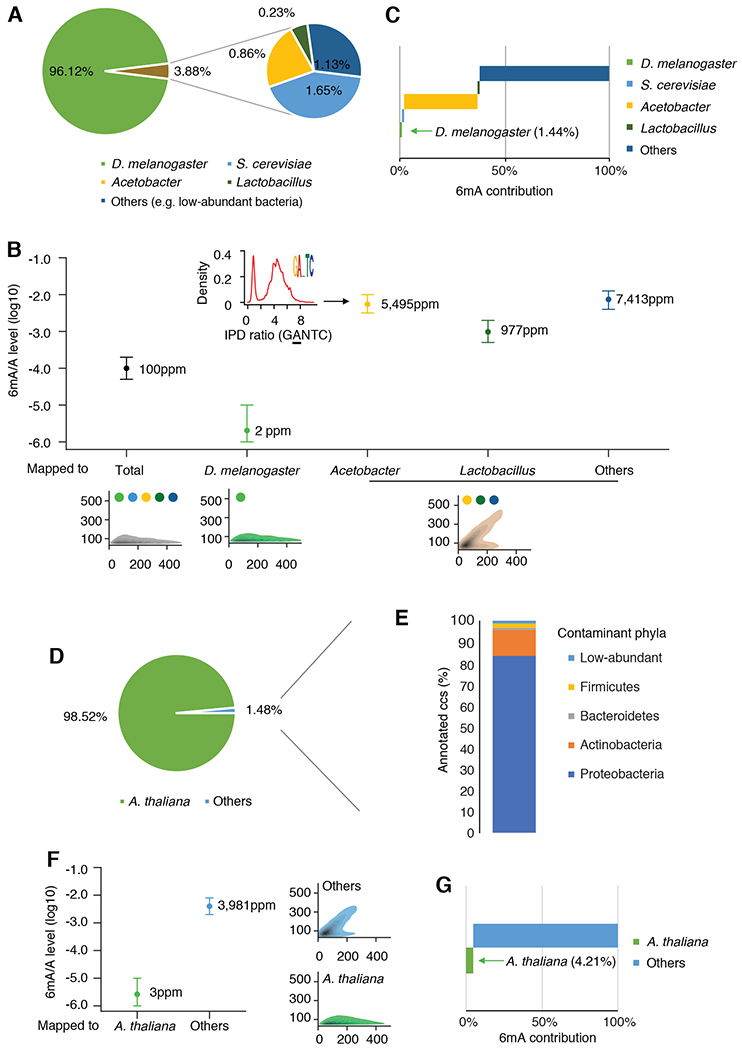
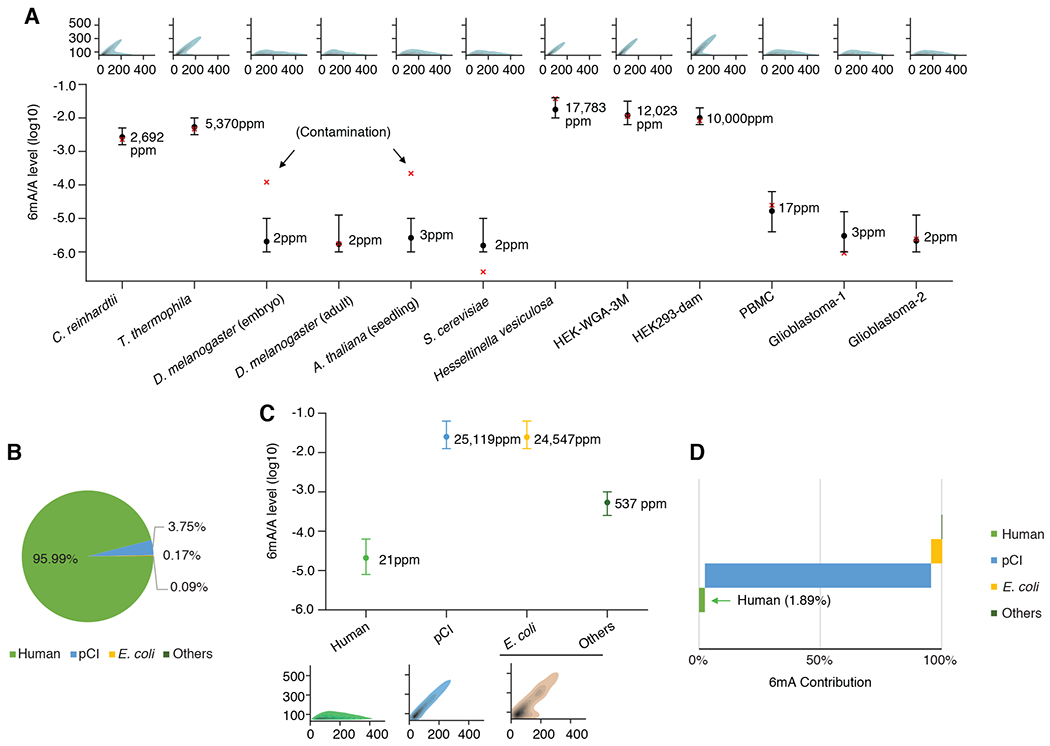
The discovery of N6-methyldeoxyadenine (6mA) across eukaryotes led to a search for additional epigenetic mechanisms. However, some studies have highlighted confounding factors that challenge the prevalence of 6mA in eukaryotes. We developed a metagenomic method to quantitatively deconvolve 6mA events from a genomic DNA sample into species of interest, genomic regions, and sources of contamination. Applying this method, we observed high-resolution 6mA deposition in two protozoa. We found that commensal or soil bacteria explained the vast majority of 6mA in insect and plant samples. We found no evidence of high abundance of 6mA in Drosophila, Arabidopsis, or humans. Plasmids used for genetic manipulation, even those from Dam methyltransferase mutant Escherichia coli, could carry abundant 6mA, confounding the evaluation of candidate 6mA methyltransferases and demethylases. On the basis of this work, we advocate for a reassessment of 6mA in eukaryotes.


Conflict of interest statement

Computing interests: The authors declare no competing financial interests.

Figures

Fig. 1.
Fig. 1.. Overview of 6mASCOPE for quantitative 6mA deconvolution.
(A) Reference-free 6mA analysis of single molecules. Each molecule (short insert) is sequenced for a large number of passes (subreads). The subreads are combined to a circular consensus sequence (CCS), serving as the molecule-specific reference for in silico IPD estimation, and provide repeated measures of IPD values for 6mA analysis (Methods). Blue segment: SMRT adapter. (B) After single molecule 6mA analysis (a red dot indicates a 6mA event), CCSs (black rods) from a sequenced gDNA sample are separated into the eukaryotic genome (green) and contamination sources (blue and yellow). The 6mA/A levels of each species (or genomic region) are estimated using a machine learning model trained across a wide range of 6mA abundance, with defined confidence intervals.
Fig. 2.
Fig. 2.. 6mASCOPE method evaluation.
(A) IPD ratios on illustrative molecules from E. coli wild type strain K12 MG1655 and 6mA-free strain ER3413. Blue segment: SMRT adapter. (B) IPD ratio of adenines on GATC motif in E. coli K12 MG1655 and ER3413. 6mA events have IPD ratios ~5 while non-methylated adenines have IPD ratios ~1. (C) Modification Quality values (QVs) of 6mA linearly (slope ~1.7) deviate from the non-methylated adenines with better separation at high CCS passes. For illustration, kernel density estimation of adenines with QV 50 is shown. Left, 6mA in GATC, GCACNNNNNNGTT and AACNNNNNNTGC from E. coli K12 MG1655. Right, non-methylated adenines in E. coli ER3413. (D) QV distribution varies across different 6mA/A levels. Same legend as in (C). (E) Feature vectors used for machine learning model training. Rows: 51 6mA/A levels (10−1 to 10−6) are constructed by mixing negative and positive controls in silico at different ratios. Each column represents the percentage (averaged across 300 replicates, log10 transformed) of adenines over a number of slopes across CCS passes 20-240x, divided into 11 bins (Methods). (F) For each 6mA quantification (x-axis), 6mASCOPE also provides the 95% confidence interval (y-axis) (Methods). Colors represent the number of CCS reads used for 6mA quantification.
Fig. 3.
Fig. 3.. 6mASCOPE discovers high resolution 6mA deposition in C. reinhardtii and T. Thermophila.
(A) 6mA deposition relative to nucleosomes and linkers in C. reinhardtii and T. thermophila. Genomic regions between the nucleosome dyad and the linker center are divided into ten bins (x-axis) across the genome. 6mA/A level (y-axis) was quantified with 6mASCOPE. Error bars: 95% CIs. (B) 6mA is enriched in VATB motif at nucleosome-linker boundaries in C. reinhardtii. Adenines in each bin are divided into three groups: VATB, TATN/NATA, and others. x- and y-axes are the same as in (A). Error bars: 95% CIs. (C) 6mA is enriched across the NATN motif at linkers in T. thermophila. Same legend as in (B). (D) and (E), Illustrative examples of 6mA enrichment in C. reinhardtii (D) and T. thermophila (E). Nucleosome occupancy (green stack) is based on MNase-seq data (Methods). Nucleosomes (green lines) and dyads (green dots) are determined by iNPS(v1.2.2). SMRT CCS reads (Mi) are shown with red (forward strand) and blue (reverse strand) lines. IPD ratios 3 are shown. (F) Schematic of 6mA enrichment at the nucleosome-linker boundaries in C. reinhardtii, and the gradual 6mA increase from nucleosome boundaries to linker centers in T. thermophila.
Fig. 4.
Fig. 4.. 6mASCOPE analyses show that commensal bacteria contribute to the vast majority of 6mA events in insect and plant samples.
(A) Taxonomic compositions (%) in the D. melanogaster embryo ~0.75h gDNA sample. CCS reads mapped to Acetobacter or Lactobacillus are summarized by genus. (B) 6mA quantification of the D. melanogaster genome and contaminations. For each subgroup, 6mA/A levels are quantified by 6mASCOPE (error bars: 95% CIs). QV distributions are shown at bottom (color dots: species/genus). 6mA/A level of S. cerevisiae is further examined with additional sequencing (Fig. S9). CCS reads from Acetobacter, Lactobacillus and Others (e.g. low-abundant bacteria) are grouped together due to low CCS read counts within each subgroup and CIs are defined based on 8,000 CCS reads. Arrow denotes the density of IPD ratios in GANTC motif in Acetobacter. (C) 6mA contribution (%) from each subgroup in the D. melanogaster embryo sample. (D & E) Taxonomic compositions (%) in the A. thaliana 21-day seedling gDNA sample. The CCS reads in subgroup “Others” (D) are taxonomy classified with Kraken2. Main classes of Proteobacteria are shown in Fig. S12. (F) 6mA quantification of the A. thaliana genome and the contamination (Others). Same legend as in (B). (G) 6mA contribution (%) from each subgroup in the A. thaliana seedling sample.
Fig. 5.
Fig. 5.
6mASCOPE based quantitative deconvolution across multiple human gDNA samples. (A) 6mA/A levels on the genome of interest quantified by 6mASCOPE (error bars: 95% CIs). 6mA/A level in S. cerevisiae is consistent with independent UHPLC-MS/MS measurement (0.3ppm, lower than the minimum 6mA/A level used in 6mASCOPE training dataset). Except for D. melanogaster embryo and A. thaliana gDNA samples (both are contaminated by bacteria), 6mA/A levels by 6mASCOPE are consistent with UHPLC-MS/MS (red cross). For all samples except HEK-WGA-3M and HEK293-dam, the UHPLC-MS/MS is performed independently using the same batch of gDNA samples. For HEK-WGA-3M and HEK293-dam, the UHPLC-MS/MS estimates are mimicked: nearly all the expected motif(s) are methylated in vitro by the methyltransferase(s). For each gDNA sample, QV distribution is shown on the top. (B) Sources (%) of CCS reads in the HEK-pCI sample (transfection of an empty pCI plasmid into HEK 293 cells). (C) 6mA quantification (%) of different sources in HEK-pCI ; same legend as in (A). CCS reads from E. coli and Others are grouped together and their CIs are determined based on 8,000 CCS reads. (D) 6mA contribution (%) from the subgroups in the HEK-pCI sample.

Comment in

  • When viruses become more virulent.
    Wertheim JO. Wertheim JO. Science. 2022 Feb 4;375(6580):493-494. doi: 10.1126/science.abn4887. Epub 2022 Feb 3. Science. 2022. PMID: 35113688
  • The adenine methylation debate.
    Boulias K, Greer EL. Boulias K, et al. Science. 2022 Feb 4;375(6580):494-495. doi: 10.1126/science.abn6514. Epub 2022 Feb 3. Science. 2022. PMID: 35113697 Free PMC article.
  • SCOPE-ing out eukaryotic 6mA.
    Clyde D. Clyde D. Nat Rev Genet. 2022 Apr;23(4):197. doi: 10.1038/s41576-022-00460-1. Nat Rev Genet. 2022. PMID: 35190647 No abstract available.
  • Reassessing 6mA in eukaryotes.
    Tang L. Tang L. Nat Methods. 2022 Mar;19(3):270. doi: 10.1038/s41592-022-01434-1. Nat Methods. 2022. PMID: 35277704 No abstract available.

References

    1. Sánchez-Romero MA, Casadesús J, The bacterial epigenome. Nat. Rev. Microbiol 18, 7–20 (2020). - PubMed
    1. Fang G, Munera D, Friedman DI, Mandlik A, Chao MC, Banerjee O, Feng Z, Losic B, Mahajan MC, Jabado OJ, Deikus G, Clark TA, Luong K, Murray IA, Davis BM, Keren-Paz A, Chess A, Roberts RJ, Korlach J, Turner SW, Kumar V, Waldor MK, Schadt EE, Genome-wide mapping of methylated adenine residues in pathogenic Escherichia coli using single-molecule real-time sequencing. Nat Biotechnol. 30, 1232–1239 (2012). - PMC - PubMed
    1. Beaulaurier J, Schadt EE, Fang G, Deciphering bacterial epigenomes using modern sequencing technologies. Nat. Rev. Genet 20, 157–172 (2019). - PMC - PubMed
    1. Fu Y, Luo GZ, Chen K, Deng X, Yu M, Han D, Hao Z, Liu J, Lu X, Dore LC, Weng X, Ji Q, Mets L, He C, N6-methyldeoxyadenosine marks active transcription start sites in Chlamydomonas. Cell. 161, 879–892 (2015). - PMC - PubMed
    1. Wang Y, Chen X, Sheng Y, Liu Y, Gao S, N6-adenine DNA methylation is associated with the linker DNA of H2A.Z-containing well-positioned nucleosomes in Pol II-transcribed genes in Tetrahymena. Nucleic Acids Res. 45 (2017), doi: 10.1093/nar/gkx883. - DOI - PMC - PubMed

Publication types

MeSH terms