. 2022 Mar 15;132(6):e142137.
doi: 10.1172/JCI142137.

Arginine deprivation alters microglial polarity and synergizes with radiation to eradicate non-arginine-auxotrophic glioblastoma tumors

Affiliations

Arginine deprivation alters microglial polarity and synergizes with radiation to eradicate non-arginine-auxotrophic glioblastoma tumors

Nabil Hajji et al. J Clin Invest. .

Abstract

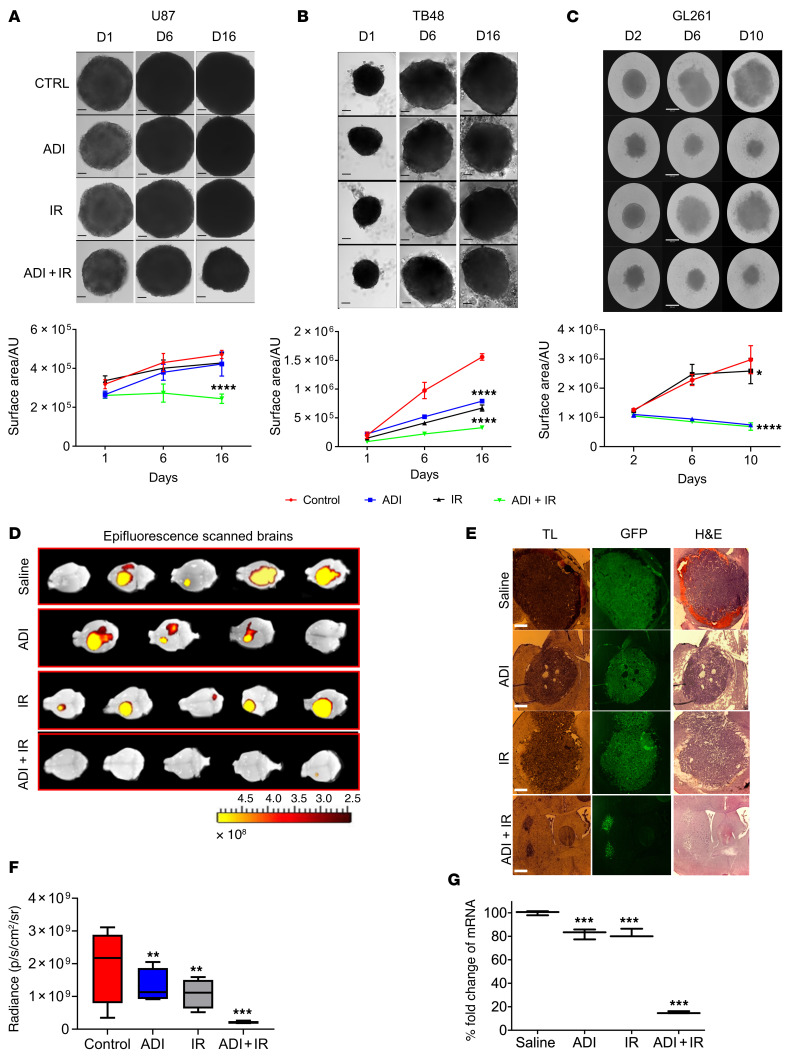
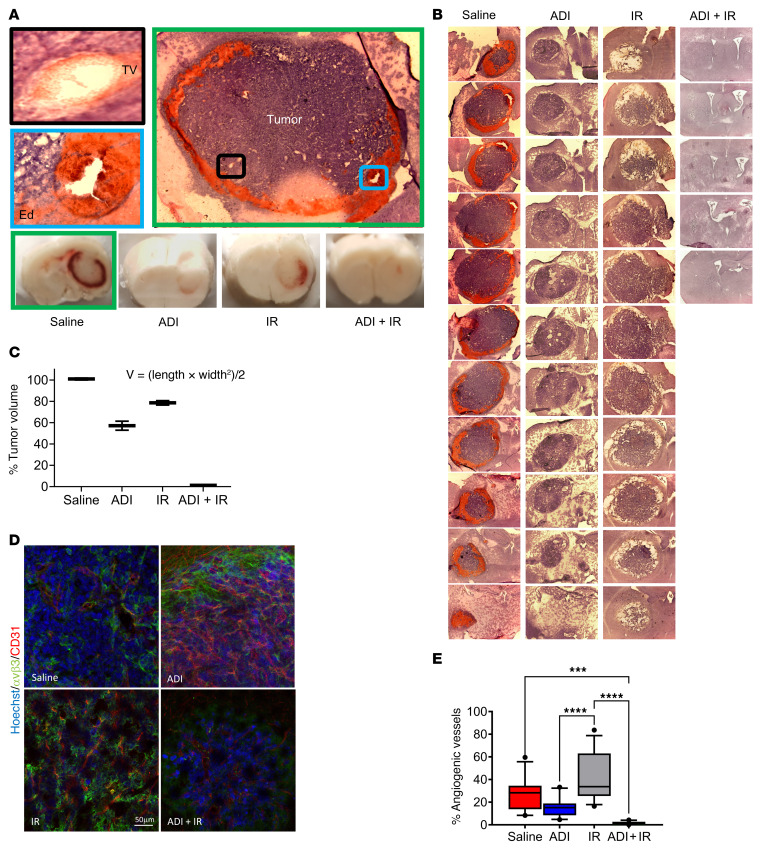
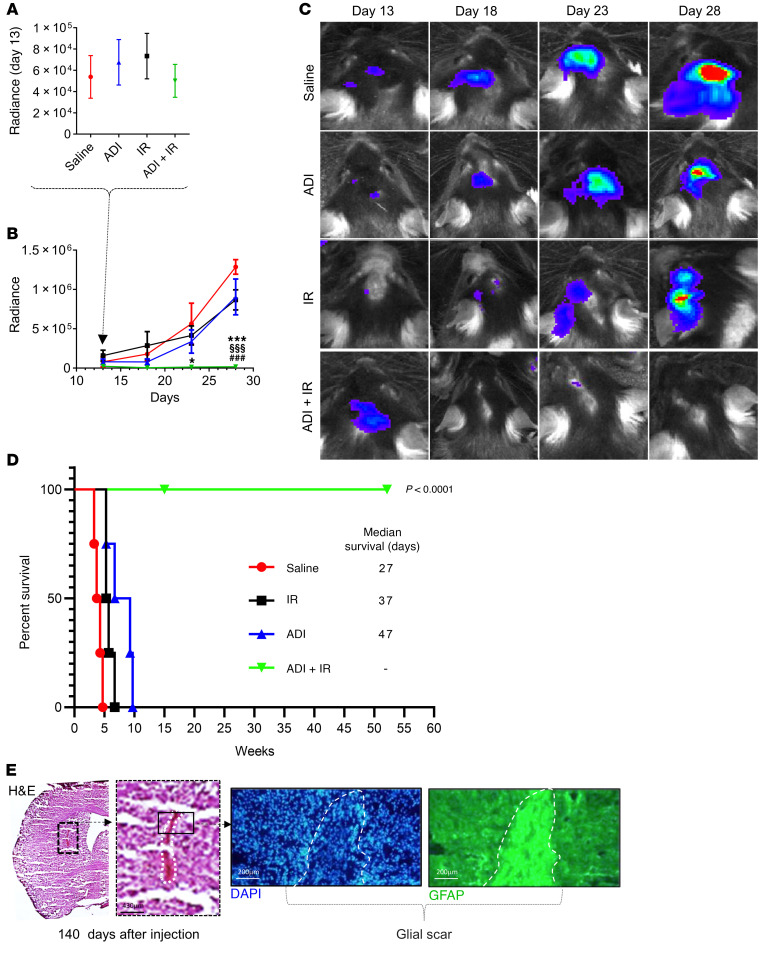
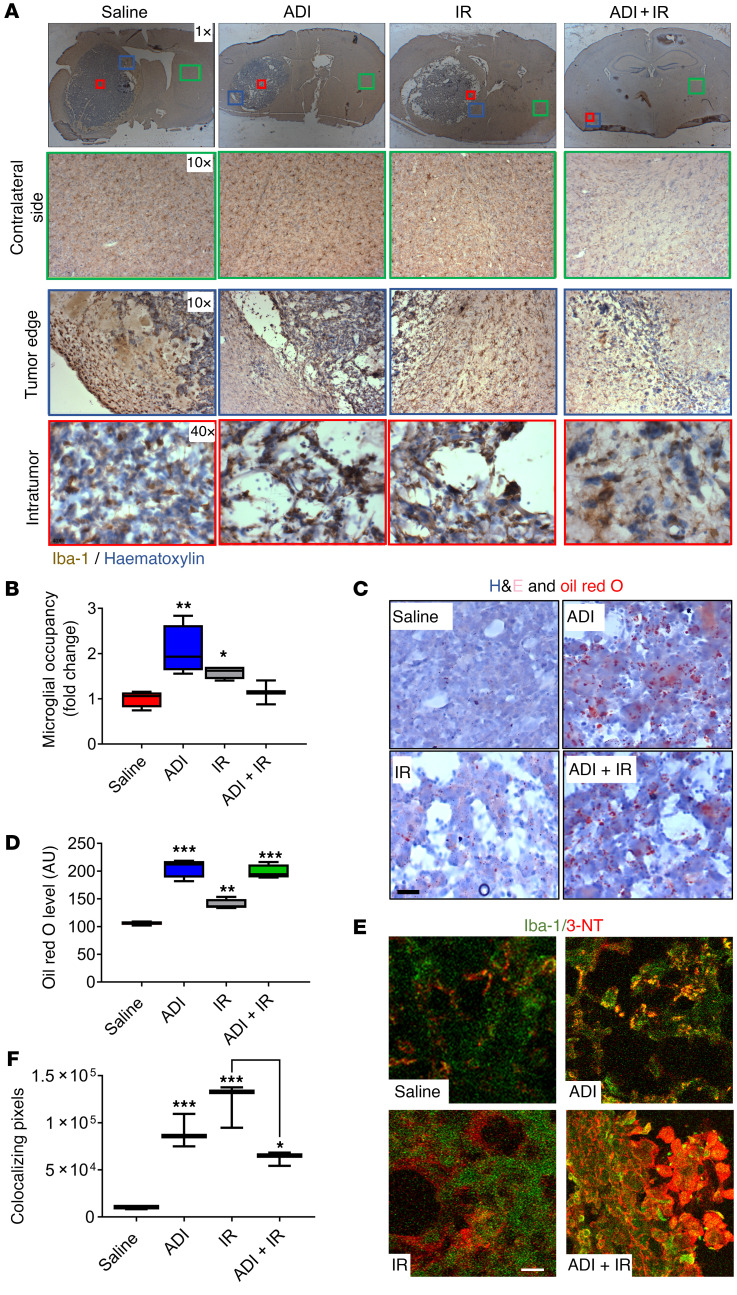
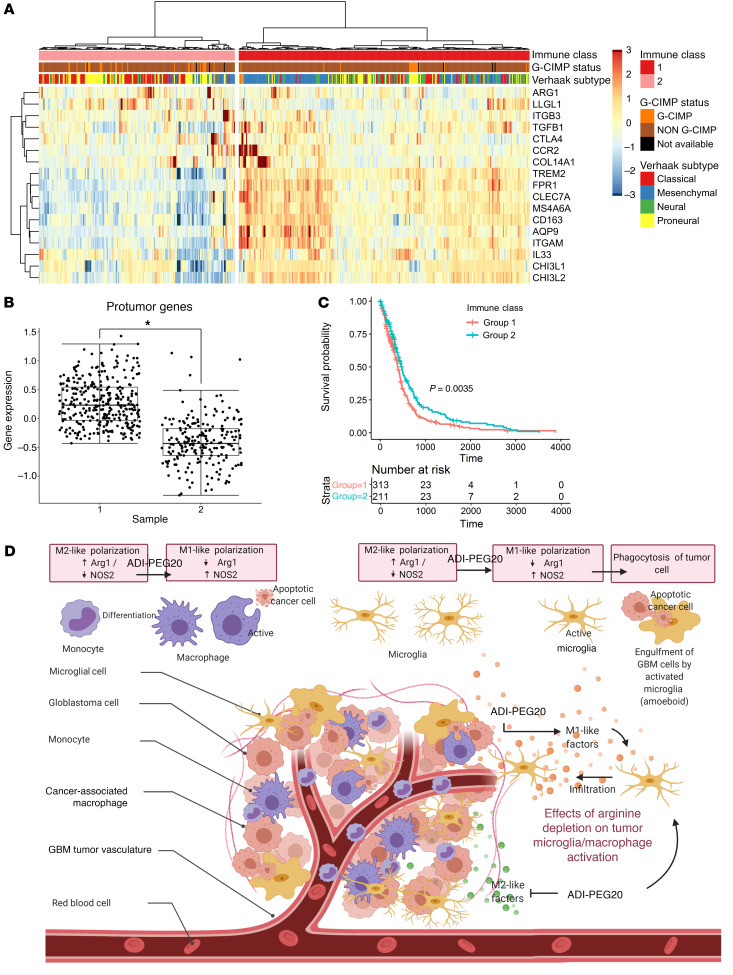
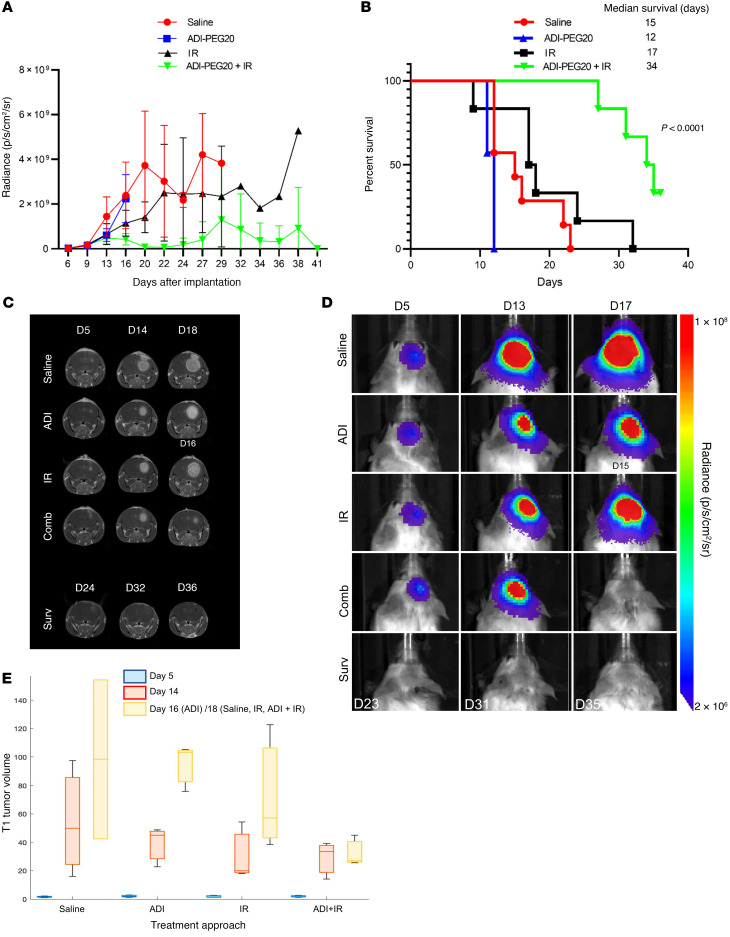
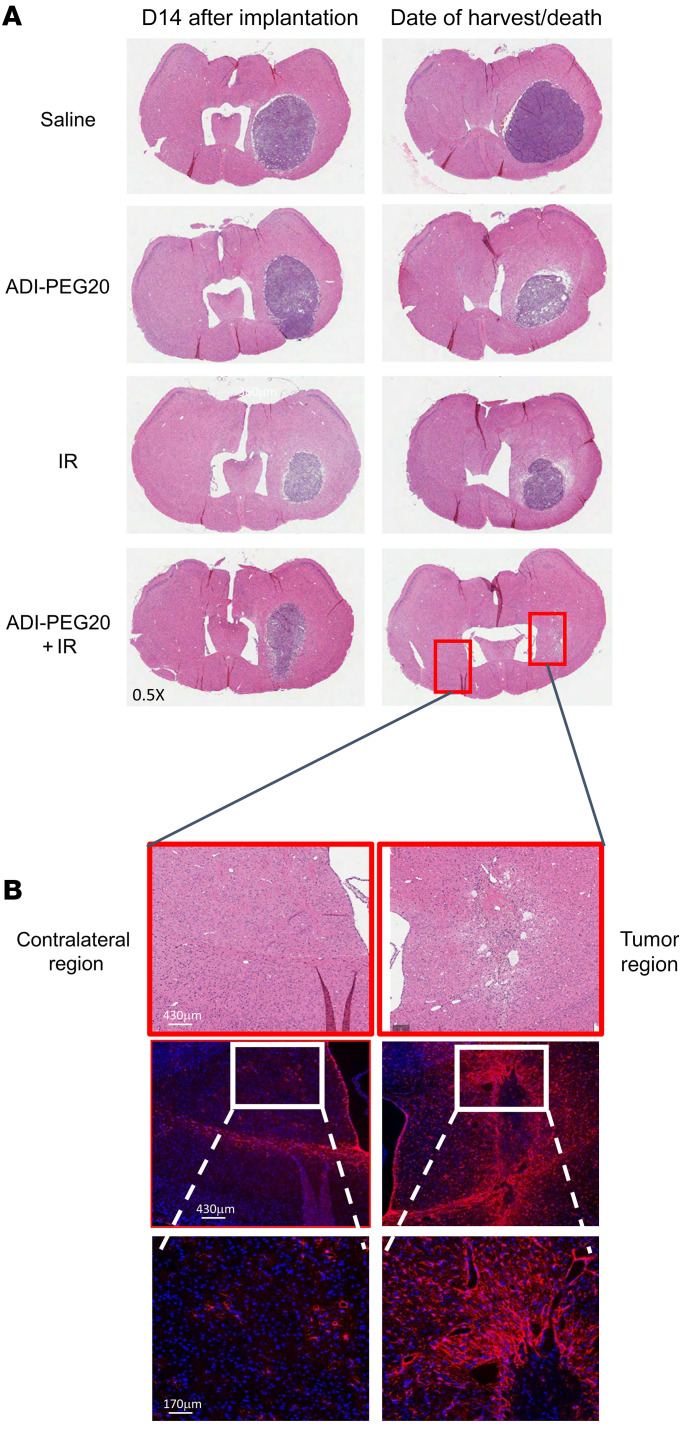
New approaches for the management of glioblastoma (GBM) are an urgent and unmet clinical need. Here, we illustrate that the efficacy of radiotherapy for GBM is strikingly potentiated by concomitant therapy with the arginine-depleting agent ADI-PEG20 in a non-arginine-auxotrophic cellular background (argininosuccinate synthetase 1 positive). Moreover, this combination led to durable and complete radiological and pathological response, with extended disease-free survival in an orthotopic immune-competent model of GBM, with no significant toxicity. ADI-PEG20 not only enhanced the cellular sensitivity of argininosuccinate synthetase 1-positive GBM to ionizing radiation by elevated production of nitric oxide (˙NO) and hence generation of cytotoxic peroxynitrites, but also promoted glioma-associated macrophage/microglial infiltration into tumors and turned their classical antiinflammatory (protumor) phenotype into a proinflammatory (antitumor) phenotype. Our results provide an effective, well-tolerated, and simple strategy to improve GBM treatment that merits consideration for early evaluation in clinical trials.

Keywords: Amino acid metabolism; Brain cancer; Nitric oxide; Oncology; Therapeutics.


Conflict of interest statement

Conflict of interest: The authors have declared that no conflict of interest exists.

Figures

Figure 1
Figure 1. ADI-PEG20 in combination with radiation significantly reduces the growth of ASS1-positive GBM neurospheres and inhibits tumor growth in syngeneic mice.
Five thousand cells were plated in low-attachment 96-well plates and incubated for 3 to 8 days to allow formation of neurospheres. Neurospheres were pretreated with ADI-PEG20 (1 μg/mL for human lines and 0.25 μg/mL for mouse line, GL261) for 24 hours before exposure to 2 Gy of ionizing radiation (IR). (AC) Images were taken on indicated days after IR treatment and changes in neurosphere surface area measured using ImageJ software (upper and lower panels). (D) Epifluorescence (GFP intensity) was measured in whole brains using in vivo image analysis (IVIS). (E) Microscopic analysis of representative brain sections: transmitted light (TL), GFP, and H&E staining. Scale bars: 360 μm (AC) and 430 μm (E). (F) Tumor size is represented as total radiant efficiency. (G) qPCR expression levels of GFP in tumor sections. The neurosphere results are presented as mean ± SD, n = 12. The in vivo results were obtained from 5 animals per group except for animals treated with ADI-PEG20 monotherapy, which only had 4 animals due to the premature death of 1 mouse. Data were analyzed using 1-way ANOVA (AC and F) or 2-way ANOVA with Tukey’s multiple comparison test with adjusted P values reported (G). *P < 0.05, **P < 0.01, ***P < 0.001, ****P < 0.0001. AU, arbitrary units.
Figure 2
Figure 2. ADI-PEG20 induces significant reduction in ASS1-positive tumor edema and angiogenic vessels and in combination with ionizing radiation drastically reduces GL261-GFP tumor growth.
(A) H&E-stained fresh-frozen brain sections from saline-treated animals (green box) and cryoblocks from all treatment groups. Vasogenic edema (blue box) (Ed) and intratumor vasculature (black box) (TV) in saline control animals (green box). (B) Representative brains from each treatment group were cryosectioned and stained with H&E. (C) The percentage tumor volume was measured using the formula V = (L × W2)/2, where L represents the largest tumor diameter and W represents the perpendicular tumor diameter. (D) Immunohistochemical analysis of free-floating sections for tumor vasculature using anti-CD31 and –αvβ3 integrin antibodies. Scale bar: 50 μm. (E) Percentage of angiogenic vessels in tumor sections as assessed by colocalization of CD31 and αvβ3 staining. Results are representative of 3 animals per group. Note in the combined treatment group only 1 animal had evidence of tumor. ***P < 0.001; ****P < 0.0001. Data were analyzed using 1-way ANOVA.
Figure 3
Figure 3. Eradication of GBM intracranial tumors, glial scar formation, and enhanced survival of mice induced by ADI-PEG20 in combination with ionizing radiation.
(AC) Bioluminescence imaging (BLI) of intracranial tumors in mice using an IVIS Lumina II and Living Image software starting from day 13 after injection of GL261-Luc2 tumor cells. (D) Kaplan-Meier survival graph. Median survival times were 27, 47, and 37 days for saline, ADI-PEG20, and ionizing radiation (IR) monotherapy, respectively. Animals treated with combined treatment remained healthy and tumor free beyond 1 year. These animals received IR for 8 weeks and ADI-PEG20 for 13 weeks, after which time treatments were stopped. (E) Two animals from this group were culled on day 140 and brain sections were stained with H&E and for GFAP, showing evidence of histologically apparent glial scarring at the tumor site. Scale bars: 430 μm (left); 200 μm (middle, right). Data were analyzed using 2-way ANOVA with Tukey’s multiple comparison test, and adjusted P values are reported. ***P < 0.001 (saline vs. ADI-PEG20) + IR; §§§P < 0.001 (ADI-PEG20 vs. ADI-PEG20 + IR); ###P < 0.001 (IR vs. ADI-PEG20 + IR).
Figure 4
Figure 4. Arginine deprivation increases recruitment of microglia into tumors and enhances their activity and phagocytic phenotype.
(A) Immunohistochemical evaluation of microglial/macrophage infiltration using Iba-1 staining on the contralateral nontumor side (green box), tumor edge (blue box), and intratumor (red box). (B) Intratumoral microglia occupancy. (C and D) Characterization of microglial phagocytic capacity using H&E and Oil red O staining of tumor sections and quantification of lipid bodies. (E and F) Assessment of the level of ˙NO production by microglia by 3-nitrotyrosine (3-NT) and Iba-1 staining of tumor sections. Iba-1 (green), 3-NT (red), colocalization of Iba-1 and 3-NT (yellow). Results were obtained from 5 animals per group. Note in the combined treatment group, analysis was carried out on the single animal showing evidence of tumor. Scale bars: 50 μm. Data were analyzed using 1-way ANOVA. *P < 0.05, **P < 0.01, ***P < 0.001.
Figure 5
Figure 5. ADI-PEG20 combined with ionizing radiation in vivo significantly increases γ-H2AX in GBM tumors.
(AC) Immunohistochemical assessment of microglial recruitment and γ-H2AX intensity levels in the contralateral (nontumor) and tumor side of the brains using free-floating tissue sections and quantification of results. γ-H2AX intensity levels were quantified using a Zeiss confocal microscope (Observer Z1) and ZEN 2 (blue edition) software. Iba-1 = yellow, tumor (GFP) = green. Results are representative of 3 animals per group, except for the tumor in the combined treatment animal since only 1 animal had evaluable tumor. Scale bars: 200 μm. Data were analyzed using 1-way ANOVA. **P < 0.01, ***P < 0.001.
Figure 6
Figure 6. Arginine availability modulates microglial polarization.
(A) Schematic representation of hypothesized microglial activation and polarization by arginine availability. (BE) qPCR analysis of Arg1, iNOS, Ym1, and Tnfa expression levels in tumor tissue. (FI) Immunohistochemical assessment and quantification of microglial Arg1 and iNOS levels by Iba-1/Arg1 and Iba-1/iNOS costaining of free-floating sections. Scale bars: 100 μm. Data were analyzed using 1-way ANOVA. *P < 0.05, **P < 0.01, ***P < 0.001, ****P < 0.0001. NS, not significant.
Figure 7
Figure 7. Arginine deprivation reverts the immune-suppressive microenvironment.
(AC) Immunohistochemical assessment and quantification of CD4+, CD8+, and FOXP3+ T cells. Tissue sections were stained using an Aperio AT2 slide scanner and analyzed using QuPath (v1.2.2) based on 5 randomly selected regions. Scale bar: 20 μm. Data were analyzed using a nonparametric Mann-Whitney U test. *P < 0.05, ***P < 0.001, ****P < 0.0001.
Figure 8
Figure 8. Hierarchical clustering shows that the expression of protumor microglial genes is associated with GBM subtypes.
(A) Heatmap and dendrogram showing the expression of protumor microglial genes with tumor molecular phenotypes. (B) Box-and-whisker plot showing expression of protumor microglial genes in the 2 clusters. (C) Kaplan-Meier plot showing patient survival between the 2 clusters. (D) Schematic summary of the effect of arginine depletion on tumor microglial/macrophage activation.
Figure 9
Figure 9. ADI-PEG20 combined with ionizing radiation eradicates CT-2A orthotopic GBM tumors.
(A) Bioluminescence imaging (BLI) of intracranial tumors in mice using an IVIS Spectrum in vivo imaging system and Living Image software starting from day 5 after injection of CT-2A tumor cells. (B) Kaplan-Meier survival graph. Animals administered combined treatment remained healthy and tumor free at time of harvest. Three mice in each treatment group were additionally analyzed by MRI at early (5 days), mid (14 days), and late (16 days for ADI animals and 18 days for other groups) time points after intracranial injection of cells, and additional images were obtained for animals in the combination group. ADI animals were imaged earlier because they showed signs of distress. (C and D) Representative MR and BL images of mice in each group. (E) Box-and-whisker plot of the calculated T1 tumor volumes at early, mid, and late MRI time points.
Figure 10
Figure 10. Immunological assessment of CT-2A tumors in mice treated with ADI-PEG20 combined with ionizing radiation.
(A) Representative H&E images of mouse brains at the mid time point and at time of death/harvest. (B) Representative GFAP staining of brains in combined treatment group showing contralateral and tumor region at late harvest time point. Time points: Early, 5 days after implantation and before treatment; Mid, 14 days after implantation and after 1 round of treatment; Late, 16 (ADI animals) and 18 days (all other groups) after implantation and after 2 rounds of treatment. DAPI was used as a nuclear counter stain (blue). Scale bars in E: 430 μm (top, middle); 170 μm (bottom).

References

    1. Stupp R, et al. Radiotherapy plus concomitant and adjuvant temozolomide for glioblastoma. N Engl J Med. 2005;352(10):987–996. doi: 10.1056/NEJMoa043330. - DOI - PubMed
    1. Stupp R, et al. Effects of radiotherapy with concomitant and adjuvant temozolomide versus radiotherapy alone on survival in glioblastoma in a randomised phase III study: 5-year analysis of the EORTC-NCIC trial. Lancet Oncol. 2009;10(5):459–466. doi: 10.1016/S1470-2045(09)70025-7. - DOI - PubMed
    1. Weller M, et al. How we treat glioblastoma. ESMO Open. 2019;4(suppl 2):e000520. - PMC - PubMed
    1. Lukas RV, et al. Newly diagnosed glioblastoma: a review on clinical management. Oncology (Williston Park) 2019;33(3):91–100. - PMC - PubMed
    1. Schiffer D, et al. A comprehensive view of tumor stem cells and their regulation by the microenvironment in glioblastoma. Neurol Sci. 2017;38(3):527–529. doi: 10.1007/s10072-016-2768-6. - DOI - PubMed

Publication types