Meta-Analysis
. 2022 Feb 3;20(2):e3001511.
doi: 10.1371/journal.pbio.3001511. eCollection 2022 Feb.

Meta-analysis reveals an extreme "decline effect" in the impacts of ocean acidification on fish behavior

Affiliations
Meta-Analysis

Meta-analysis reveals an extreme "decline effect" in the impacts of ocean acidification on fish behavior

Jeff C Clements et al. PLoS Biol. .

Abstract

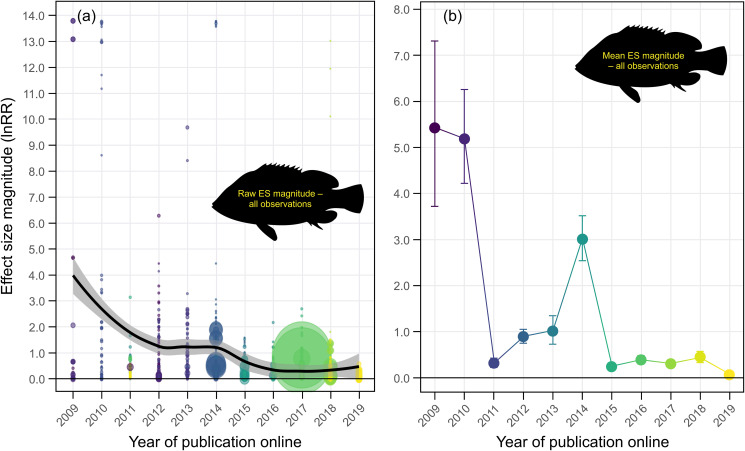
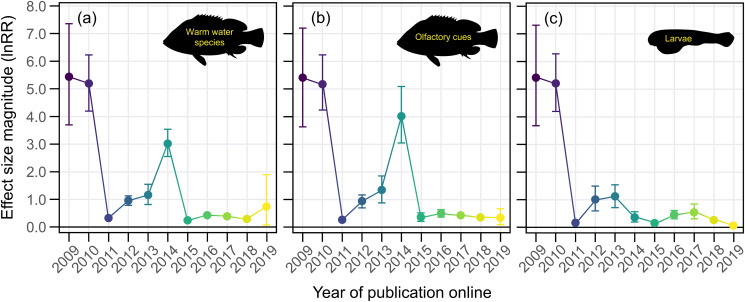
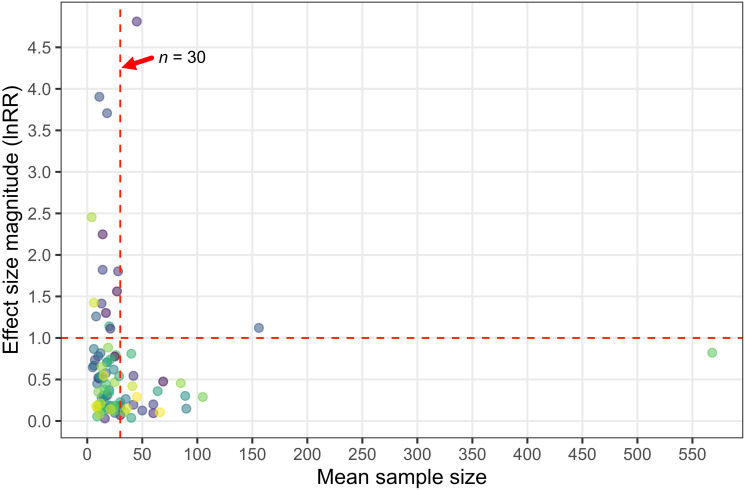
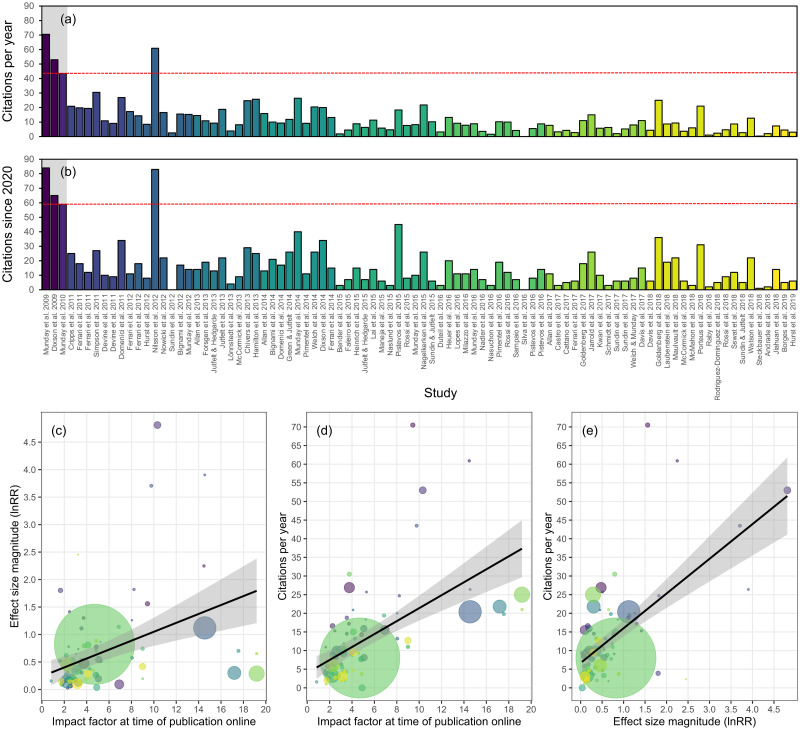
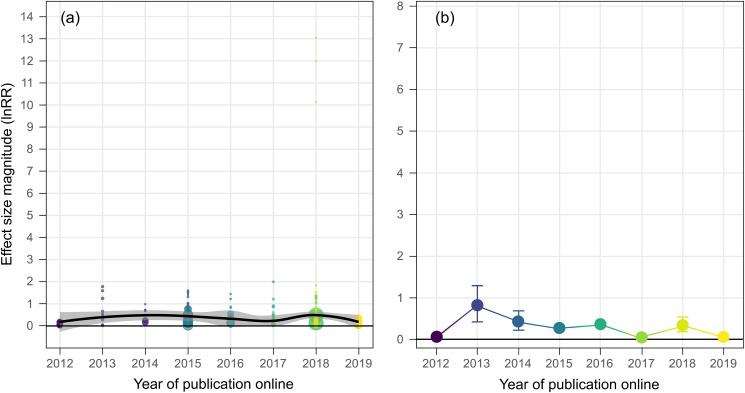
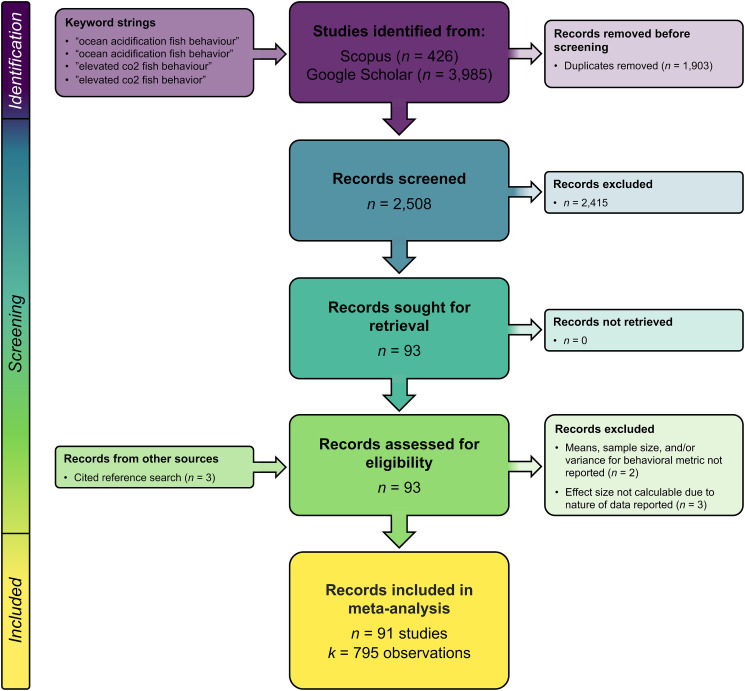
Ocean acidification-decreasing oceanic pH resulting from the uptake of excess atmospheric CO2-has the potential to affect marine life in the future. Among the possible consequences, a series of studies on coral reef fish suggested that the direct effects of acidification on fish behavior may be extreme and have broad ecological ramifications. Recent studies documenting a lack of effect of experimental ocean acidification on fish behavior, however, call this prediction into question. Indeed, the phenomenon of decreasing effect sizes over time is not uncommon and is typically referred to as the "decline effect." Here, we explore the consistency and robustness of scientific evidence over the past decade regarding direct effects of ocean acidification on fish behavior. Using a systematic review and meta-analysis of 91 studies empirically testing effects of ocean acidification on fish behavior, we provide quantitative evidence that the research to date on this topic is characterized by a decline effect, where large effects in initial studies have all but disappeared in subsequent studies over a decade. The decline effect in this field cannot be explained by 3 likely biological explanations, including increasing proportions of studies examining (1) cold-water species; (2) nonolfactory-associated behaviors; and (3) nonlarval life stages. Furthermore, the vast majority of studies with large effect sizes in this field tend to be characterized by low sample sizes, yet are published in high-impact journals and have a disproportionate influence on the field in terms of citations. We contend that ocean acidification has a negligible direct impact on fish behavior, and we advocate for improved approaches to minimize the potential for a decline effect in future avenues of research.


Conflict of interest statement

Three of the authors (J. Sundin, T. Clark, and F. Jutfelt) have previously raised concerns about, and have requested formal investigations into, the scientific integrity of some studies published by Drs. Philip Munday and Danielle Dixson.

Figures

Fig 1
Fig 1. The decline effect in ocean acidification research on fish behavior.
(a) Trend in raw effect size magnitudes (absolute lnRR) for each experiment in our dataset plotted as a function of year of publication online and color coded according to study. Data are fit with a Loess curve with 95% confidence bounds. (b) Mean effect size magnitude (absolute lnRR ± upper and lower confidence bounds) for each year of publication (online) in our dataset. Mean effect size magnitudes and confidence bounds were estimated using Bayesian simulations and a folded normal distribution. Note: Colors for (b) are aesthetic in nature and follow a gradient according to year of publication. Source data for each figure panel can be found in S1 Data. ES, effect size.
Fig 2
Fig 2. The decline effect cannot be explained by 3 commonly considered biological drivers of acidification effects.
Mean effect size magnitude (absolute lnRR ± upper and lower confidence bounds) as a function of time for datasets that only included experiments with (a) warm-water species, (b) olfactory-associated behaviors, and (c) larval life stages. Mean effect size magnitudes and confidence bounds were estimated using Bayesian simulations and a folded normal distribution. Note: Colors are aesthetic in nature and follow a gradient according to year of publication online. Source data for each figure panel can be found in S1 Data.
Fig 3
Fig 3. Studies with large effect sizes tend to have low samples sizes.
Mean effect size magnitude (absolute lnRR) for each study as a function of the mean sample size of that study (i.e., sample size per experimental treatment). Note that mean effect size for a given study is not a weighted effect size magnitude, but is simply computed as the mean of individual effect size magnitudes for a given study. The vertical red dashed line denotes a sample size of 30 fish, while the horizontal red dashed line represents a lnRR magnitude of 1. Source data for each figure panel can be found in S1 Data.
Fig 4
Fig 4. Strong effects are published in high-impact journals, and these studies are cited more than small effect studies in lower-impact journals.
(a, b) Google Scholar citation metrics as of September 10, 2021 for each of the studies included in our meta-analysis, including average citations per year (a) and total citations since 2020 (b). The initial 3 studies spearheading this field are denoted by the gray background, and the red dashed line represents the lowest citation metric among those 3 studies. Studies are ordered chronologically along the x-axis and color coded by year published online. (c) Mean effect size magnitude for each individual study as a function of journal impact factor (at time of online publication). (d) The number of citations per year for each study as a function of journal impact factor (at time of online publication). (e) The number of citations per year for each study as a function of mean effect size magnitude for that study. Note that, for panels (c) and (e), mean effect size magnitude for a given study is not a weighted effect size magnitude, but is simply computed as the mean of individual effect size magnitudes for a given study. Data are fit with linear curves and 95% confidence bounds, and points are color coded by study; the size of data points represents the relative mean sample size of the study. Source data for each figure panel can be found in S1 Data.
Fig 5
Fig 5. The decline effect in ocean acidification research on fish behavior excluding studies authored (or coauthored) by lead investigators of initial studies.
(a) Trend in raw effect size magnitudes (absolute lnRR) for each experiment in our dataset excluding all studies authored (or coauthored) by lead investigators of the 3 initial studies [–10] plotted as a function of year of publication online and color coded according to study. Data are fit with a Loess curve with 95% confidence bounds. (b) Mean effect size magnitude (absolute lnRR ± upper and lower confidence bounds) for each year of publication online in our dataset excluding all studies authored (or coauthored) by lead investigators of the 3 initial studies. Mean effect size magnitudes and confidence bounds were estimated using Bayesian simulations and a folded normal distribution. Note: Colors in (b) are aesthetic in nature and follow a gradient according to year of publication. Also note that data begin in 2012 since all publications prior to 2012 included initial lead investigators in the author list. Vertical axes are scaled to enable direct comparison with Fig 1. Source data for each figure panel can be found in S1 Data.
Fig 6
Fig 6. PRISMA flow diagram.
Values represent the numbers of records found and retained at each stage of the literature search. Papers were considered “relevant” if they included an empirical test of ocean acidification on the behavior of a marine fish. Off-topic papers and topical review papers were excluded, as were topical papers on freshwater species and invertebrates. Relevant studies were deemed “ineligible” if they did not contain data from which effect sizes could be calculated (this included data that did not have an associated sample size or variance or relevant papers that did not report the behavioral data). Details of relevance and exclusion can be found in S4 Data. PRISMA, Preferred Reporting Items for Systematic Reviews and Meta-Analyses.

Comment in

References

    1. Schooler J. Unpublished results hide the decline effect. Nature. 2011;470:437–7. doi: 10.1038/470437a - DOI - PubMed
    1. Jennions MD, Møller AP. Relationships fade with time: A meta-analysis of temporal trends in publication in ecology and evolution. Proc R Soc B. 2002;269:43–8. doi: 10.1098/rspb.2001.1832 - DOI - PMC - PubMed
    1. Sánchez-Tójar A, Nakagawa S, Sánchez-Fortún M, Martin DA, Ramani S, Girndt A, et al.. Meta-analysis challenges a textbook example of status signalling and demonstrates publication bias. Elife. 2018;7:e37385. doi: 10.7554/eLife.37385 - DOI - PMC - PubMed
    1. Koricheva J, Kulinskaya E. Temporal instability of evidence base: A threat to policy making? Trends Ecol Evol. 2019;34:895–902. doi: 10.1016/j.tree.2019.05.006 - DOI - PubMed
    1. Kroeker KJ, Kordas RL, Crim RN, Singh GG. Meta-analysis reveals negative yet variable effects of ocean acidification on marine organisms. Ecol Lett. 2010;13:1419–34. doi: 10.1111/j.1461-0248.2010.01518.x - DOI - PubMed

Publication types