. 2022 Feb 3;17(2):e0263069.
doi: 10.1371/journal.pone.0263069. eCollection 2022.

Pre-infection 25-hydroxyvitamin D3 levels and association with severity of COVID-19 illness

Affiliations

Pre-infection 25-hydroxyvitamin D3 levels and association with severity of COVID-19 illness

Amiel A Dror et al. PLoS One. .

Retraction in

Abstract

Objective: Studies have demonstrated a potential correlation between low vitamin D status and both an increased risk of infection with SARS-CoV-2 and poorer clinical outcomes. This retrospective study examines if, and to what degree, a relationship exists between pre-infection serum 25-hydroxyvitamin D (25(OH)D) level and disease severity and mortality due to SARS-CoV-2.

Participants: The records of individuals admitted between April 7th, 2020 and February 4th, 2021 to the Galilee Medical Center (GMC) in Nahariya, Israel, with positive polymerase chain reaction (PCR) tests for SARS-CoV-2 (COVID-19) were searched for historical 25(OH)D levels measured 14 to 730 days prior to the positive PCR test.

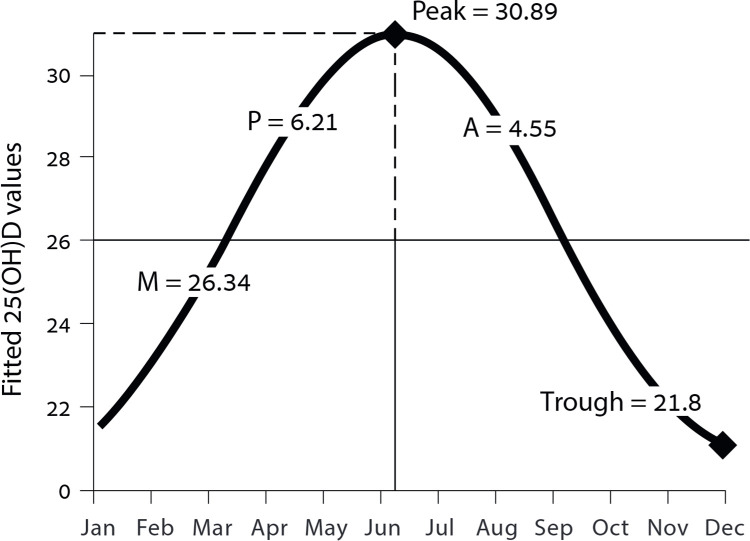
Design: Patients admitted to GMC with COVID-19 were categorized according to disease severity and level of 25(OH)D. An association between pre-infection 25(OH)D levels, divided between four categories (deficient, insufficient, adequate, and high-normal), and COVID-19 severity was ascertained utilizing a multivariable regression analysis. To isolate the possible influence of the sinusoidal pattern of seasonal 25(OH)D changes throughout the year, a cosinor model was used.

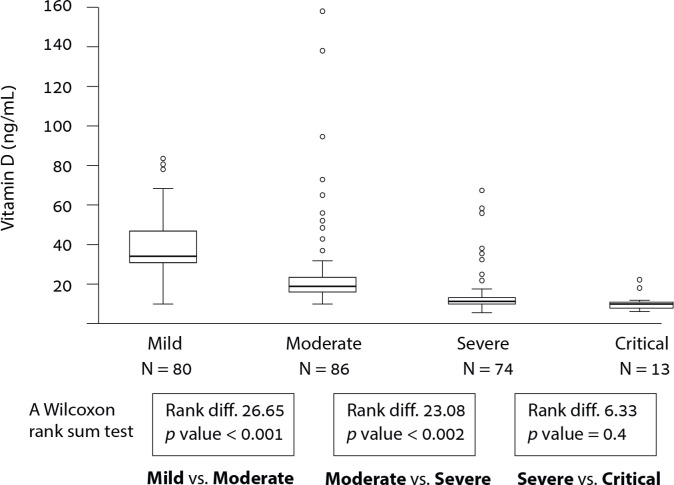
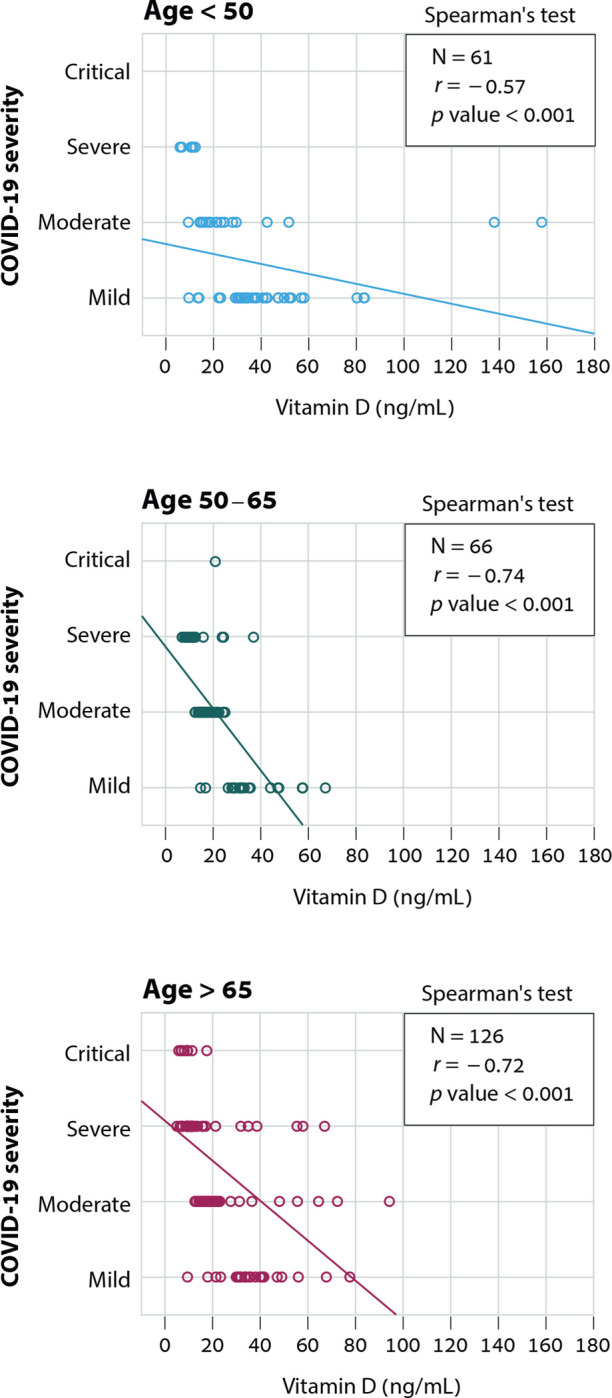
Results: Of 1176 patients admitted, 253 had records of a 25(OH)D level prior to COVID-19 infection. A lower vitamin D status was more common in patients with the severe or critical disease (<20 ng/mL [87.4%]) than in individuals with mild or moderate disease (<20 ng/mL [34.3%] p < 0.001). Patients with vitamin D deficiency (<20 ng/mL) were 14 times more likely to have severe or critical disease than patients with 25(OH)D ≥40 ng/mL (odds ratio [OR], 14; 95% confidence interval [CI], 4 to 51; p < 0.001).

Conclusions: Among hospitalized COVID-19 patients, pre-infection deficiency of vitamin D was associated with increased disease severity and mortality.


Conflict of interest statement

The authors have declared that no competing interests exist.

Figures

Fig 1
Fig 1. The cosinor 25(OH)D model for all months.
The predicted 25(OH)D mean value of each month through the annum can be extracted from the graph. This figure demonstrates the predicted peak of 25(OH)D concentration in June and the expected trough in December. The predicted 25(OH)D mean value of each month can be utilized to predict the 25(OH)D for the hospitalization month of any given patient (Eq 3). M = mesor, A = amplitude, P = Phase.
Fig 2
Fig 2. Box-and-whisker plots of the most recent pre-infection serum 25(OH)D levels before hospitalization were collected as a baseline (N = 253).
The mean vitamin level was compared between the four categories of COVID-19 disease severity as determined by the WHO definition (WHO/2019-nCoV/clinical/2020.5). A Kruskal-Wallis test for multiple-category comparison shows a significant difference between groups p < 0.001. A Mann-Whitney test compared vitamin D mean rank of two neighboring categories sequentially; mild compared with moderate (mean difference, 12.96 ng/mL; [Rank difference 26.65] p < 0.001); moderate compared with severe (mean difference, 10.72 ng/mL [Rank difference 23.08]; p < 0.002); Severe compared with Critical (mean difference, 3.96 ng/mL [Rank difference 6.33]; p = 0.40). The boxes present the range of vitamin D values within the interquartile range (50% of the cases). The whiskers outside the box mark the most upper and lower values within 1.5 times the interquartile range. Outliers’ values in each group are represented with empty circles.
Fig 3
Fig 3. Correlation between pre-infection vitamin D deficiency status and COVID-19 disease severity stratified by three different groups of age (<50, 50–64, ≥65).
The severity of illness (critical, severe, moderate, and mild, as determined by the WHO definition of COVID-19 disease severity (WHO/2019-nCoV/clinical/2020.5)). The regression fit for each age group is shown. Values that are more than two SD away from the regression fit to the rest of the data were omitted from the analysis (applicable for two values appear on <50 yr graph that omitted from regression fit calculation).

References

    1. Charoenngam N, Holick MF. Immunologic effects of vitamin d on human health and disease. Nutrients. MDPI AG; 2020. pp. 1–28. doi: 10.3390/nu12072097 - DOI - PMC - PubMed
    1. Prietl B, Treiber G, Pieber TR, Amrein K. Vitamin D and immune function. Nutrients. 2013. pp. 2502–2521. doi: 10.3390/nu5072502 - DOI - PMC - PubMed
    1. Chakhtoura M, Rahme M, Chamoun N, El-Hajj Fuleihan G. Vitamin D in the Middle East and North Africa. Bone reports. 2018;8: 135–146. doi: 10.1016/j.bonr.2018.03.004 - DOI - PMC - PubMed
    1. Batieha A, Khader Y, Jaddou H, Hyassat D, Batieha Z, Khateeb M, et al. Vitamin D status in Jordan: dress style and gender discrepancies. Annals of nutrition & metabolism. 2011;58: 10–18. doi: 10.1159/000323097 - DOI - PubMed
    1. Bergman P, Lindh ÅU, Björkhem-Bergman L, Lindh JD. Vitamin D and Respiratory Tract Infections: A Systematic Review and Meta-Analysis of Randomized Controlled Trials. PLoS ONE. 2013. p. e65835. doi: 10.1371/journal.pone.0065835 - DOI - PMC - PubMed

Publication types

MeSH terms