Observational Study
. 2022 Feb:76:103852.
doi: 10.1016/j.ebiom.2022.103852. Epub 2022 Feb 1.

Primary immune responses are negatively impacted by persistent herpesvirus infections in older people: results from an observational study on healthy subjects and a vaccination trial on subjects aged more than 70 years old

Affiliations
Observational Study

Primary immune responses are negatively impacted by persistent herpesvirus infections in older people: results from an observational study on healthy subjects and a vaccination trial on subjects aged more than 70 years old

Francesco Nicoli et al. EBioMedicine. 2022 Feb.

Abstract

Background: Advanced age is accompanied by a decline of immune functions, which may play a role in increased vulnerability to emerging pathogens and low efficacy of primary vaccinations in elderly people. The capacity to mount immune responses against new antigens is particularly affected in this population. However, its precise determinants are not fully understood. We aimed here at establishing the influence of persistent viral infections on the naive T-cell compartment and primary immune responsiveness in older adults.

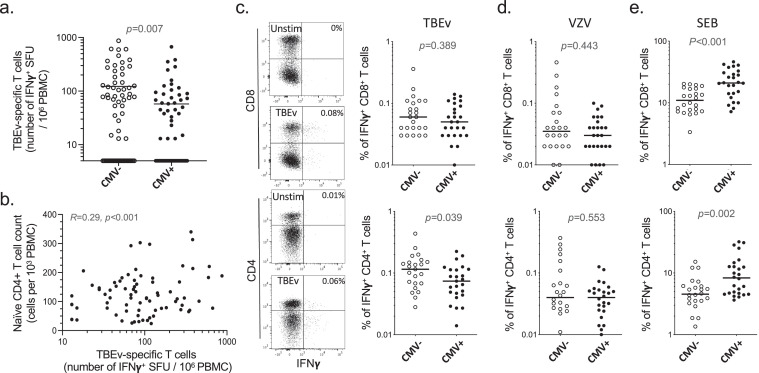
Methods: We assessed immunological parameters, related to CD8+ and CD4+ T-cell responsiveness, according to the serological status for common latent herpesviruses in two independent cohorts: 1) healthy individuals aged 19y to 95y (n = 150) and 2) individuals above 70y old enrolled in a primo-vaccination clinical trial (n = 137).

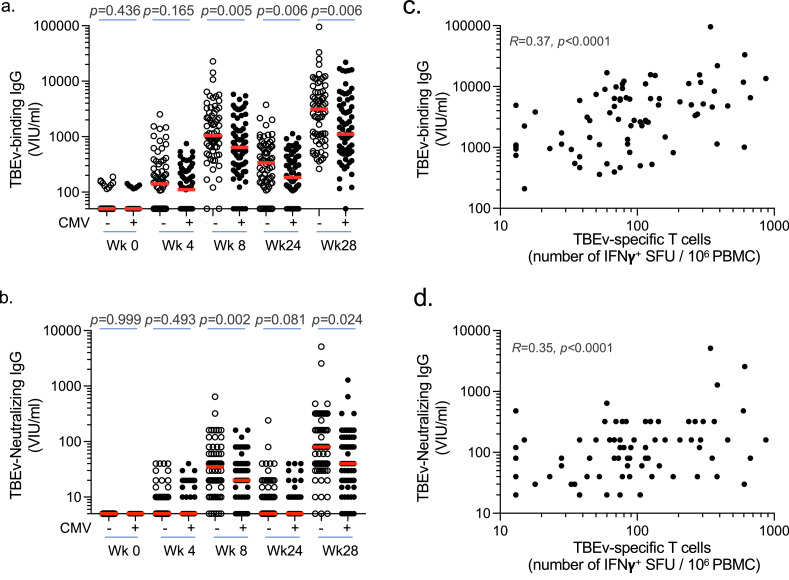
Findings: We demonstrate a prevalent effect of age and CMV infection on CD8+ and CD4+ naive T cells, respectively. CMV seropositivity was associated with blunted CD4+ T-cell and antibody responses to primary vaccination.

Interpretation: These data provide insights on the changes in adaptive immunity over time and the associated decline in vaccine efficacy with ageing. This knowledge is important for the management of emerging infectious diseases in elderly populations.

Funding: This work was supported by the ANR (Project ANR-14-CE14-0030-01) and by Universita ItaloFrancese/Univeriste FrancoItalienne (Galileo Project G10-718; PHC Galilee Project 39582TJ), by the Swiss National Science Foundation (grant PP0033-110737 to UK), by the Heuberg Foundation (Zurich, Switzerland), by the AETAS Foundation (Geneva, Switzerland) and by a Senior IdEx Chair of the University of Bordeaux (France). EC, VB, CA, MA, DD and AT were supported by the French Government's Investissement d'Avenir Program, Laboratoire d'Excellence "Milieu Interieur" Grant ANR-10-LABX-69-01. EC and AT are supported by the Agence Nationale de la Recherche (Project RANKLthym ANR-19- CE18-0021-02).

Keywords: Elderly; Naive T lymphocytes; T-cell responses; Thymus; Vaccines.


Conflict of interest statement

Declaration of interests Dr Wanke reports having received personal fees as medical advisor from Novartis Pharma Schweiz AG, outside of the submitted work. Dr Stiasny reports having received a research grant from Pfizer corporation Austria Ges.m.b.H for the period 2018-2020, outside the submitted work. The other authors declare no conflict of interest.

Figures

Fig 1
Figure 1
Impact of age and herpesvirus infections on inflammation levels. Correlation between inflammatory cytokine levels and age according to the number of infections with herpesviruses (n = 14, 33, 43 and 59 for 0, 1, 2, and 3+ infections). Statistical significance was determined by Spearman's rank correlation. Spearman's R and p values are shown for each panel.
Fig 2
Figure 2
Impact of age and herpesvirus infections on effector memory and naive T-cell counts. Correlation between effector memory CD8+ and CD4+(a), and naive CD8+(b) and CD4+(c) T-cell absolute counts and age according to the number of infections with herpesviruses (n = 13, 32, 39 and 49 for 0, 1, 2, and 3+ infections). Statistical significance was determined by Spearman's rank correlation. Spearman's R and p values are shown for each panel.
Fig 3
Figure 3
Thymic output and naive T-cell homeostatic proliferation. (a) CD4+ and CD8+ naive T-cell absolute counts in middle aged (< 65y) and old (> 75y) subjects (n = 73 for Mid CD4 and CD8, n = 60 for Old CD4 and CD8). The magnitude of the reduction in the number of naive CD4+ and CD8+ T cells between Mid and Old is indicated. (b) Correlation between sjTRECs levels measured in total PBMCs and age according to the number of infections with herpesviruses (n = 13, 29, 35 and 48 for 0, 1, 2, and 3+ infections). (c) TRECs levels determined by digital PCR in FACS sorted CD8+ and CD4+ naive T-cell subsets from middle aged (< 65y) and old (> 75y) subjects (n = 13 for Mid CD4 and CD8, n = 11 for Old CD4, n = 6 for Old CD8). (d) Ki67 expression levels determined by flow cytometry in CD4+ and CD8+ naive T-cell subsets from middle aged (< 65y) and old (> 75y) subjects (n = 16 for Mid CD4 and CD8, n = 15 for Old CD4 and CD8). Each dot represents one donor and line median values (a, c, d). Statistical significance was determined by Mann-Whitney test and Bonferroni adjustment (a, c, d) or Spearman's rank correlation (b). Spearman's R and p values are shown for each panel (b).
Fig 4
Figure 4
TCR repertoire diversity of CD4+ and CD8+ naive T-cell compartments. (a) Observed diversity and inverse Simpson indexes calculated in CD4+ and CD8+ naive T cells from middle aged (< 65y) and old (> 75y) subjects. Each dot represents one donor and line median values. (b) Clonal space homeostasis in CD8+ naive T cells from middle aged (< 65y) and old (> 75y) subjects. Each bar represents an individual donor, identified on the x axis by the number of infections with herpesviruses.
Fig 5
Figure 5
Impact of CMV on TBEv vaccine T-cell responsiveness in older subjects. (a) Frequency of TBEv specific T cells determined by IFNγ Elispot upon stimulation with TBEv overlapping peptides at week 26 after the first vaccination in CMV-seronegative and CMV-seropositive subjects (> 70y) (n = 68 for CMV- and n = 69 CMV+). Data shown are subtracted of no-stimulation background values. (b) Correlation between naive CD4+ T-cell counts prior to vaccination and the frequency of TBEv-specific T cells at week 26 after the first vaccination (n = 132). (c, d, e) Frequencies of IFNγ producing CD4+ or CD8+ T cells upon stimulation with TBEv antigens (c), VZV antigens (d) or SEB (e), determined by intracellular cytokine staining at week 26 after the first vaccination in TBEv Elispot positive CMV-seronegative or CMV-seropositive subjects (> 70y) (n = 68 for CMV- and n = 69 CMV+). Each dot represents one donor and line median values (a, c–e). Representative flow cytometry plots are shown for unstimulated control and TBEv stimulation conditions (percentages of IFNγ producing CD4+ or CD8+ T cells are indicated). Data shown are subtracted of no-stimulation background values. Statistical significance was determined by Mann-Whitney test (a, c–e) or Spearman's rank correlation (b).
Fig 6
Figure 6
Impact of CMV on TBEv vaccine humoral responsiveness in older subjects. (a, b) Levels of TBEv specific binding (a) and neutralizing (b) antibodies (IgG) determined at week 0, 4, 8, 24 and 28 after the first vaccination in CMV-seronegative or CMV-seropositive subjects (> 70y). All individuals received three vaccine doses at week 0, 4 and 24 (n = 68 for CMV- and n = 69 CMV+). Each dot represents one donor and line median values. (c, d) Correlation between the frequency of TBEv-specific T cells at week 26 after the first vaccination and the levels of TBEv-specific binding (c) and neutralizing (d) antibodies (IgG) determined at week 28 (n = 137). Statistical significance was determined by Mann-Whitney test (a, b) or Spearman's rank correlation (c, d). Spearman's R and p values are shown for each panel.

References

    1. Hayes E.B., Komar N., Nasci R.S., Montgomery S.P., O'Leary D.R., Campbell G.L. Epidemiology and transmission dynamics of West Nile virus disease. Emerg Infect Dis. 2005;11(8):1167–1173. - PMC - PubMed
    1. Jia N., Feng D., Fang L.Q., et al. Case fatality of SARS in mainland China and associated risk factors. Trop Med Int Health. 2009;14(Suppl 1):21–27. - PMC - PubMed
    1. Kline K.A., Bowdish DM. Infection in an aging population. Curr Opin Microbiol. 2016;29:63–67. - PubMed
    1. Guan W.J., Ni Z.Y., Hu Y., et al. Clinical characteristics of coronavirus disease 2019 in China. N Engl J Med. 2020;382(18):1708–1720. - PMC - PubMed
    1. Wu Z., McGoogan J.M. Characteristics of and important lessons from the coronavirus disease 2019 (COVID-19) outbreak in China: summary of a report of 72314 cases from the Chinese center for disease control and prevention. JAMA. 2020;323(13):1239–1242. - PubMed

Publication types