

Germline biomarkers predict toxicity to anti-PD1/PDL1 checkpoint therapy
- PMID: 35115362
- PMCID: PMC8804679
- DOI: 10.1136/jitc-2021-003625
Germline biomarkers predict toxicity to anti-PD1/PDL1 checkpoint therapy
Abstract
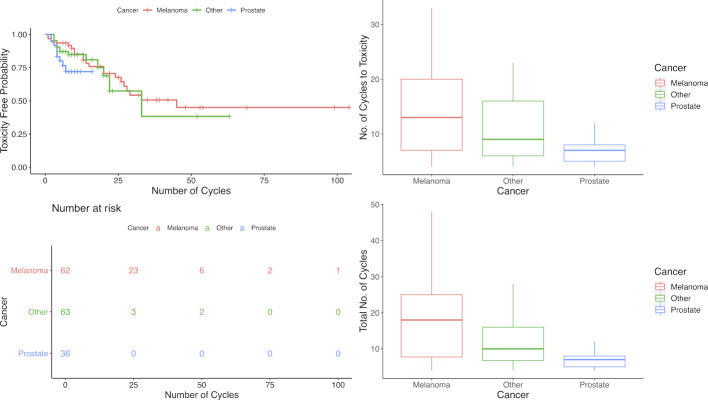
Background: There is great interest in finding ways to identify patients who will develop toxicity to cancer therapies. This has become especially pressing in the era of immune therapy, where toxicity can be long-lasting and life-altering, and primarily comes in the form of immune-related adverse effects (irAEs). Treatment with the first drugs in this class, anti-programmed death 1 (anti-PD1)/programmed death-ligand 1 (PDL1) checkpoint therapies, results in grade 2 or higher irAEs in up to 25%-30% of patients, which occur most commonly within the first 6 months of treatment and can include arthralgias, rash, pruritus, pneumonitis, diarrhea and/or colitis, hepatitis, and endocrinopathies. We tested the hypothesis that germline microRNA pathway functional variants, known to predict altered systemic stress responses to cancer therapies, would predict irAEs in patients across cancer types.
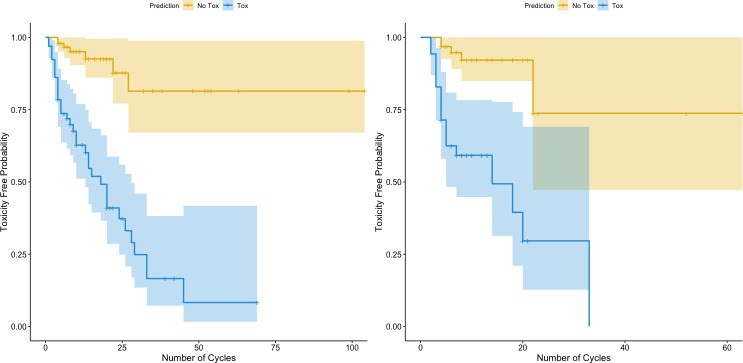
Methods: MicroRNA pathway variants were evaluated for an association with grade 2 or higher toxicity using four classifiers on 62 patients with melanoma, and then the panel's performance was validated on 99 patients with other cancer types. Trained classifiers included classification trees, LASSO-regularized logistic regression, boosted trees, and random forests. Final performance measures were reported on the training set using leave-one-out cross validation and validated on held-out samples. The predicted probability of toxicity was evaluated for its association, if any, with response categories to anti-PD1/PDL1 therapy in the melanoma cohort.
Results: A biomarker panel was identified that predicts toxicity with 80% accuracy (F1=0.76, area under the curve (AUC)=0.82) in the melanoma training cohort and 77.6% accuracy (F1=0.621, AUC=0.778) in the pan-cancer validation cohort. In the melanoma cohort, the predictive probability of toxicity was not associated with response categories to anti-PD1/PDL1 therapy (p=0.70). In the same cohort, the most significant biomarker of toxicity in RAC1, predicting a greater than ninefold increased risk of toxicity (p<0.001), was also not associated with response to anti-PD1/PDL1 therapy (p=0.151).
Conclusions: A germline microRNA-based biomarker signature predicts grade 2 and higher irAEs to anti-PD1/PDL1 therapy, regardless of tumor type, in a pan-cancer manner. These findings represent an important step toward personalizing checkpoint therapy, the use of which is growing rapidly.
Keywords: autoimmunity; genetic markers.
© Author(s) (or their employer(s)) 2022. Re-use permitted under CC BY. Published by BMJ.
Conflict of interest statement
Competing interests: JW has created intellectual property that was patented at Yale University and licensed to MiraDx, a company that she cofounded. MiraDx has developed miRSNP panels that were applied to blinded samples in this analysis.
Figures
References
-
- Postow M, Wolchok J. Toxicities associated with checkpoint inhibitor immunotherapy. Post TW. Updated, 2017.
Publication types
MeSH terms
Substances
Grants and funding
LinkOut - more resources
Full Text Sources
Research Materials