. 2022 Feb 8;119(6):e2108091119.
doi: 10.1073/pnas.2108091119.

Decoding the information structure underlying the neural representation of concepts

Affiliations

Decoding the information structure underlying the neural representation of concepts

Leonardo Fernandino et al. Proc Natl Acad Sci U S A. .

Abstract

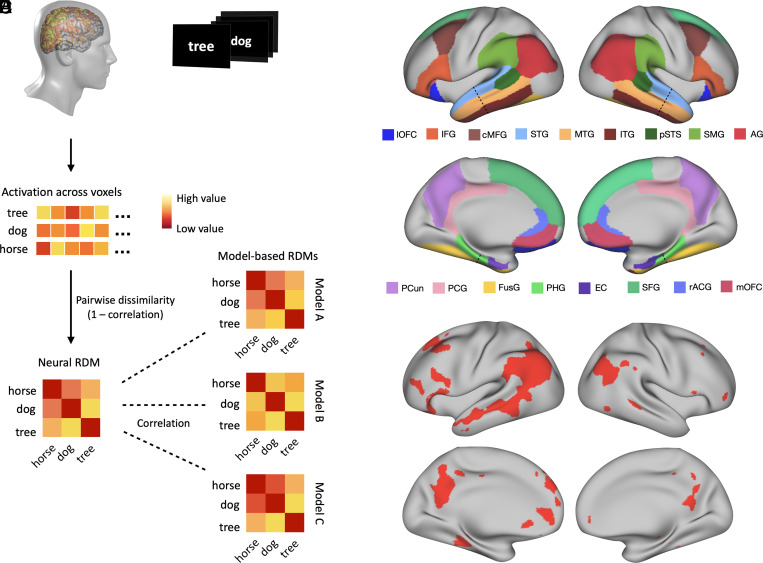
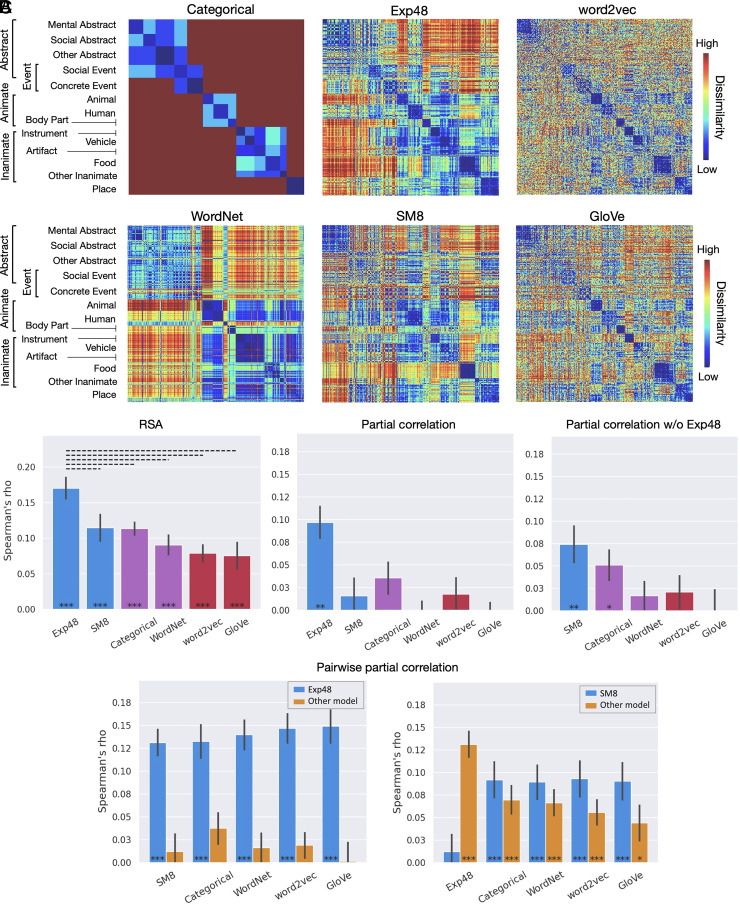
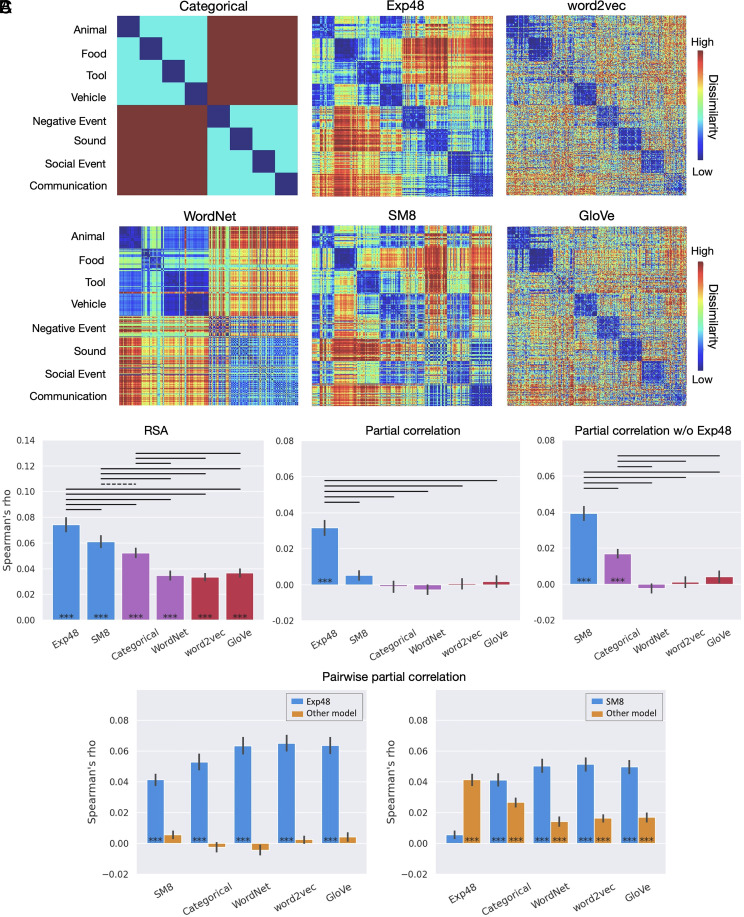
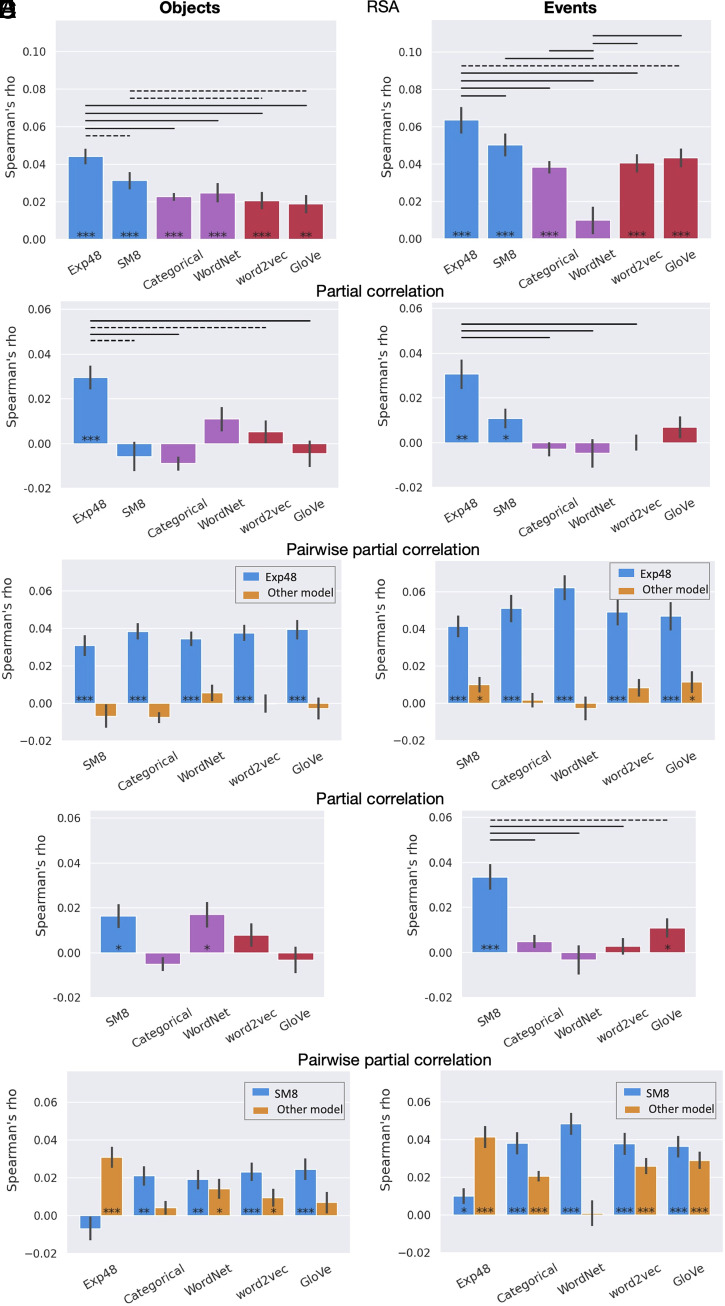
The nature of the representational code underlying conceptual knowledge remains a major unsolved problem in cognitive neuroscience. We assessed the extent to which different representational systems contribute to the instantiation of lexical concepts in high-level, heteromodal cortical areas previously associated with semantic cognition. We found that lexical semantic information can be reliably decoded from a wide range of heteromodal cortical areas in the frontal, parietal, and temporal cortex. In most of these areas, we found a striking advantage for experience-based representational structures (i.e., encoding information about sensory-motor, affective, and other features of phenomenal experience), with little evidence for independent taxonomic or distributional organization. These results were found independently for object and event concepts. Our findings indicate that concept representations in the heteromodal cortex are based, at least in part, on experiential information. They also reveal that, in most heteromodal areas, event concepts have more heterogeneous representations (i.e., they are more easily decodable) than object concepts and that other areas beyond the traditional "semantic hubs" contribute to semantic cognition, particularly the posterior cingulate gyrus and the precuneus.

Keywords: concept representation; embodied semantics; lexical semantics; representational similarity analysis; semantic memory.


Conflict of interest statement

The authors declare no competing interest.

Figures

Fig. 1.
Fig. 1.
Representational similarity analysis. (A) An fMRI activation map was generated for each concept presented in the study, and the activation across voxels was reshaped as a vector. (B) The neural RDM for the stimulus set was generated by computing the dissimilarity between these vectors (1 − correlation) for every pair of concepts. (C) A model-based RDM was computed from each model, and the similarity between each model’s RDM and the neural RDM was evaluated via Spearman correlation. (D) Anatomically defined ROIs. The dashed line indicates the boundary where temporal lobe ROIs were split into anterior and posterior portions (see main text for acronyms). (E) Cortical areas included in the functionally defined semantic network ROI (49).
Fig. 2.
Fig. 2.
Study 1. (A) Dissimilarity matrices for the representational spaces tested. Rows and columns represent each of the 300 concepts used in the study, grouped according to the categorical model to reveal taxonomic structure. (B) RSA results for the semantic network ROI. Experiential (blue), taxonomic (purple), and distributional (red) models. Left: Correlations between the group-averaged neural RDM and each model-based RDM. Center: Partial correlation results for each model while controlling for its similarity with all other models. Right: Partial correlation results when Exp48 was excluded from the analysis. (C) Pairwise partial correlations for the semantic network ROI, with blue bars representing Exp48 (Left) or SM8 (Right) while controlling for its similarity to each of the other model-based RDMs; yellow bars correspond to each of the other model-based RDMs while controlling for their similarity to the model represented in blue. ***P < 0.0005, **P < 0.005, *P < 0.05, Mantel test; solid bar: P < 0.001; dashed bar: P < 0.05, permutation test. All P values are FDR corrected for multiple comparisons (q = 0.05). Error bars represent the SE.
Fig. 3.
Fig. 3.
Study 2. (A) Dissimilarity matrices for the representational spaces tested. Rows and columns have been grouped according to the Categorical model to reveal taxonomic structure. (B) RSA results across participants for the semantic network ROI. Group mean values of the correlations between each participant’s neural RDM and the model-based RDMs. Full RSA correlations (Left) and partial correlations with Exp48 included (Center) and excluded (Right). (C) Pairwise partial correlations, with blue bars representing Exp48 (Left) or SM8 (Right) while controlling for its similarity to each of the other models; yellow bars correspond to each of the other models while controlling for their similarity to the model represented in blue. ***P < 0.0005 ; solid bar: P < 0.001; dashed bar: P < 0.05; Wilcoxon signed-rank tests. All P values are FDR corrected for multiple comparisons (q = 0.05). Error bars represent the SEM.
Fig. 4.
Fig. 4.
Results for object concepts (Left) and event concepts (Right) for the semantic network ROI in Study 2 (across participants). (A) RSA results. (B) Partial correlations. (C) Pairwise partial correlations for Exp48. (D) Partial correlations with Exp48 excluded from the analysis. (E) Pairwise partial correlations for SM8. In the pairwise partial correlation charts, blue bars represent an experiential model (Exp48 in C and SM8 in E) while controlling for its similarity to each of the other models; yellow bars correspond to each of the other models while controlling for their similarity to the experiential model represented in blue. ***P < .0005, **P < .005, *P < .05; solid bar, P < .001; dashed bar, P < .05; Wilcoxon signed-rank tests. All P values are FDR-corrected for multiple comparisons (q = .05). Error bars represent the standard error of the mean.

References

    1. Mitchell T. M., et al. , Predicting human brain activity associated with the meanings of nouns. Science 320, 1191–1195 (2008). - PubMed
    1. Huth A. G., de Heer W. A., Griffiths T. L., Theunissen F. E., Gallant J. L., Natural speech reveals the semantic maps that tile human cerebral cortex. Nature 532, 453–458 (2016). - PMC - PubMed
    1. Carota F., Kriegeskorte N., Nili H., Pulvermüller F., Representational similarity mapping of distributional semantics in left inferior frontal, middle temporal, and motor cortex. Cereb. Cortex 27, 294–309 (2017). - PMC - PubMed
    1. Ralph M. A., Jefferies E., Patterson K., Rogers T. T., The neural and computational bases of semantic cognition. Nat. Rev. Neurosci. 18, 42–55 (2017). - PubMed
    1. Pereira F., et al. , Toward a universal decoder of linguistic meaning from brain activation. Nat. Commun. 9, 963 (2018). - PMC - PubMed

Publication types

LinkOut - more resources