. 2022 Feb 3;12(1):51.
doi: 10.1038/s41398-022-01816-1.

Compromised mammillary body connectivity and psychotic symptoms in mice with di- and mesencephalic ablation of ST8SIA2

Affiliations

Compromised mammillary body connectivity and psychotic symptoms in mice with di- and mesencephalic ablation of ST8SIA2

Melike Küçükerden et al. Transl Psychiatry. .

Abstract

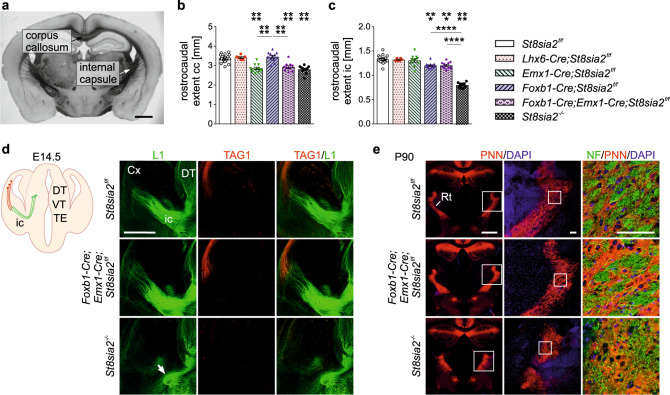
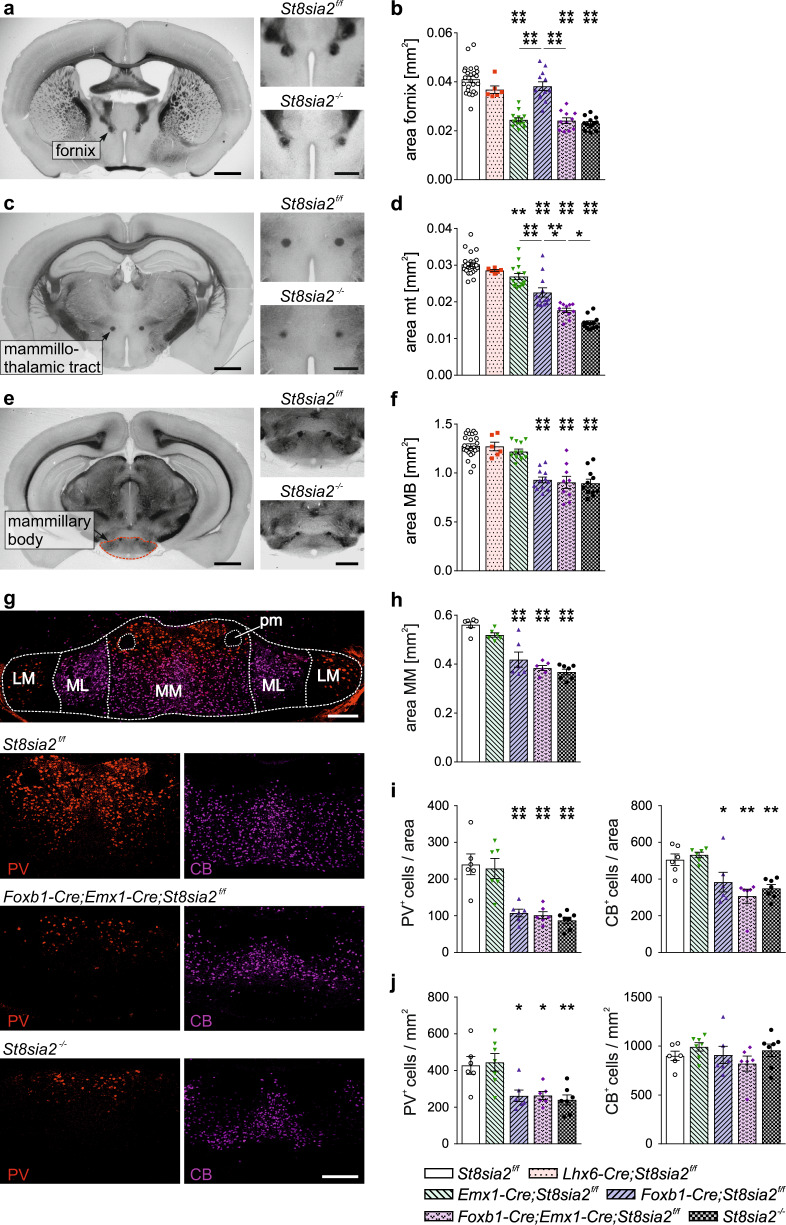
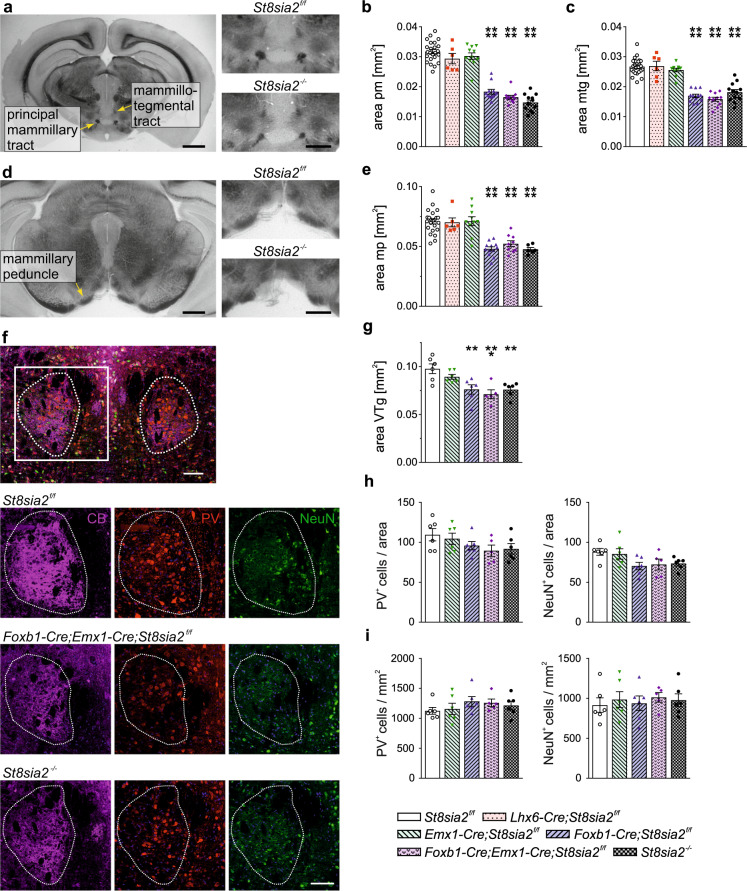
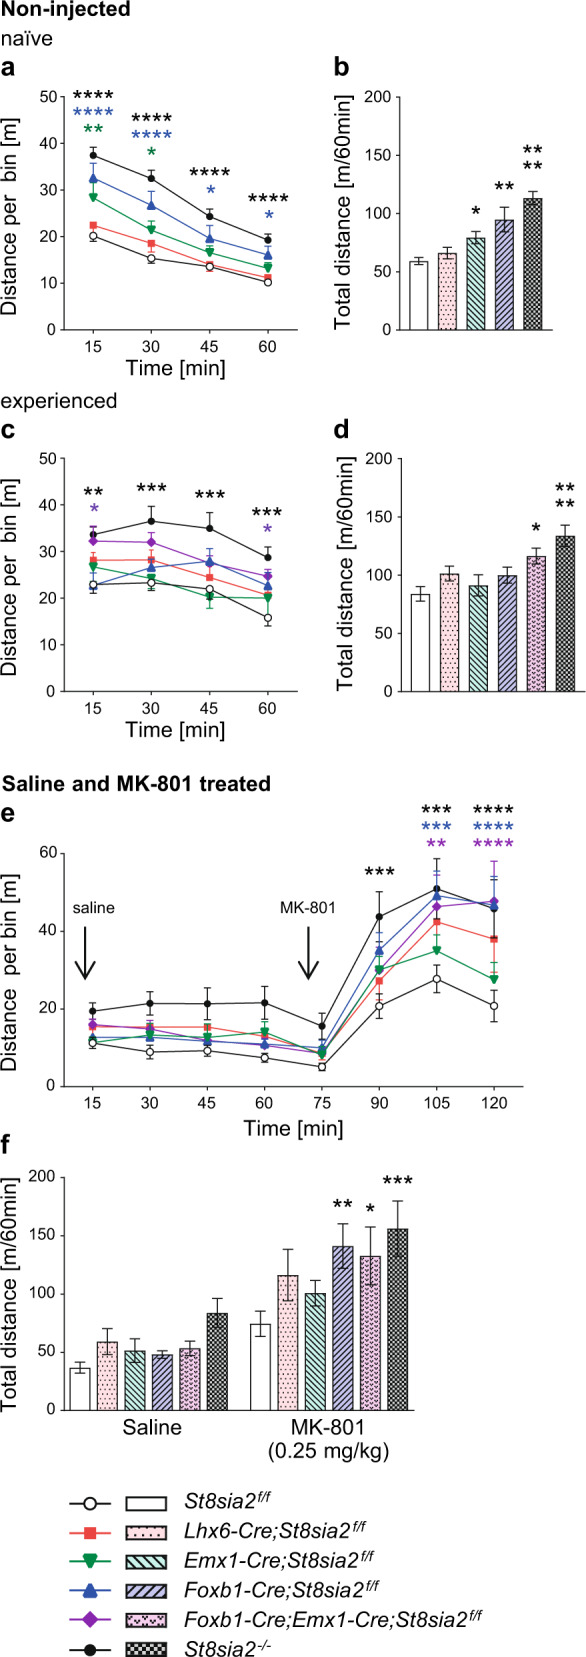
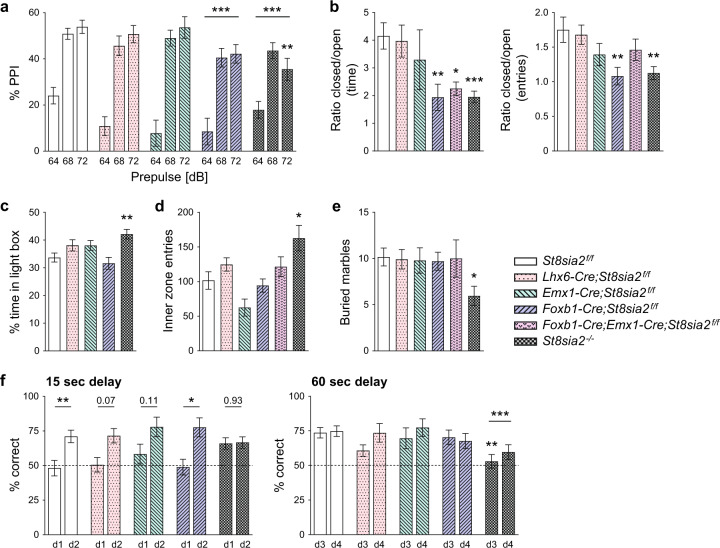
Altered long-range connectivity is a common finding across neurodevelopmental psychiatric disorders, but causes and consequences are not well understood. Genetic variation in ST8SIA2 has been associated with schizophrenia, autism, and bipolar disorder, and St8sia2-/- mice show a number of related neurodevelopmental and behavioral phenotypes. In the present study, we use conditional knockout (cKO) to dissect neurodevelopmental defects and behavioral consequences of St8sia2 deficiency in cortical interneurons, their cortical environment, or in the di- and mesencephalon. Neither separate nor combined cortical and diencephalic ablation of St8sia2 caused the disturbed thalamus-cortex connectivity observed in St8sia2-/- mice. However, cortical ablation reproduced hypoplasia of corpus callosum and fornix and mice with di- and mesencephalic ablation displayed smaller mammillary bodies with a prominent loss of parvalbumin-positive projection neurons and size reductions of the mammillothalamic tract. In addition, the mammillotegmental tract and the mammillary peduncle, forming the reciprocal connections between mammillary bodies and Gudden's tegmental nuclei, as well as the size of Gudden's ventral tegmental nucleus were affected. Only mice with these mammillary deficits displayed enhanced MK-801-induced locomotor activity, exacerbated impairment of prepulse inhibition in response to apomorphine, and hypoanxiety in the elevated plus maze. We therefore propose that compromised mammillary body connectivity, independent from hippocampal input, leads to these psychotic-like responses of St8sia2-deficient mice.


Conflict of interest statement

The authors declare no competing interests.

Figures

Fig. 1
Fig. 1. Deficits of thalamus-cortex connectivity in St8sia2−/− mice are not reproduced by any of the cKO lines.
a Representative image showing the corpus callosum and the internal capsule on a coronal brain section from a St8sia2f/f mouse. b, c Rostrocaudal extent of the corpus callosum (cc) and the internal capsule (ic) for the indicated genotypes. Graphs show means ± SEM and individual data points of n = 24, 6, 11, 12, 11, and 11 St8sia2f/f, Lhx6-Cre;St8sia2f/f, Emx1-Cre;St8sia2f/f, Foxb1-Cre;St8sia2f/f, Foxb1-Cre;Emx1-Cre;St8sia2f/f and St8sia2−/− mice, respectively. One-way ANOVA indicated significant differences (p < 0.0001; F5,69 = 27.28 in b, F5,69 = 88.33 in c). Holm–Sidak’s post hoc tests were applied and significant differences for comparisons with St8sia2f/f controls or between selected genotype groups are indicated (***p < 0.001, ****p < 0.0001). d Scheme of thalamocortical (green) and corticothalamic axons (red), and immunolabelling with L1- (green) and TAG1-specific antibodies (red) on coronal sections of brains from embryonic day (E) 14.5 mice of the indicated genotypes (DT, dorsal thalamus; VT, ventral thalamus; TE, thalamic eminence; ic, internal capsule). The white arrow points to deviating thalamocortical axons in the St8sia2−/− embryo. e Labeling of perineuronal nets with Wisteria floribunda agglutinin (PNN, red) to visualize the reticular thalamic nucleus (Rt), and neurofilament staining of fibers (NF, green) on coronal sections of brains from P90 mice of the indicated genotypes. Boxed areas highlight higher magnification views in the following column. Scale bars, 1 mm in (a) and (e), left column, 500 μm in (d), 100 μm in (e), middle and right column.
Fig. 2
Fig. 2. Ablation of St8sia2 by Emx1- or Foxb1-Cre causes distinct size reductions of fornix, mammillothalamic tract and mammillary body.
af Representative images of crossections and evaluations of crossectional areas of the postcommissural fornix at bregma −0.22 mm (a, b), the mammillothalamic tract (mt) at bregma −1.82 mm (c, d) and the mammillary body (MB) at bregma ­2.80 mm (e, f). Scale bars, 1 mm (overviews) and 500 µm (higher magnifications). Graphs show means ± SEM and individual data points of n = 24, 6, 14, 12, 11, and 12 (b, d) or n = 24, 6, 12, 12, 9, and 11 (f) St8sia2f/f, Lhx6-Cre;St8sia2f/f, Emx1-Cre;St8sia2f/f, Foxb1-Cre;St8sia2f/f, Foxb1-Cre;Emx1-Cre;St8sia2f/f, and St8sia2−/− mice, respectively. One-way ANOVA indicated significant differences (p < 0.0001; F5,73 = 44.25 in b, F5,73 = 66.38 in d, F5,68 = 29.94 in f). Holm–Sidak’s post hoc tests were applied and significant differences for comparisons with St8sia2f/f controls or between selected genotype groups are indicated (*p < 0.05, **p < 0.01, ***p < 0.001, ****p < 0.0001). g Double immunofluorescent staining for parvalbumin (PV, red) and calbindin (CB, magenta) of the mammillary body nuclei on coronal sections of brains from P90 mice at bregma level −0.28 mm. Overview (upper panel) and representative single channel views of the indicated genotypes. MM, medial mammillary nucleus, pars medialis; ML, medial mammillary nucleus, pars lateralis; LM, lateral mammillary nucleus; pm, principal mammillary tract. Scale bars, 200 µm. hj Evaluation of the crossectional area of the MM (h), the numbers (i) and the densities (j) of PV- and CB-positive cells in the crossectional area of the MM. Graphs show means ± SEM and individual data points of n = 6 St8sia2f/f, Emx1-Cre;St8sia2f/f, Foxb1-Cre;St8sia2f/f, Foxb1-Cre;Emx1-Cre;St8sia2f/f, and St8sia2−/− mice, respectively. One-way ANOVA indicated significant differences with p < 0.0001 for the areas in (h) (F4,26 = 27.10), for the numbers of PV- and CB-positive neurons in (i) (F4,26 = 16.20 and F4,26 = 8.831), with p = 0.0004 for the denisities of PV-positive neurons in (j) (F4,27 = 7.211), but not for the densities of CB-positive neurons in (j) (p = 0.42; F4,27 = 1.002). Holm–Sidak’s post hoc tests were applied and significant differences for comparisons with St8sia2f/f controls are indicated (*p < 0.05, **p < 0.01, ****p < 0.0001). All groups with significant differences to the controls were also different from Emx1-Cre;St8sia2f/f with at least p < 0.05 (not shown).
Fig. 3
Fig. 3. Ablation of St8sia2 by Foxb1-Cre affects tegmental connectivity of the MB.
ae Representative images of crossections (a, d) and evaluations of crossectional areas of the principle mammillary tract (pm, b) and the mammillotegmental tract (mtg, c) at bregma −2.70 mm, and the mammillary peduncle (mp) at bregma −3.28 (e). Scale bars, 1 mm (overviews) and 500 µm (higher magnifications). Graphs show means ± SEM and individual data points of n = 24, 6, 11, 12, 11 and 12 (b, c) or n = 23, 6, 10, 12, 9, and 6 (e) St8sia2f/f, Lhx6-Cre;St8sia2f/f, Emx1-Cre;St8sia2f/f, Foxb1-Cre;St8sia2f/f, Foxb1-Cre;Emx1-Cre;St8sia2f/f, and St8sia2−/− mice, respectively. One-way ANOVA indicated significant differences (p < 0.0001; F5,70 = 82.54 in b, F5,73 = 48.90 in c, F5,60 = 19.24 in e). Holm–Sidak’s post hoc tests were applied and significant differences for comparisons with St8sia2f/f controls are indicated (****p < 0.0001). f Triple immunofluorescent staining for calbindin (CB, magenta), parvalbumin (PV, red), and NeuN (green) of the ventral tegmantal nuclei (VTg, dotted outline) on coronal sections of brains from P90 mice at bregma level −4.90 mm. Overview (upper panel) and representative single channel views of the indicated genotypes. Scale bars, 100 µm. gi Evaluation of the crossectional area of the VTg (g), the numbers (h) and the densities (i) of PV- and CB-positive cells in the crossectional area of the VTg. Graphs show means ± SEM and individual data points of n = 5 Foxb1-Cre;Emx1-Cre;St8sia2f/f mice or n = 6 St8sia2f/f, Emx1-Cre;St8sia2f/f, Foxb1-Cre;St8sia2f/f, and St8sia2−/− mice, respectively. One-way ANOVA indicated significant differences with p = 0.0007 for the areas in (g) (F4,24 = 6.992), but not for the numbers or densities of PV- and CB-positive neurons in (h) and (i) (p = 0.22, F4,24 = 1.55 and p = 0.059, F4,24 = 2.630 for PV and NeuN in h; p = 0.94, F4,24 = 0.19 and p = 0.55, F4,24 = 0.79 for PV and NeuN in i). Holm–Sidak’s post hoc test was applied for data in (g) and significant differences for comparisons with St8sia2f/f controls are indicated (**p < 0.01, ***p < 0.001). When compared to Emx1-Cre;St8sia2f/f, differences with p < 0.05 were only observed for Foxb1-Cre;Emx1-Cre;St8sia2f/f.
Fig. 4
Fig. 4. Ablation of St8sia2 by Foxb1-Cre increases locomotor activity and susceptibility to MK-801.
Activity in the open field arena was monitored over 60 min and evaluated as distance traveled in 15 min bins (line graphs), or as overall distance traveled in 60 min (bar graphs). ad Activity of otherwise untreated mice (non-injected) without (naive, cohort 1; a, b) or with prior experience in the arena (experienced, cohort 2; c, d; see text for details). e, f Activity of mice in cohort 2 injected i.p. with saline and MK-801 (0.25 mg/kg body weight) as indicated. Graphs show means and SEM of n = 27, 12, 10, 11, and 20 St8sia2f/f, Lhx6-Cre;St8sia2f/f, Emx1-Cre;St8sia2f/f, Foxb1-Cre;St8sia2f/f, and St8sia2−/− mice in cohort 1 (non-injected, naive; a, b), and n = 12, 10, 5, 16, 14, and 17 or n = 16, 12, 14, 18, 14, and 18 St8sia2f/f, Lhx6-Cre;St8sia2f/f, Emx1-Cre;St8sia2f/f, Foxb1-Cre;St8sia2f/f, Foxb1-Cre;Emx1-Cre;St8sia2f/f, and St8sia2/− non-injected (experienced; c, d) or saline and MK-801 treated mice in cohort 2 (e, f), respectively. Statistics: In a, c, e, and f, two-way repeated measure (RM) ANOVA indicated interaction with p < 0.0001 (F12,225 = 3.67), and differences with p < 0.0001 for time (F3,225 = 152.4) and genotype (F4,75 = 20.13) in (a), no significant interaction (p = 0.36, F15,204 = 1.1), but differences with p < 0.0001 for time (F3,204 = 12.2), and p = 0.0002 for genotype (F5,68 = 5.66) in (c), interaction with p = 0.009 (F35,602 = 1.68), and differences with p < 0.0001 for time (F7,602 = 92.8) and p = 0.0091 for genotype (F5,86 = 3.29) in (e), and no significant interaction (p = 0.23, F5,86 = 1.4), but differences with p < 0.0001 for treatment (F1,86 = 78.1), and p = 0.009 for genotype (F5,86 = 3.29) in (f). In b and d, genotype comparisons indicated differences with p < 0.0001 by the Kruskal–Wallis test in b (h = 42.86) and with p = 0.0002 by one-way ANOVA in d (F5,68 = 5.66). Holm–Sidak’s post hoc tests were applied for data in (a) and (cf), Dunn’s post hoc test for data in (b), and significant differences for comparisons with St8sia2f/f controls are indicated (*p < 0.05, **p < 0.01, ***p < 0.001, ****p < 0.0001).
Fig. 5
Fig. 5. Ablation of St8sia2 by Foxb1-Cre impairs PPI and reduces anxiety in the elevated plus maze, but has no effect in other tests of anxiety-like behavior or on working memory.
a PPI of the acoustic startle response after prepulses of 64, 68, and 72 dB in mice treated with 5 mg/kg apomorphine. Graphs show means ± SEM of n = 37, 18, 17, 18, and 27 St8sia2f/f, Lhx6-Cre;St8sia2f/f, Emx1-Cre;St8sia2f/f, Foxb1-Cre;St8sia2f/f, and St8sia2−/− mice, respectively. b Elevated plus maze. Ratios between the time spent in the closed versus the open arm of the elevated plus maze (left), and between the numbers of closed and open arm entries (right). Graphs show means ± SEM of n = 15, 23, 6, 17, 5, and 21 (left) or n = 16, 24, 6, 19, 6, and 22 (right) St8sia2f/f, Lhx6-Cre;St8sia2f/f, Emx1-Cre;St8sia2f/f, Foxb1-Cre;St8sia2f/f, Foxb1-Cre;Emx1-Cre;St8sia2f/f, and St8sia2−/− mice, respectively. ce Percent of time spent in the light compartment of a dark-light box (c), number of entries into the inner zone of the open field (d, experienced mice, see Fig. 4c) and number of marbles buried in the marble burying test (e). Graphs show means ± SEM of n = 16, 20, 17, 15, and 18 St8sia2f/f, Lhx6-Cre;St8sia2f/f, Emx1-Cre;St8sia2f/f, Foxb1-Cre;St8sia2f/f, and St8sia2−/− mice (c), or n = 12, 10, 5, 16, 14, and 17 (d) and n = 23, 24, 18, 23, 9, and 20 (e) St8sia2f/f, Lhx6-Cre;St8sia2f/f, Emx1-Cre;St8sia2f/f, Foxb1-Cre;St8sia2f/f, Foxb1-Cre;Emx1-Cre;St8sia2f/f, and St8sia2−/− mice, respectively. f Delayed nonmatch-to-place T-maze task. Percent correct choices (arm alterations) of mice tested on day 1 and 2 (d1, d2) with a forced delay of 15 s (left) and on day 3 and 4 (d3, d4) with a forced delay of 60 s (right). Graphs show means ± SEM of n = 32 or n = 37 St8sia2f/f controls for the tests with 15 or 60 s delay, and n = 17, 14, 16, and 25 Lhx6-Cre;St8sia2f/f, Emx1-Cre;St8sia2f/f, Foxb1-Cre;St8sia2f/f, and St8sia2−/− mice, respectively. Statistics: In a, two-way ANOVA indicated no significant interaction (p = 0.059, F8,336 = 1.90), but differences with p < 0.0001 for prepulse (F2,336 = 105.0) and p = 0.0003 for genotype (F4,336 = 5.53). In b, genotype comparisons for “time” were performed by Welch’s ANOVA after square root transformation, to meet the assumption of normal distribution (left), or by one-way ANOVA (right), indicating differences with p = 0.003 (W5.0,25.13 = 5.01) or p = 0.001 (F5,87 = 4.38). In c, d, and e, one-way ANOVA indicated differences with p = 0.003 (F4,81 = 4.58), p = 0.001 (F5,68 = 4.60), and p = 0.086 (F5,111 = 1.99). In f, two-way RM ANOVA indicated for the 15 s delay test no significant interaction (p = 0.14, F4,99 = 1.77), no difference for genotype (p = 0.41, F4,99 = 1.01), but differences with p < 0.0001 for day (F1,99 = 22.4), and for the 60 s delay test no significant interaction (p = 0.67, F4,104 = 0.59), no difference for day (p = 0.13, F4,104 = 2.27), but differences with p = 0.002 for genotype (F4,104 = 4.65). In a and f (right panel), Holm–Sidak’s multiple comparisons tests were used to analyze main effects of genotype. Dunnet’s T3 or Holm–Sidak’s multiple comparisons tests were applied to analyze simple effects of genotype after Welch’s ANOVA in (b) (left) or after one- or two-way ANOVA in (a), (b) (right), and (cf). In f, Holm–Sidak’s post hoc tests were applied for comparisons between d1 and d2. p-values for comparisons between d1 and d2 (f, left) or significant differences for comparisons with St8sia2f/f controls are indicated (*p < 0.05, **p < 0.01, ***p < 0.001).

References

    1. Birnbaum R, Weinberger DR. Genetic insights into the neurodevelopmental origins of schizophrenia. Nat Rev Neurosci. 2017;18:727–40. - PubMed
    1. Hashem S, Nisar S, Bhat AA, Yadav SK, Azeem MW, Bagga P, et al. Genetics of structural and functional brain changes in autism spectrum disorder. Transl Psychiatry. 2020;10:229. - PMC - PubMed
    1. Kloiber S, Rosenblat JD, Husain MI, Ortiz A, Berk M, Quevedo J, et al. Neurodevelopmental pathways in bipolar disorder. Neurosci Biobehav Rev. 2020;112:213–26. - PubMed
    1. Gałecki P, Talarowska M. Neurodevelopmental theory of depression. Prog Neuropsychopharmacol Biol Psychiatry. 2018;80:267–72. - PubMed
    1. Kelly S, Jahanshad N, Zalesky A, Kochunov P, Agartz I, Alloza C, et al. Widespread white matter microstructural differences in schizophrenia across 4322 individuals: results from the ENIGMA Schizophrenia DTI Working Group. Mol Psychiatry. 2018;23:1261–9. - PMC - PubMed

Publication types

Substances