. 2022 Feb 3;13(1):676.
doi: 10.1038/s41467-021-27948-4.

TNF antagonist sensitizes synovial fibroblasts to ferroptotic cell death in collagen-induced arthritis mouse models

Affiliations

TNF antagonist sensitizes synovial fibroblasts to ferroptotic cell death in collagen-induced arthritis mouse models

Jiao Wu et al. Nat Commun. .

Abstract

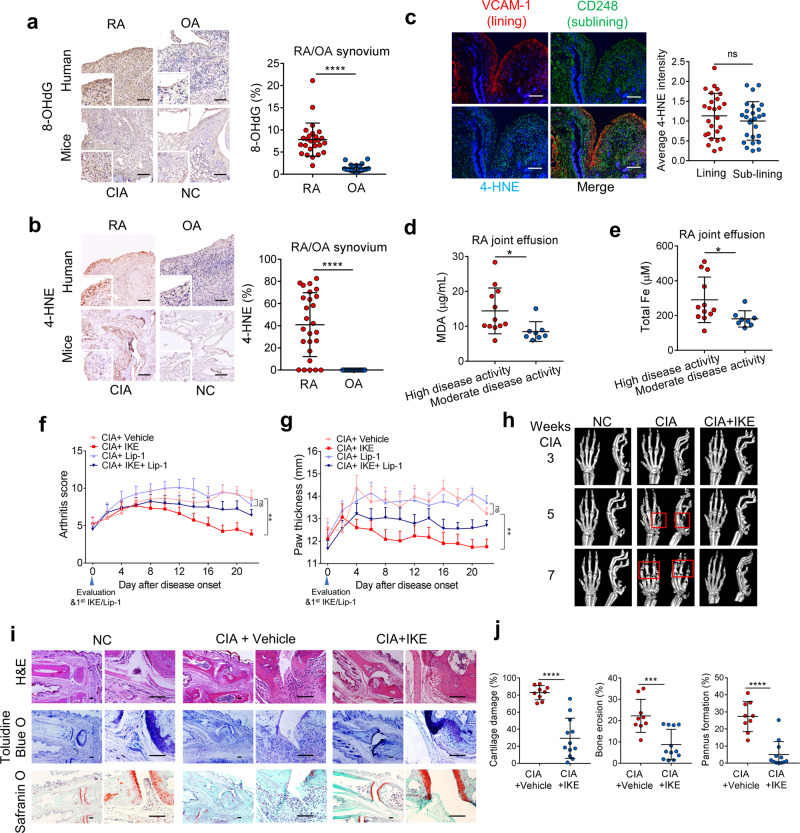
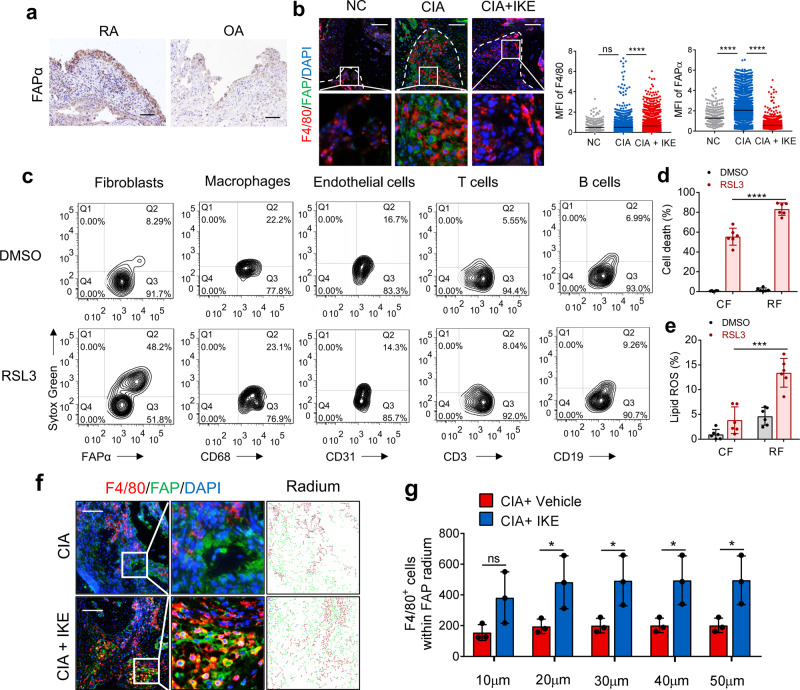
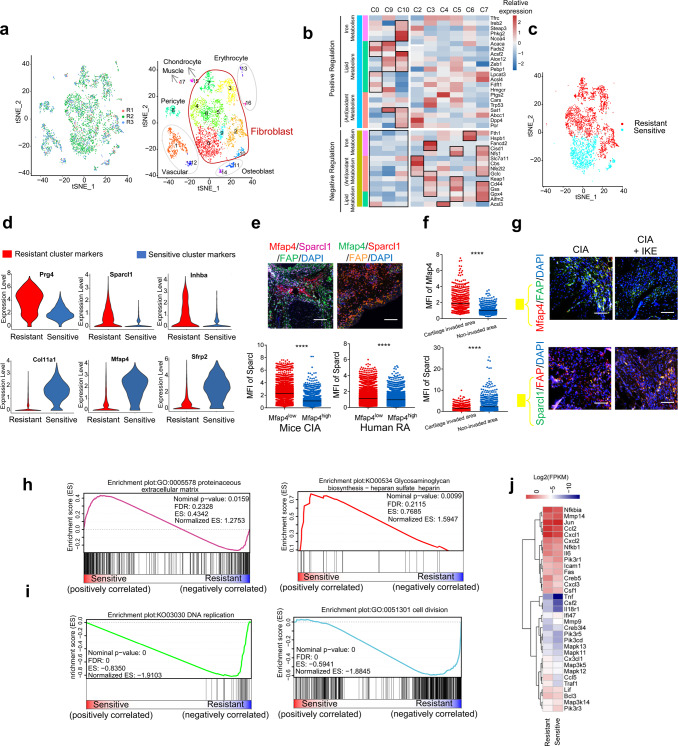
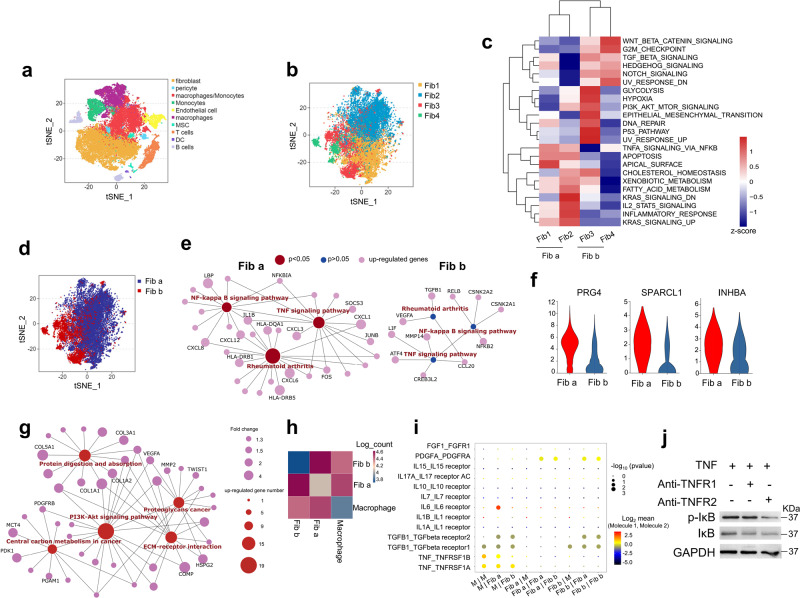
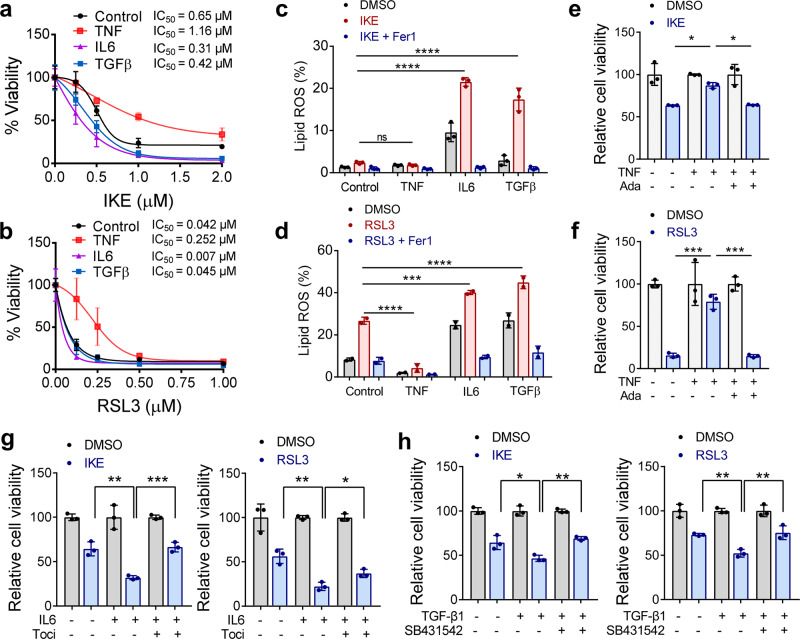
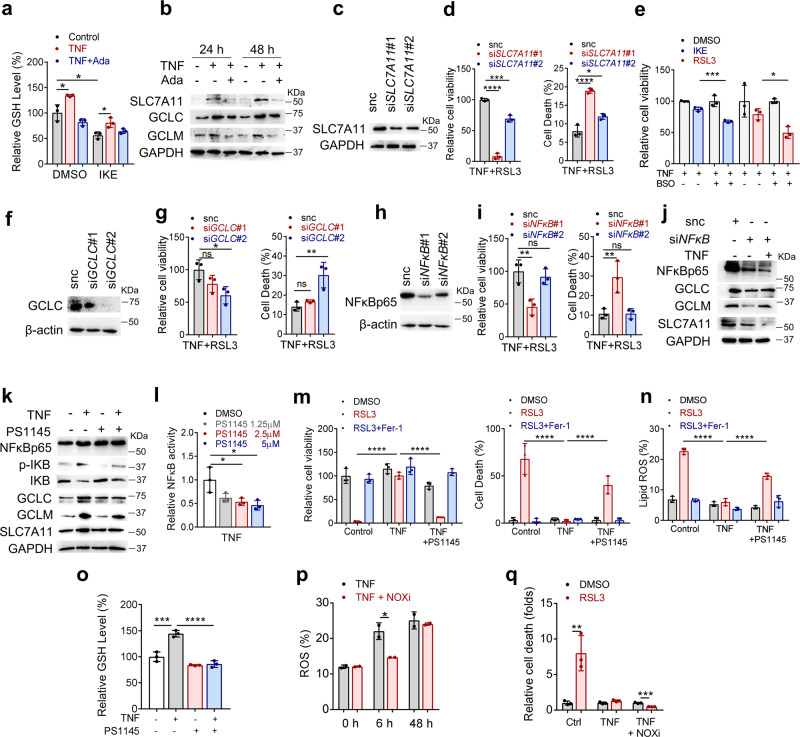
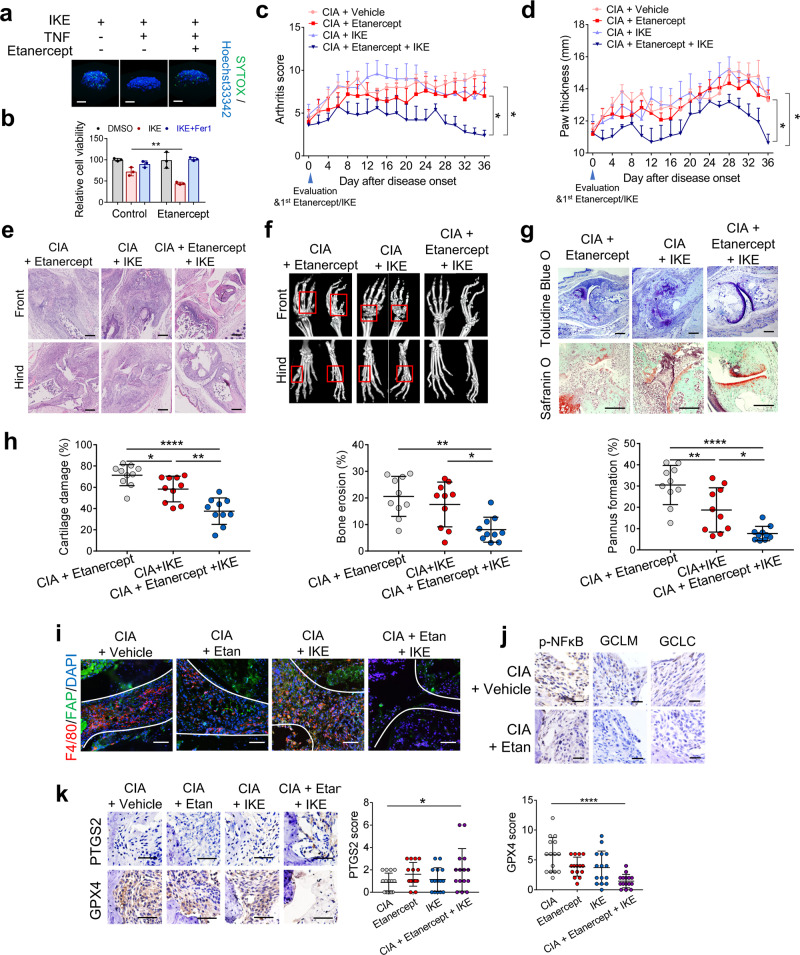
Ferroptosis is a nonapoptotic cell death process that requires cellular iron and the accumulation of lipid peroxides. In progressive rheumatoid arthritis (RA), synovial fibroblasts proliferate abnormally in the presence of reactive oxygen species (ROS) and elevated lipid oxidation. Here we show, using a collagen-induced arthritis (CIA) mouse model, that imidazole ketone erastin (IKE), a ferroptosis inducer, decreases fibroblast numbers in the synovium. Data from single-cell RNA sequencing further identify two groups of fibroblasts that have distinct susceptibility to IKE-induced ferroptosis, with the ferroptosis-resistant fibroblasts associated with an increased TNF-related transcriptome. Mechanistically, TNF signaling promotes cystine uptake and biosynthesis of glutathione (GSH) to protect fibroblasts from ferroptosis. Lastly, low dose IKE together with etanercept, a TNF antagonist, induce ferroptosis in fibroblasts and attenuate arthritis progression in the CIA model. Our results thus imply that the combination of TNF inhibitors and ferroptosis inducers may serve as a potential candidate for RA therapy.


Conflict of interest statement

The authors declare no competing interests.

Figures

Fig. 1
Fig. 1. The ferroptosis inducer IKE modulated joint inflammation and tissue damage.
a Left, representative immunohistochemical staining of 8-OHdG in hyperplastic rheumatoid synovium of rheumatoid arthritis (RA) and osteoarthritis (OA) patients and in the inflamed joint tissue of collagen-induced arthritis (CIA) model mice. Scale bars, 100 μm. Right, Quantitative comparison of 8-OHdG in RA and OA patients (n = 26 RA patients; n = 21 OA patients). ****P < 0.0001 (two-tailed t-test). b Left, representative immunohistochemical staining of 4-HNE in hyperplastic rheumatoid synovium of RA and OA patients and in the inflamed joint tissue of CIA model mice. Scale bars, 100 μm. Right, Quantitative comparison of 4-HNE in RA and OA patients (n = 26 RA patients; n = 21 OA patients). ****P < 0.0001 (two-tailed t-test). c Representative fluorescent multiplex IHC staining (left panel) and quantification (right panel) of RA joint synovium labeled with anti-VCAM-1 (red), anti-CD248 (green), anti-4-HNE (light blue), and DAPI (blue). Scale bars, 200 μm. ns, P = 0.3804 (two-tailed t-test). d MDA concentration in the joint fluid of RA patients with different disease activities. *P = 0.0274 (two-tailed t-test). e Total iron concentrations in the joint fluid of RA patients. *P = 0.0365 (two-tailed t-test). High disease activity, n = 12 RA patients; moderate disease activity, n = 8 RA patients (d and e). Joint inflammation was measured by arthritis score (f) (**P = 0.0011; ns, P = 0.8455; one-way ANOVA followed by multiple comparisons was performed to compare the means of arthritis score at the end point) and paw thickness (g) (**P = 0.0037; ns, P = 0.5670; one-way ANOVA followed by multiple comparisons) in CIA mice intraperitoneally injected with 40 mg/kg IKE every day and/or 10 mg/kg liproxstain-1 (Lip-1) every 2 days for 22 days. n = 9 mice for CIA + Vehicle and CIA + IKE group, n = 8 mice for CIA + Lip-1 and CIA + IKE + Lip-1 group. h Representative micro-computed tomography (micro-CT) images of control and CIA model mice with or without IKE treatment. i Images of hematoxylin and eosin (H&E), toluidine blue O, and safranin O staining of representative joints in control and CIA mice with or without IKE treatment at day 22 after treatment initiation. Scale bars, 100 μm. j Quantification of the histomorphometric analysis of cartilage damage, bone erosion, and pannus formation. ****P < 0.0001, ***P = 0.0006; two-tailed t-test. n = 9 joints for CIA group, n = 12 joints for CIA + IKE group. Data in f and g are presented as mean ± SEM. Other data are presented as mean ± SD. Source data are provided as a Source data file.
Fig. 2
Fig. 2. The ferroptosis inducer IKE decreased fibroblast populations in RA synovium.
a Representative immunohistochemical staining of FAPα in hyperplastic rheumatoid synovium of 26 RA and 21 OA patients. Scale bars, 50 μm. b Representative fluorescent multiplex IHC staining and scoring of joints labeled with anti-F4/80 (red), anti-FAPα (green), and DAPI (blue). Scale bars, 100 μm. n = 413 (NC), 3698 (CIA), 3469 (CIA + IKE) cells from 3 independent joints for each group. ****P < 0.0001; ns, P = 0.6849; one-way ANOVA followed by multiple comparisons. c Cell death in FAPα+ fibroblasts, CD68+ macrophages, CD31+ endothelial cells, CD3+ T cells, or CD19+ B cells isolated from hyperplastic synovium treated with 0.125 μM RSL3 for 6 h, quantified by SYTOX staining followed by flow cytometry. Cell death (d) and lipid ROS production (e) in circulating fibrocytes from PBMCs and synovial fibroblasts from inflamed joint fluid of RA patients treated with 0.125 μM RSL3 for 18 h (cell death) or 6 h (lipid ROS). ****P < 0.0001, ***P = 0.0001; two-tailed t-test. n = 6 patients. f Representative fluorescent multiplex IHC staining of retained hyperplasia synovium of CIA model mice treated with or without IKE and labeled with anti-F4/80 antibody (red), anti-FAPα antibody (green), and DAPI (blue). Scale bars, 200 μm. g The number of F4/80+ macrophages within the 50 μm radium of FAPα+ fibroblasts in joints of CIA mice. *P < 0.05; ns, P = 0.00878; two-tailed t-test. n = 3 joints. Data are presented as mean ± SD. Source data are provided as a Source data file.
Fig. 3
Fig. 3. Single-cell RNA sequencing reveals fibroblast subsets with distinct ferroptosis sensitivity.
a tSNE plot displaying 4735 CD45− cells from 3 STIA mice separated into 7 major cell types, including fibroblasts (9 clusters), vasculature (2 clusters), pericytes (1 cluster), chondrocytes (1 cluster), muscle cells (1 cluster), osteoblasts (2 clusters), and erythrocytes (2 clusters). b Heatmap showing the expression of high-risk ferroptosis genes in fibroblast clusters in the inflamed STIA joints. c Predicted ferroptosis-sensitive and ferroptosis-resistant fibroblast subsets based on ferroptosis-related genes listed in (b). d Expression of identified conserved marker genes in the ferroptosis-sensitive and ferroptosis-resistant fibroblast subsets. e Left, representative fluorescent multiplex IHC staining and quantification of inflamed joints of CIA mice labeled with anti-Mfap4 (red), anti-Sparcl1 (purple), anti-FAPα (green), and DAPI (blue). Mfap4low, n = 9905 cells from 10 inflamed joints. Mfap4high, n = 3336 cells from 10 inflamed joints. Right, representative fluorescent multiplex IHC staining (top panel) and quantification (bottom panel) of hyperplastic synovium of RA patients labeled with anti-Mfap4 (green), anti-Sparcl1 (red), anti-FAPα (orange), and DAPI (blue). Mfap4low, n = 8222 cells from 10 independent human synovium samples. Mfap4high, n = 6730 cells from 10 independent human synovium samples. Scale bars, 200 μm. ****P < 0.0001; two-tailed t-test. f Quantification of the mean fluorescence intensity (MFI) of Mfap4 (top) and Sparcl1 (bottom) in hyperplastic tissue invading cartilage and in the remaining tissue. ****P < 0.0001; two-tailed t-test. Cartilage invaded area, n = 684 cells from 3 inflamed joints of CIA mice. Non-invaded area, n = 1257 cells from 3 inflamed joints of CIA mice. g Representative immunofluorescent staining of inflamed joints of CIA model mice with or without treatment with a low dose of IKE and labeled with anti-Mfap4, anti-Sparcl1, anti-FAPα, and DAPI. Similar results were observed from 15 joints tested for each group. Scale bars, 100 μm. h Enrichment plots of the GO_Proteinaceous extracellular matrix gene set (left) and KEGG_Glycosaminoglycan biosynthesis gene set (right) among the ferroptosis-sensitive subsets identified by GSEA. The p-value is calculated through permutation tests. i Enrichment plots of the GO_Cell division gene set (left) and KEGG_DNA replication gene set (right) among the ferroptosis-resistant subset identified by GSEA. The p-value is calculated through permutation tests. j Expression of selected mRNA transcripts in the TNF pathway gene set among ferroptosis-sensitive and ferroptosis-resistant subsets. Source data are provided as a Source data file.
Fig. 4
Fig. 4. Single-cell RNA sequencing reveals the crosstalk between macrophages and the fibroblast subsets through TNF signal.
a Top, tSNE plot displaying 56396 cells from the synovium of 5 RA patients separated into 10 major cell types, including fibroblasts, pericytes, macrophages, monocytes, endothelial cells, MSCs, T cells, DCs, and B cells. b identification of 4 distinct fibroblast clusters. c Differences in pathway activities scored by GSVA among the different fibroblast clusters. d Identification of two fibroblast subsets according to the pathway activities in (c). e Functional association networks between signature genes specific to Fib a and Fib b subsets. f Violin plots showing expression levels for ferroptosis-resistant fibroblast marker genes in the identified Fib a and Fib b subsets. g Functional association networks between signature genes specific to Fib b subset. h Heat map showing the relative interaction between macrophages and the fibroblast subsets. i Overview of selected ligand–receptor interactions. The p-value is calculated through permutation tests. P values are indicated by circle size. The means of the average level of interacting molecule 1 in cluster 1 and interacting molecule 2 in cluster 2 are indicated by color. M, macrophages. j Western blotting analysis of p-IκB and IκB expression in fibroblasts treated with TNF and the specific blocking antibodies for TNFR1 or TNFR2 for 48 h. TNFR1 neutralizing antibody (Sino Biological, 10872-R111), TNFR2 neutralizing antibody (Sino Biological, 10417-R00N6). Source data are provided as a Source data file.
Fig. 5
Fig. 5. TNF protects RA fibroblasts from ferroptosis while IL-6 and TGF-β sensitize fibroblasts to ferroptosis.
a, b Relative viability of fibroblasts derived from RA patients and primed with TNF, IL-6, or TGF-β (20 ng/ml) for 72 h, followed by treatment with different concentrations of IKE or RSL3. Cell viability was assayed by measuring cellular ATP levels at 26 h (IKE) (a) or 12 h (RSL3) (b) after treatment. n = 3 biologically independent samples per condition. IC50 values were calculated using nonlinear regression analysis. c, d Cells were treated as indicated for 18 h (IKE, 1 μM) (c) or 4 h (RSL3, 0.125 μM) (d) in the presence of the ferroptosis inhibitor Ferrostatin-1 (Fer1) (1 μM) and lipid ROS accumulation was measured by BODIPY C11 staining coupled with flow cytometry. n = 2 biologically independent samples per condition. ns, P > 0.9999, ****P < 0.0001, ***P = 0.0007; one-way ANOVA followed by multiple comparisons. e, f The relative viability of fibroblasts primed with TNF in the presence of the anti-TNF blocking antibody adalimumab (Ada) for 72 h, followed by treatment with IKE (e) or RSL3 (f). n = 3 biologically independent samples per condition. *P = 0.0183, 0.0216 (left to right), ***P = 0.0003, 0.0002 (left to right); one-way ANOVA followed by multiple comparisons. g Relative viability of fibroblasts primed with IL-6 in the presence of the anti-IL-6 receptor monoclonal antibody tocilizumab (Toci), followed by treatment with IKE or RSL3. n = 3 biologically independent samples per condition. Left, **P = 0.0011, ***P = 0.0008; right, **P = 0.0011, *P = 0.0182; one-way ANOVA. h Relative viability of fibroblasts primed with TGF-β in the presence of the ALK receptor inhibitor SB431542 followed by treatment with IKE or RSL3. n = 3 biologically independent samples per condition. Left, *P = 0.0131, **P = 0.0042; right, **P = 0.0067, **P = 0.0040; one-way ANOVA followed by multiple comparisons. All bar graphs are represented as mean ± SD. Source data are provided as a Source data file.
Fig. 6
Fig. 6. TNF protects RA fibroblasts from the insult of lipid peroxidation and ferroptosis by enhancing the GSH biosynthetic pathway via activation of NF-κB.
a Intracellular GSH in fibroblasts treated with TNF in the presence of adalimumab followed by IKE treatment for 18 h. n = 3 biologically independent samples per condition. *P = 0.0211, 0.0224, 0.0109 (left to right); two-tailed t-test. b Western blotting analysis of GCLC, GCLM, and SLC7A11 expression in fibroblasts at 24 h and 72 h after exposure to TNF and adalimumab. c Western blotting analysis of SLC7A11 in fibroblasts transfected with scramble siRNA or either of two independent siRNAs targeting SLC7A11 (siSLC7A11#1, siSLC7A11#2). d Relative cell viability and cell death of fibroblasts transfected with scramble siRNA or siRNA targeting SLC7A11, primed with TNF and then treated with RSL3. n = 3 biologically independent samples per condition. ****P < 0.0001, ***P = 0.0003, *P = 0.0101; one-way ANOVA followed by multiple comparisons. e Relative viability of fibroblasts from individuals with RA and primed with TNF in the presence of the GCLC inhibitor BSO, followed by treatment with IKE (1 μM) or RSL3 (0.125 μM). ***P = 0.0001, *P = 0.0167; two-tailed t test. f Western blotting analysis of GCLC expression in fibroblasts transfected with scramble siRNA or either of two independent siRNAs targeting GCLC (siGCLC#1, siGCLC#2). g Relative viability and cell death of fibroblasts transfected with scramble siRNA or siRNA targeting GCLC, primed with TNF, and then treated with RSL3. Cell viability was assayed at 12 h, and cell death was measured at 10 h. n = 3 biologically independent samples per condition. Left, ns, P = 0.2174, *P = 0.0314; right, ns, P = 0.7042, **P = 0.0064; one-way ANOVA followed by multiple comparisons. h Western blotting analysis of NF-κB p65 expression in fibroblasts transfected with scramble siRNA or either of two independent siRNAs targeting NF-κB p65 (siNF-κB#1, siNF-κB#2). i Relative viability and cell death of fibroblasts transfected with scramble siRNA or siRNA targeting NF-κB p65, primed with TNF and then treated with RSL3. n = 3 biologically independent samples per condition. Left, ns, P = 0.7675, **P = 0.0079; right, ns, P = 0.9997, **P = 0.0099; one-way ANOVA followed by multiple comparisons. j Western blotting analysis of NF-κB p65, GCLC, GCLM, and SLC7A11 expression in fibroblasts transfected with scramble siRNA or siRNA targeting NF-κB p65 and treated with TNF for 72 h. k Western blotting analysis of NF-κB p65, p-IκB, IκB, GCLC, and GCLM expression in fibroblasts treated with TNF and the IκB kinase inhibitor PS1145 for 72 h. l Relative NF-κB activity in fibroblasts treated with TNF and PS1145. n = 3 biologically independent samples per condition. *P = 0.0263, 0.0123 (left to right); one-way ANOVA followed by multiple comparisons. m Relative viability and cell death in fibroblasts primed with TNF and PS1145 and then treated with RSL3 and ferrostatin-1. n = 3 biologically independent samples per condition. ****P < 0.0001; one-way ANOVA followed by multiple comparisons. n Lipid ROS levels in fibroblasts primed with TNF and PS1145 and then treated with RSL3 and ferrostatin-1. n = 3 biologically independent samples per condition. ****P < 0.0001; one-way ANOVA followed by multiple comparisons. o Intracellular GSH in fibroblasts treated with TNF in the presence of PS1145. n = 3 biologically independent samples per condition. ***P = 0.0001, ****P < 0.0001; one-way ANOVA followed by multiple comparisons. p ROS levels in fibroblasts primed with TNF and NOX inhibitor (NOXi) for 6 or 48 h. n = 2 biologically independent samples per condition. *P = 0.0469; two-tailed t test. q Relative cell death in fibroblasts primed with TNF and NOXi for 48 h and then treated with RSL3. n = 3 biologically independent samples per condition. **P = 0.0083, ***P = 0.0003; two-tailed t test. All bar graphs are presented as mean ± SD. Source data are provided as a Source data file.
Fig. 7
Fig. 7. A TNF antagonist sensitizes RA fibroblasts to ferroptosis induction in CIA model mice.
a Three-dimensional spheroids formed by fibroblasts were primed with TNF and the TNF antagonist etanercept for 48 h before treatment with IKE (4 μM) for an additional 30 h. Dead cells were stained with SYTOX and Hoechst33342 for 1 h. Scale bars, 100 μm. b Relative viability of fibroblasts from patients with RA that were primed with fibroblast supernatant in the presence of the TNF antagonist etanercept for 48 h followed by treatment with IKE (1 μM) and ferrostatin-1 (Fer1, 1 μM) for an additional 26 h. n = 3 biologically independent samples per condition. **P = 0.0092; two-tailed t test. c, d CIA model mice were intraperitoneally injected with 20 mg/kg IKE twice a week and/or 2 mg/kg etanercept twice a week for 5 weeks. Joint inflammation measured by arthritis score (c) (*P = 0.0461, CIA + Etanercept vs CIA + Etanercept+IKE; **P = 0.0132, CIA + IKE vs CIA + Etanercept+IKE; one-way ANOVA followed by multiple comparisons to compare the means at the end point) and paw thickness (d) (*P = 0.0233, CIA + Etanercept vs CIA + Etanercept+IKE; *P = 0.0356, CIA + IKE vs CIA + Etanercept+IKE; one-way ANOVA followed by multiple comparisons to compare the means at the end point). n = 5 mice for each group. e H&E staining images of representative joints in control and day 36 CIA model mice. Scale bars, 200 μm. f Representative micro-CT images of control and CIA mice treated with IKE and/or etanercept. g Toluidine blue O and safranin O staining images of representative joints. Scale bars, 200 μm. h Quantification of histomorphometric analysis of cartilage damage, bone erosion, and pannus formation. Left, *P = 0.0447, **P = 0.0011, ****P < 0.0001; middle, *P = 0.0150, **P = 0.0014; right, *P = 0.0152, **P = 0.0099, ****P < 0.0001; one-way ANOVA followed by multiple comparisons. n = 10 joints for each group. i Representative fluorescent multiplex IHC staining and quantification of joints labeled with anti-F4/80 (red), anti-FAPα (green), and DAPI (blue). Scale bars, 100 μm. Etan, Etanercept. j Immunohistochemical staining of p-NF-κB, GCLM, and GCLC in the joints of CIA model mice with or without etanercept treatment. Scale bars, 25 μm. k Immunohistochemical staining and scoring of PTGS2 and GPX4 expression in the joints of CIA mice. n = 15 joints for each group. *P = 0.0425, ****P < 0.0001; one-way ANOVA followed by multiple comparisons. Scale bars, 50 μm. Data in c and d are presented as mean ± SEM. Other data are presented as mean ± SD. Source data are provided as a Source data file.

Comment in

References

    1. McInnes IB, Schett G. The pathogenesis of rheumatoid arthritis. N. Engl. J. Med. 2011;365:2205–2219. - PubMed
    1. Giannini D, et al. One year in review 2020: pathogenesis of rheumatoid arthritis. Clin. Exp. Rheumatol. 2020;38:387–397. - PubMed
    1. McInnes IB, Schett G. Pathogenetic insights from the treatment of rheumatoid arthritis. Lancet. 2017;389:2328–2337. - PubMed
    1. Silvagni E, et al. One year in review 2020: novelties in the treatment of rheumatoid arthritis. Clin. Exp. Rheumatol. 2020;38:181–194. - PubMed
    1. Burmester GR, Pope JE. Novel treatment strategies in rheumatoid arthritis. Lancet. 2017;389:2338–2348. - PubMed

Publication types

MeSH terms