. 2022 Feb 3;13(1):651.
doi: 10.1038/s41467-022-28272-1.

Mitochondrial protein import determines lifespan through metabolic reprogramming and de novo serine biosynthesis

Affiliations

Mitochondrial protein import determines lifespan through metabolic reprogramming and de novo serine biosynthesis

Eirini Lionaki et al. Nat Commun. .

Abstract

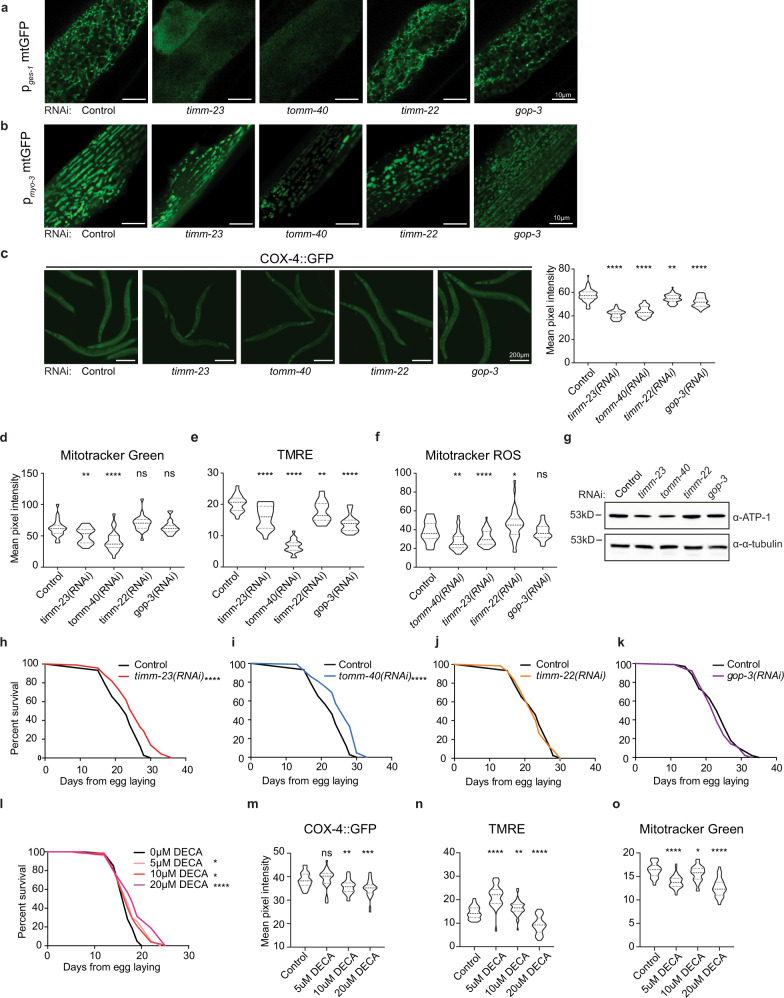
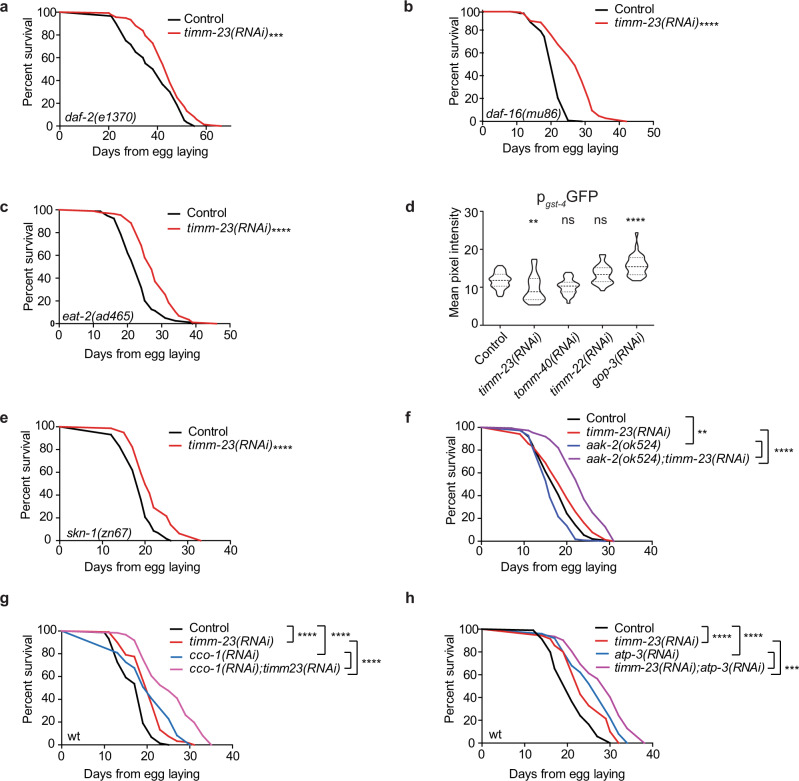
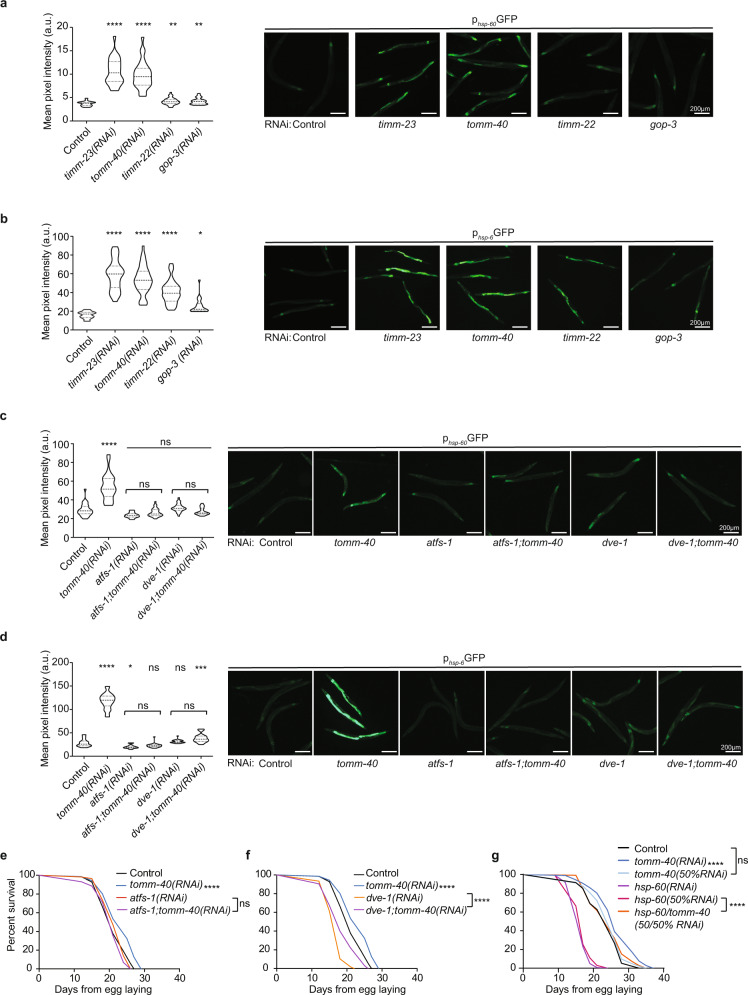
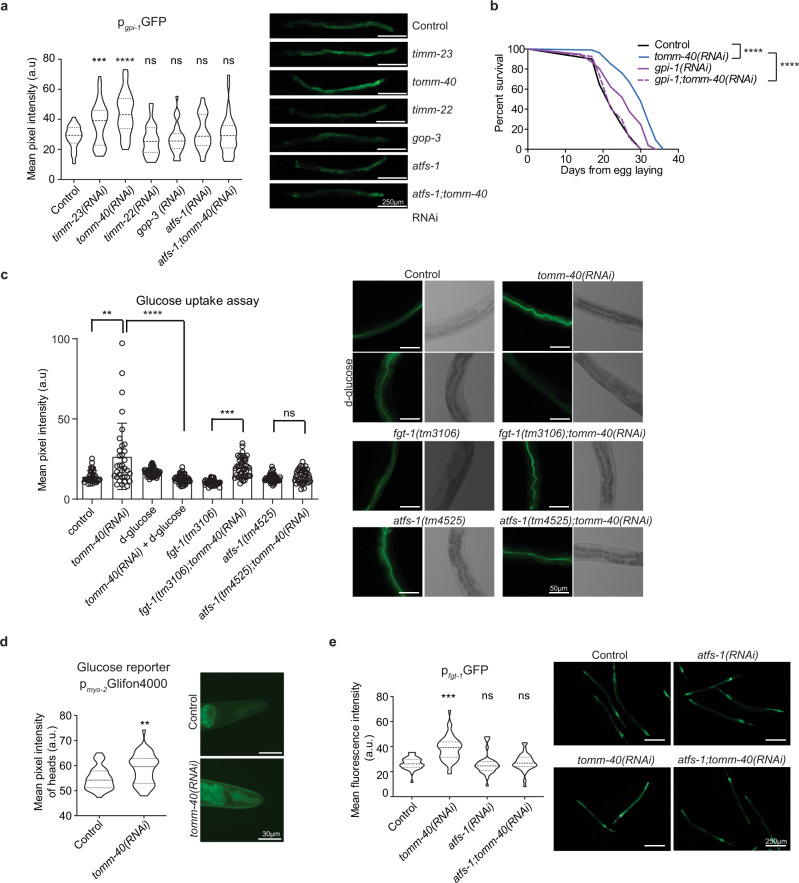
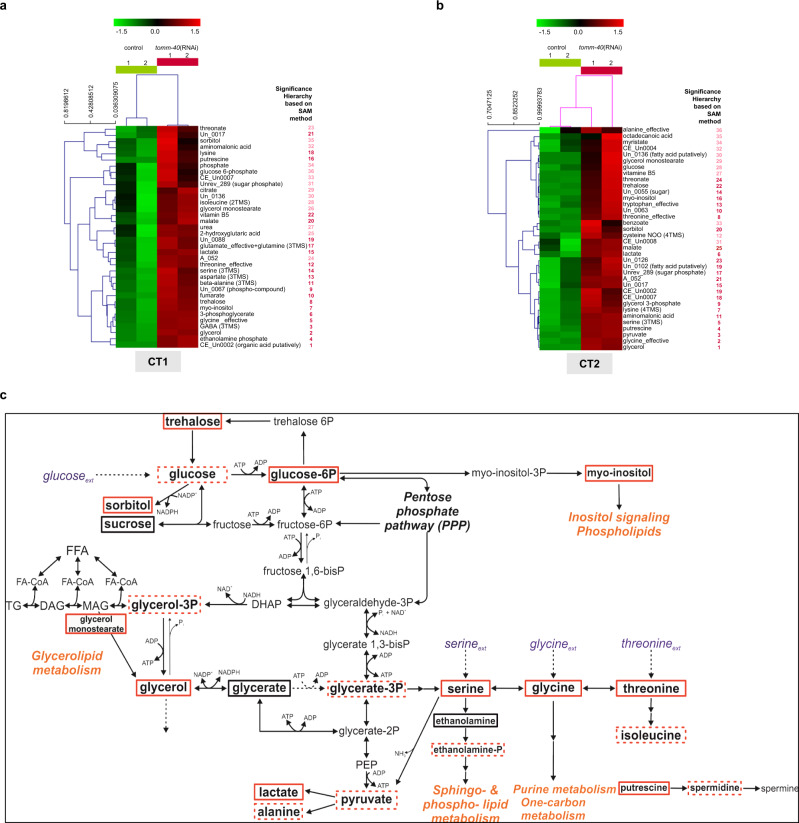
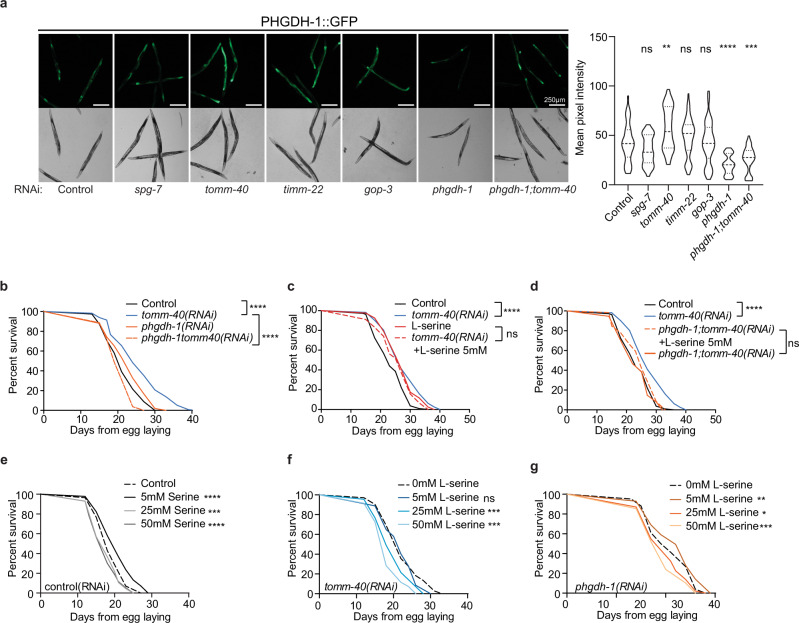
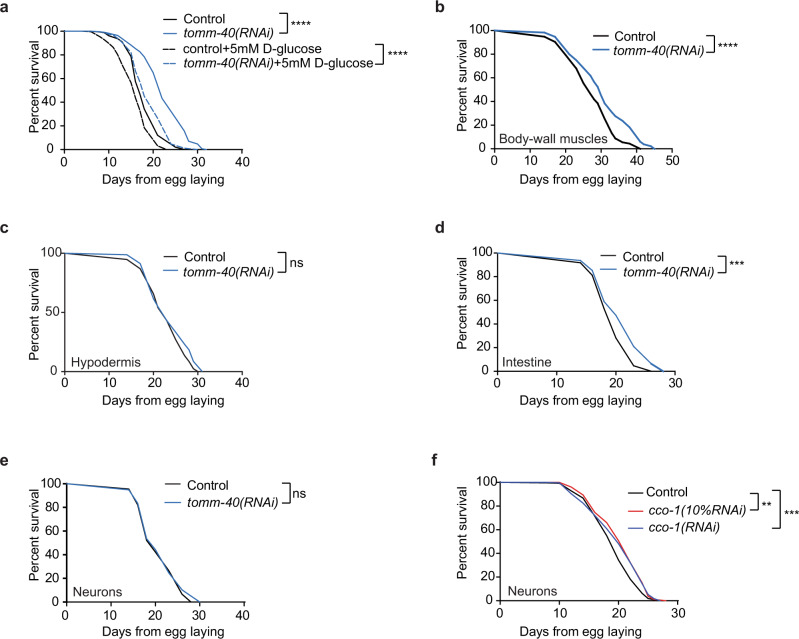
Sustained mitochondrial fitness relies on coordinated biogenesis and clearance. Both processes are regulated by constant targeting of proteins into the organelle. Thus, mitochondrial protein import sets the pace for mitochondrial abundance and function. However, our understanding of mitochondrial protein translocation as a regulator of longevity remains enigmatic. Here, we targeted the main protein import translocases and assessed their contribution to mitochondrial abundance and organismal physiology. We find that reduction in cellular mitochondrial load through mitochondrial protein import system suppression, referred to as MitoMISS, elicits a distinct longevity paradigm. We show that MitoMISS triggers the mitochondrial unfolded protein response, orchestrating an adaptive reprogramming of metabolism. Glycolysis and de novo serine biosynthesis are causatively linked to longevity, whilst mitochondrial chaperone induction is dispensable for lifespan extension. Our findings extent the pro-longevity role of UPRmt and provide insight, relevant to the metabolic alterations that promote or undermine survival and longevity.


Conflict of interest statement

The authors declare no competing interests.

Figures

Fig. 1
Fig. 1. Mitochondrial protein import inhibition elicits morphological and bioenergetic adaptations of the mitochondrial network and regulates lifespan.
a, b Transgenic animals expressing a mitochondrial-targeted GFP in the intestine (a) or body-wall muscles (b), were grown from hatching until day 1 of adulthood on the indicated RNAi expressing bacteria and then monitored by confocal microscopy. n = 3 biologically independent experiments with similar results. c Epifluorescence images depicting total COX-4 endogenous protein levels in animals grown from hatching until day 1 of adulthood on the indicated RNAi expressing bacteria (left panel) and COX-4::GFP fluorescence quantification in violin plot (right panel). n = 3 biologically independent experiments with at least 20 worms per condition. Exact sample size and P values are included in Source Data file. df Day 1 adult animals were stained with Mito Tracker Green, which labels mitochondria independently of membrane potential (d), TMRE, which is a membrane potential-dependent mitochondrial dye (e), and Mito Tracker Red CM-H2Xros, which is a mitochondrial ROS specific dye (f). The violin plots represent the mean fluorescent intensity of at least 20 worms. All treatments were compared to control with two-tailed t-test. n = 3 biologically independent experiments with at least 20 worms. Exact sample size and P values are included in the Source Data file. g Immunoblot analysis of total ATP-1 protein levels in animals grown from hatching until day 1 of adulthood on the indicated RNAi expressing bacteria. n = 2 biologically independent experiments. hk Lifespan curves of control-treated and animals treated with timm-23(RNAi) (h), tomm-40(RNAi) (i), timm-22(RNAi) (j), and gop-3(RNAi) (k) from egg. n = 3 biologically independent experiments. l Lifespan curve of DECA-treated animals in various concentrations from the egg. n = 2 biologically independent experiments. Statistical analysis for lifespan curves was performed with the Log-rank (Mantel–Cox) test; detailed values are shown in Supplementary Table 2. m Quantification of COX-4::GFP fluorescence upon treatment with different DECA concentrations (depicted in violin plot). n Quantification of mitochondrial membrane Δψ (TMRE staining) upon treatment with different DECA concentrations. o Violin plot of quantified Mitotracker Green staining upon treatment with different DECA concentrations. mo n = 2 biologically independent experiments. All treatments were compared to control with two-tailed t-test (**** denotes P < 0.0001, *** denotes P < 0.001, ** denotes P < 0.01 and * denotes P < 0.05) Exact sample size and P values are included in Source Data file. a.u. arbitrary units.
Fig. 2
Fig. 2. MitoMISS represents a longevity paradigm discrete from low-insulin signaling, caloric restriction, and mild mitochondrial stress.
ac Lifespan curves of low-insulin and caloric restriction mutants, daf-16, daf-2, and eat-2, respectively, upon MitoMISS, d Expression levels of gst-4 upon inhibition of mitochondrial protein import components, timm-23, tomm-40, timm-22 and gop-3 (Fluorescence intensities are depicted in violin plot). One-way ANOVA, with Dunnett’s multiple comparisons test. e, f Lifespan curves of skn-1 and aak-2 mutants involved in mitohormesis, detoxification, and nutrient-sensing, respectively, upon MitoMISS. g, h Lifespan curves of cco-1 and atp-3 respiration-deficient animals upon MitoMISS. Statistical analysis for lifespan curves was performed with the Log-rank (Mantel–Cox) test; detailed values are shown in Supplementary Table 2 (**** denotes P < 0.0001, *** denotes P < 0.001, ** denotes P < 0.01 and * denotes P < 0.05).
Fig. 3
Fig. 3. MitoMISS longevity depends on ATFS-1 and is independent of UPRmt-induced chaperones.
a, b Expression levels of canonical UPRmt specific-transcriptional reporters hsp-60 (a) and hsp-6 (b) were monitored upon inhibition of mitochondrial protein import components, timm-23, tomm-40, timm-22 and gop-3. n = 3 biologically independent experiments with at least 20 worms per condition. One-way ANOVA with Dunnett’s multiple comparison test. Exact sample size and P values are included in the Source Data file. c, d Expression levels of hsp-60 (c) and hsp-6 (d) upon MitoMISS and in the absence of ATFS-1 or DVE-1. n = 3 biologically independent experiments with at least 20 worms per condition. One-way ANOVA with Tukey’s multiple comparison test. Exact sample size and P values are included in the Source Data file. a.u. arbitrary units. e, f Lifespan curves upon MitoMISS in the absence and presence of ATFS-1 (e) and DVE-1 (f). g Lifespan curves upon MitoMISS in the absence and presence of HSP-60. n = 2 biologically independent experiments. Lifespan curves were statistically analyzed with the Log-rank (Mantel–Cox) test; detailed values are shown in Supplementary Table 2. (**** denotes P < 0.0001, *** denotes P < 0.001,** denotes P < 0.01 and * denotes P < 0.05).
Fig. 4
Fig. 4. MitoMISS-induced longevity requires both glucose uptake and glycolysis in an ATFS-1-dependent manner.
a Expression levels of the glycolysis transcriptional reporter, gpi-1, upon inhibition of the mitochondrial protein import components, timm-23, tomm-40, timm-22 and gop-3. n = 3 biologically independent experiments with at least 20 worms per condition. All conditions were compared to control with two-tailed t-test. b Lifespan curves of wild type animals in gpi-1 deficient animals and upon MitoMISS. n = 3 biologically independent experiments. Lifespan curves were statistically analyzed with the Log-rank (Mantel–Cox) test. c Glucose uptake assay, using the fluorescent glucose analog 2-NBDG, upon MitoMISS. n = 3 biologically independent experiments with at least 20 worms per condition. Two-tailed t-test was used for comparisons. Data presented as mean ± SEM. d In vivo imaging of glucose levels of animals expressing Glifon4000 under the myo-2 promoter upon MitoMISS. Fluorescence data depicted in violin plot. n = 2 biologically independent experiment. Comparison with two-tailed t-test. e Expression levels of the transcriptional reporter of glucose transporter fgt-1 upon MitoMISS. Data depicted in violin plot. Fluorescent intensity of each sample was compared to the control with a two-tailed t-test. (**** denotes P < 0.0001, *** denotes P < 0.001,** denotes P < 0.01 and * denotes P < 0.05). Exact sample size and P values are included in the Source Data file. a.u. arbitrary units.
Fig. 5
Fig. 5. Metabolic profiling of control and MitoMISS animals.
a, b The hierarchical tree of the standardized abundance profiles of the positively significant metabolites in tomm-40 RNAi worms compared to the controls based on Euclidean distance in CT1 (a) and CT2 (b). The color-code shows in green and red color, respectively, the abundances of a metabolite, if below or above its mean abundance in all profiles of the particular collection time data set (Supplementary Data File 1). The numbers next to each metabolite name indicate the order of significance of the metabolites based on the SAM method (see SAM curves in Supplementary Figs. 7c and 8c and full significant metabolite list in Supplementary Table 3). The red-colored numbers depict the significant metabolites identified at a significance threshold corresponding to FDR-median equal to zero and the pink-colored numbers depict the additional metabolites identified at the most lenient significance threshold possible for this data set, still corresponding at an FDR-median smaller than 1.5%. c The differences in the worm metabolic network from glucose to lactate in the presence and absence of tomm-40. All positively significant metabolites in both CT1 and CT2 as shown in Fig. 5a, b and Supplementary Table 3 are shown in red boxes. Profiled metabolites with no significant change in their abundance are shown in black boxes; the metabolites identified as positively significant in one of the two independent experiments, are shown in dashed red boxes.
Fig. 6
Fig. 6. De novo serine biosynthesis is required for longevity upon MitoMISS.
a Epifluorescence images showing the total protein levels of PHGDH-1 upon spg-7, tomm-40, timm-22, gop-3, phgdh-1, and phgdh-1;tomm-40 genetic inhibition (left panel) and the corresponding fluorescence quantification depicted with violin plots (right panel). n = 3 biologically independent experiments with at least 20 worms per condition one-way ANOVA with Tukey’s multiple comparison test. Exact sample size and P values are included in the Source Data file. (**** denotes P < 0.0001, *** denotes P < 0.001, ** denotes P < 0.01 and * denotes P < 0.05). a.u. arbitrary units. b Lifespan analysis of MitoMISS animals upon inhibition of de novo serine biosynthesis. c Lifespan analysis of MitoMISS animals with or without of l-serine supplementation. d l-serine supplementation does not rescue the inhibition of de novo serine biosynthesis upon MitoMISS. eg Lifespan analysis of wild type animals (e), MitoMISS animals (f) and animals with inhibited de novo serine biosynthesis (g) upon different concentrations of exogenous serine supplementation. n = 2 biologically independent experiments. Curves were compared with the Log-rank (Mantel–Cox) test (*** denotes P < 0.0001, ** denotes P < 0.001, * denotes P < 0.01, ns denotes not significant); detailed values are shown in Supplementary Table 2.
Fig. 7
Fig. 7. MitoMISS ameliorates glucose toxicity with regard to organismal lifespan.
a Lifespan analysis of wild type animals upon MitoMISS with and without 5mM D-glucose supplementation. be Lifespan analysis of tissue-specific MitoMISS application. f Neuron-specific genetic inhibition of cco-1 100% and 10% diluted. Survival curves were compared with the Log-rank (Mantel–Cox) test (*** denotes P < 0.0001, ** denotes P < 0.001); detailed values are shown in Supplementary Table 2.

Comment in

Similar articles

Cited by

References

    1. Sun N, Youle RJ, Finkel T. The mitochondrial basis of aging. Mol. Cell. 2016;61:654–666. - PMC - PubMed
    1. Luo C, et al. Mitochondrial accumulation under oxidative stress is due to defects in autophagy. J. Cell Biochem. 2013;114:212–219. - PubMed
    1. Silva DF, et al. Bioenergetic flux, mitochondrial mass and mitochondrial morphology dynamics in AD and MCI cybrid cell lines. Hum. Mol. Genet. 2013;22:3931–3946. - PMC - PubMed
    1. Sun X, et al. Increased mtDNA copy number promotes cancer progression by enhancing mitochondrial oxidative phosphorylation in microsatellite-stable colorectal cancer. Signal Transduct. Target Ther. 2018;3:8. - PMC - PubMed
    1. Wredenberg A, et al. Increased mitochondrial mass in mitochondrial myopathy mice. Proc. Natl Acad. Sci. USA. 2002;99:15066–15071. - PMC - PubMed

Publication types

MeSH terms

Substances