. 2022 Feb 3;13(1):679.
doi: 10.1038/s41467-022-28315-7.

Myeloid cell interferon responses correlate with clearance of SARS-CoV-2

Affiliations

Myeloid cell interferon responses correlate with clearance of SARS-CoV-2

Dhiraj K Singh et al. Nat Commun. .

Abstract

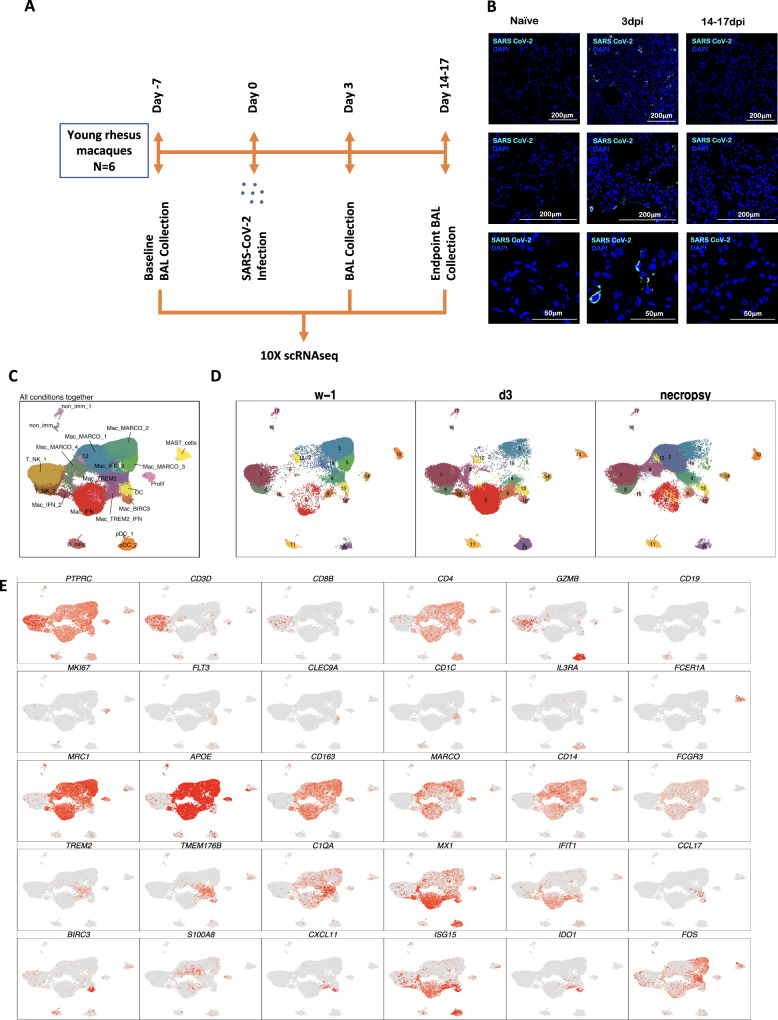
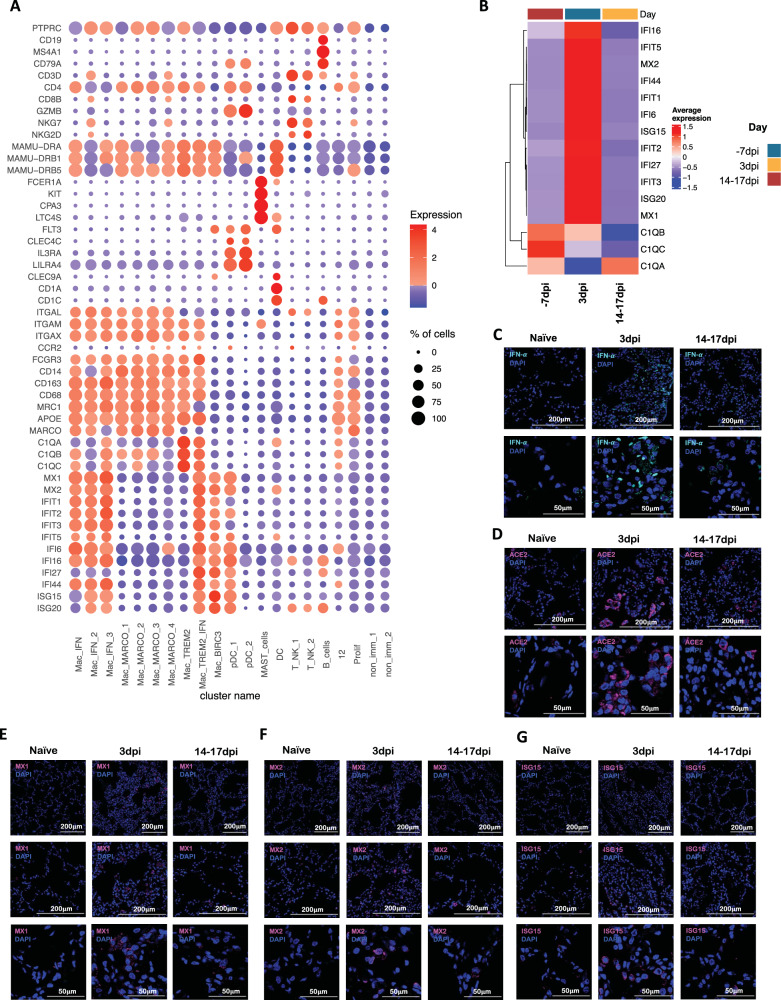
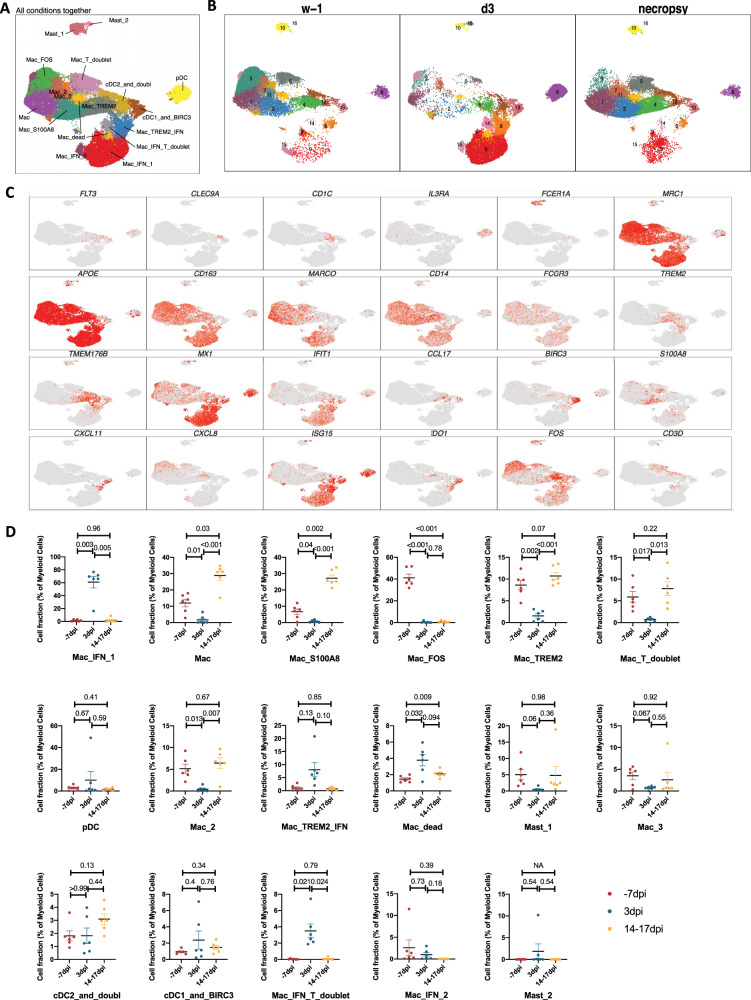
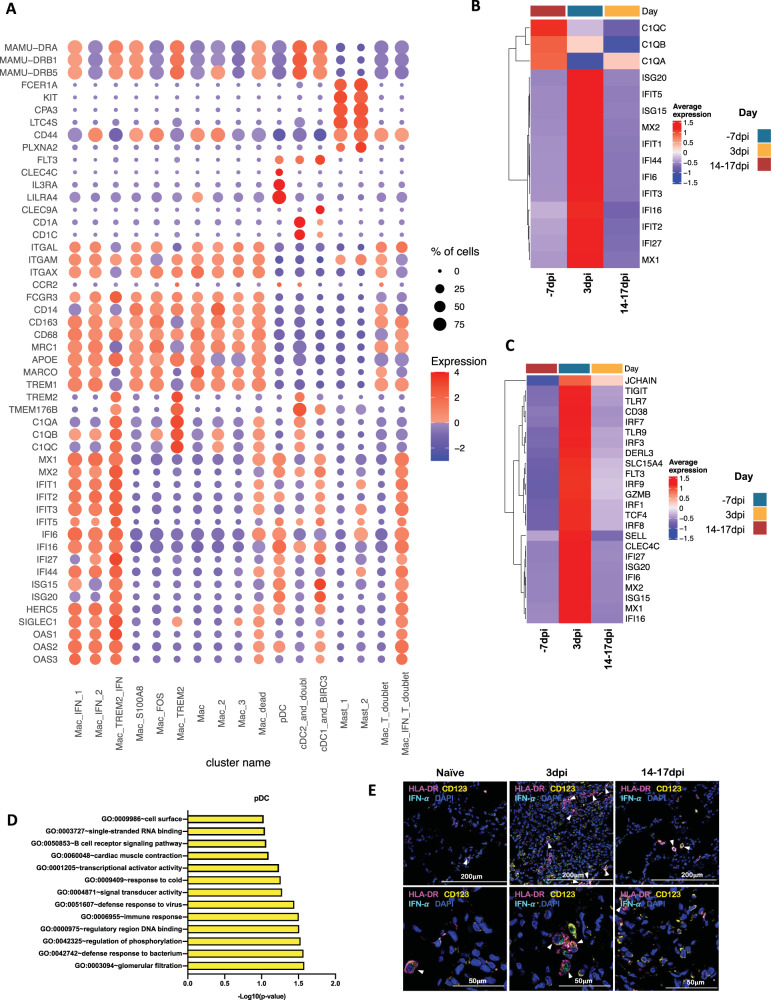
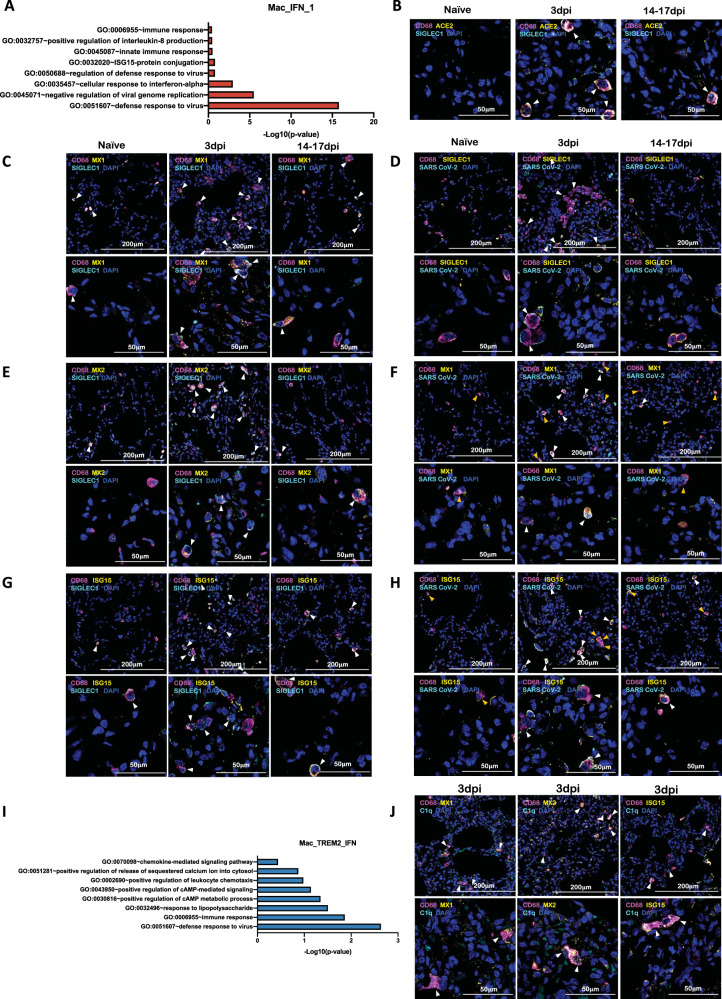
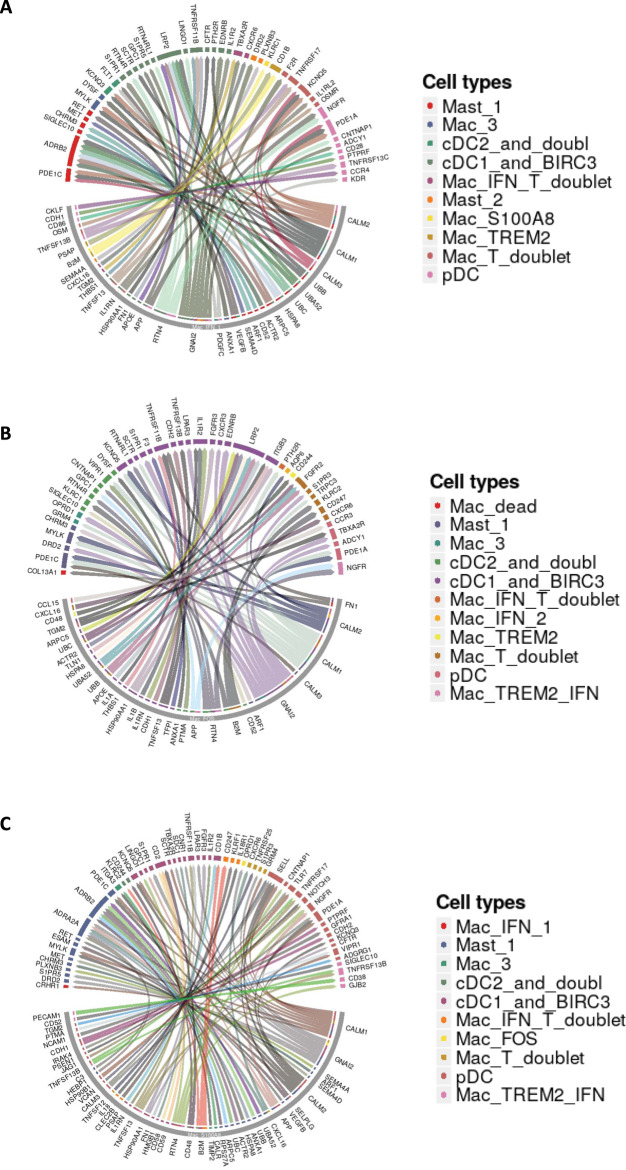
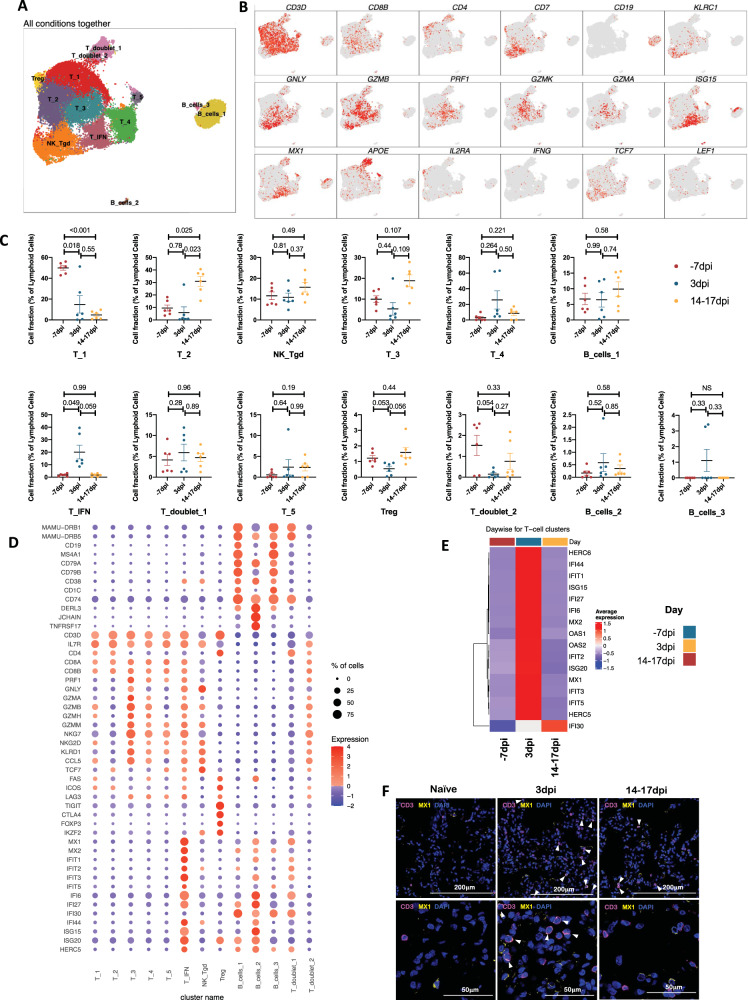
Emergence of mutant SARS-CoV-2 strains associated with an increased risk of COVID-19-related death necessitates better understanding of the early viral dynamics, host responses and immunopathology. Single cell RNAseq (scRNAseq) allows for the study of individual cells, uncovering heterogeneous and variable responses to environment, infection and inflammation. While studies have reported immune profiling using scRNAseq in terminal human COVID-19 patients, performing longitudinal immune cell dynamics in humans is challenging. Macaques are a suitable model of SARS-CoV-2 infection. Our longitudinal scRNAseq of bronchoalveolar lavage (BAL) cell suspensions from young rhesus macaques infected with SARS-CoV-2 (n = 6) demonstrates dynamic changes in transcriptional landscape 3 days post- SARS-CoV-2-infection (3dpi; peak viremia), relative to 14-17dpi (recovery phase) and pre-infection (baseline) showing accumulation of distinct populations of both macrophages and T-lymphocytes expressing strong interferon-driven inflammatory gene signature at 3dpi. Type I interferon response is induced in the plasmacytoid dendritic cells with appearance of a distinct HLADR+CD68+CD163+SIGLEC1+ macrophage population exhibiting higher angiotensin-converting enzyme 2 (ACE2) expression. These macrophages are significantly enriched in the lungs of macaques at 3dpi and harbor SARS-CoV-2 while expressing a strong interferon-driven innate anti-viral gene signature. The accumulation of these responses correlated with decline in viremia and recovery.


Conflict of interest statement

The authors declare competing interests.

Figures

Fig. 1
Fig. 1. Immune landscape of BAL in SARS-CoV-2 infected macaques.
Study outline of scRNAseq analysis of BAL cells from rhesus macaques infected with SARS-CoV-2. BAL single-cell suspensions from 6 young rhesus macaques infected with SARS-CoV-2 from pre-infection (-7dpi), 3dpi and endpoint (14–17dpi) were subjected to scRNAseq (A). Immunofluorescence confocal images of the lungs stained with nucleocapsid (N)-specific antibodies (turquoise) and 4,6-diamidino-2-phenylindole (DAPI) (blue). Shown are the images at 10x, 20x, and 63x magnification from naive lungs (uninfected) as well as lungs infected with SARS-CoV-2 at Day 3 and Day 14 post-infection (B). UMAP plots of cells from all scRNAseq samples together, colored according to cluster classification (C) or respective timepoints (D). E UMAP plots with the expression of markers, characterizing main immune populations. n = 6.
Fig. 2
Fig. 2. SARS-CoV-2 infection induces IFN responsive gene signature in rhesus macaques.
A Bubble plot showing the fold change of genes in identified cell clusters and the fraction of cells expressing the gene of interest. B Heatmap of key interferon responsive genes at different timepoints. Confocal images validating in vivo expression of IFN-α (turquoise) (C), ACE2 (magenta) (D), MX1 (magenta) (E), MX2 (magenta) (F) and ISG15 (magenta) (G) with DAPI (blue) in the lung sections of Naive rhesus macaques and SARS-CoV-2 infected lungs at 3dpi and 14–17 dpi.
Fig. 3
Fig. 3. Myeloid single-cell landscape in SARS-CoV-2 infected macaques.
BAL myeloid cell dynamics in macaques infected with SARS-CoV-2 by scRNA-seq demonstrate the presence of IFN response in pDCs and IFN-responsive macrophage compartments. A UMAP plot of myeloid cells from all scRNA-seq samples together, colored according to (A) cluster classification or respective (B) timepoints. C UMAP plots with the expression of markers, characterizing main myeloid populations in macaques. D Cell proportion of each cluster per condition. n = 6 macaques. Data are presented as mean ± standard error of the mean (SEM). Source data are provided as a source data file.
Fig. 4
Fig. 4. Macrophages and pDCs are the dominant cells driving Type I IFN response in the lungs of SARS-CoV-2 infected macaques.
A Bubble plot showing the fold change of genes in identified myeloid cell clusters and the fraction of cells expressing the gene of interest. B Heatmap of key interferon responsive genes at different timepoints in macrophage clusters. C Heatmap of key interferon responsive genes at different timepoints in plasmacytoid dendritic cells sub-clusters. D GO pathways enriched in upregulated genes in pDCs. E Multilabel immunofluorescence confocal images validating in vivo expression of IFN-α (turquoise) in pDCs marked by HLA-DR (magenta) and CD123 (yellow) in Naive Rhesus macaque lungs as well as at Day 3 and Day 14 post-infection with SARS CoV-2.
Fig. 5
Fig. 5. IFN induced viral defense response in lung macrophages of SARS-CoV-2 infected macaques.
A GO pathways enriched in upregulated genes in Mac_IFN_1 subcluster. Multilabel immunofluorescence confocal images validating in vivo expression of (B) ACE2 (yellow) and SIGLEC1 (turquoise), and (C) MX1 (yellow) and SIGLEC1 (turquoise) in macrophages (magenta), (D) CD68 (magenta) and SIGLEC1 (yellow) positive macrophages harboring SARS CoV-2 (turquoise), (E) Macrophages (magenta) expressing MX2 (yellow) and SIGLEC1 (turquoise), (F) MX1 (yellow) positive macrophages (magenta) with SARS CoV-2 (turquoise), (G) Macrophages (magenta) expressing ISG15 (yellow) and SIGLEC1 (turquoise), (H) SARS CoV-2 (turquoise) harbored in ISG15 (yellow) expressing macrophages (magenta) in lungs of Naive and 3 and 14 days post-infection of SARS CoV-2 infected macaques. Nuclei stained with DAPI are shown in blue. White arrows represent macrophages expressing ACE2 and SIGLEC1 in (B); MX1 and SIGLEC1 in (C); MX2 and SIGLEC1 in (E); ISG15 and SIGLEC1 in (G). In (D), (F), and (H), white arrows mark the presence of SARS CoV-2 in macrophages expressing SIGLEC1, MX1, and ISG15 respectively; whereas, orange arrows are used to mark SIGLEC1, MX1, and ISG15 expressing macrophages with no SARS CoV-2. I GO pathways enriched in upregulated genes in Mac_TREM2_IFN subcluster. J Multilabel confocal immunofluorescence images validating in vivo expression of MX1, MX2, and ISG15 (shown in yellow) in TREM2 macrophages in lungs of SARS-CoV-2 infected macaques at 3dpi.
Fig. 6
Fig. 6. Macrophage interactome model in SARS-CoV-2 infected lungs.
Macrophage-Immunocytes interactome. Circos plots showing the ligand-receptor interactions between the most abundant macrophage populations and different immune cells in the three conditions studies. A Circos plot depicting the interaction of Mac_IFN_1 with ambient immunocytes based on ligand-receptor transcript reads at 3 dpi. B Circos plot depicting the interaction of Mac_S100A8 with ambient immunocytes based on ligand-receptor transcript reads at 14–17 dpi. C Circos plot depicting the interaction of Mac_FOS with ambient immunocytes based on ligand-receptor transcript reads at −7 dpi.
Fig. 7
Fig. 7. Lymphoid single-cell landscape in SARS-CoV-2 infected macaques.
BAL lymphoid cell dynamics in macaques infected with SARS-CoV-2 by scRNA-seq demonstrate the presence of IFN responsive T cells. A UMAP plot of lymphoid cells from all scRNA-seq samples together, colored according to cluster classification. B UMAP plots with the expression of markers, characterizing main lymphoid populations in macaques. C Cell proportion of each cluster per condition. n = 6 macaques. Data are presented as mean ±  standard error of the mean (SEM). Source data are provided as a source data file. D Bubble plot showing the fold change of genes in identified lymphoid cell clusters and the fraction of cells expressing the gene of interest. E Heatmap of key interferon responsive genes at different timepoints in lymphoid sub-clusters. F Multilabel immunofluorescence confocal images validating in vivo expression of MX1 (yellow) in T-cells marked by CD3 (magenta) and nuclei (blue) in Naive as well as SARS CoV-2 infected lungs at 3 dpi and 14–17 dpi. White arrows represent T cells expressing MX1.

Update of

References

    1. Monaco G, et al. RNA-Seq signatures normalized by mRNA abundance allow absolute deconvolution of human immune cell types. Cell Rep. 2019;26:1627–1640.e1627. - PMC - PubMed
    1. Wilson JA, et al. RNA-Seq analysis of chikungunya virus infection and identification of granzyme A as a major promoter of arthritic inflammation. PLoS Pathog. 2017;13:e1006155. - PMC - PubMed
    1. Xiong Y, et al. Transcriptomic characteristics of bronchoalveolar lavage fluid and peripheral blood mononuclear cells in COVID-19 patients. Emerg. Microbes Infect. 2020;9:761–770. - PMC - PubMed
    1. Singh DK, et al. Responses to acute infection with SARS-CoV-2 in the lungs of rhesus macaques, baboons and marmosets. Nat. Microbiol. 2021;6:73–86. - PMC - PubMed
    1. Baum A, et al. REGN-COV2 antibodies prevent and treat SARS-CoV-2 infection in rhesus macaques and hamsters. Science. 2020;370:1110–1115. - PMC - PubMed

Publication types