. 2022 Feb 3;12(1):1885.
doi: 10.1038/s41598-022-05640-x.

Simple, sensitive, specific self-sampling assay secures SARS-CoV-2 antibody signals in sero-prevalence and post-vaccine studies

Affiliations

Simple, sensitive, specific self-sampling assay secures SARS-CoV-2 antibody signals in sero-prevalence and post-vaccine studies

Maryam Khan et al. Sci Rep. .

Abstract

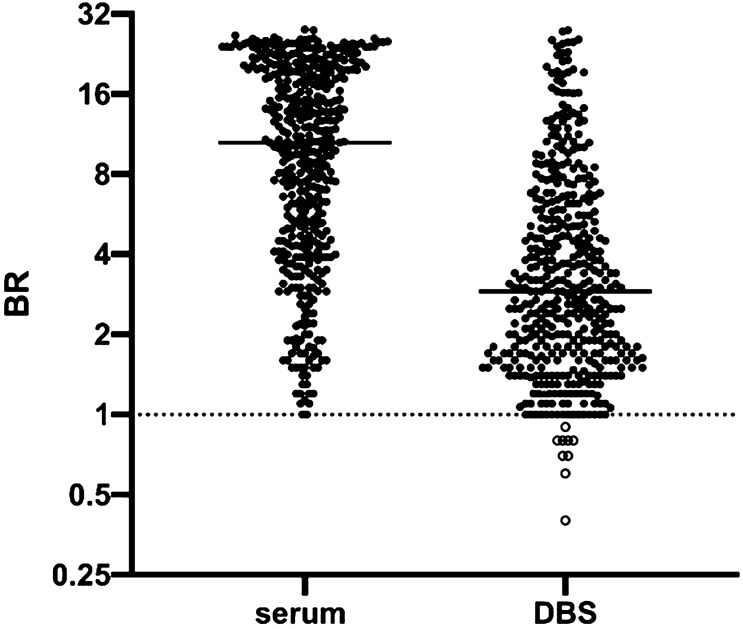
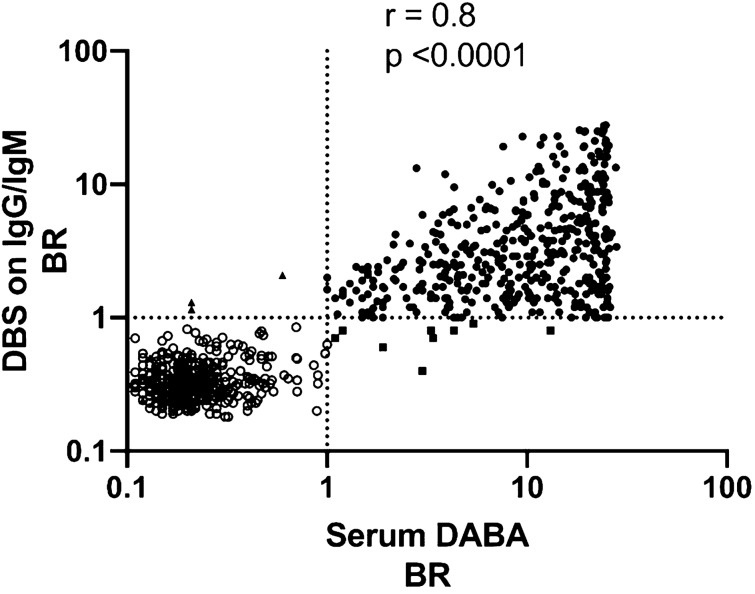
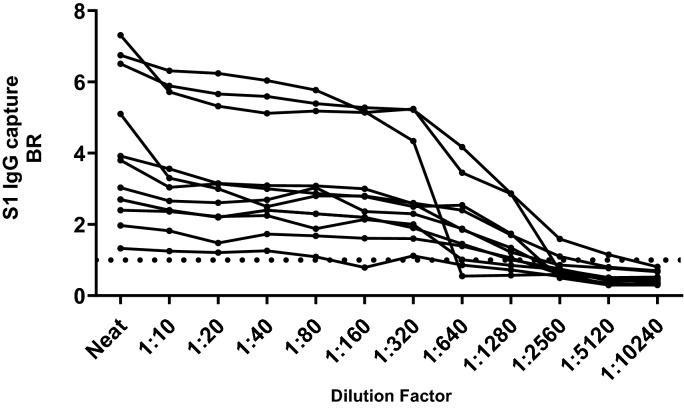
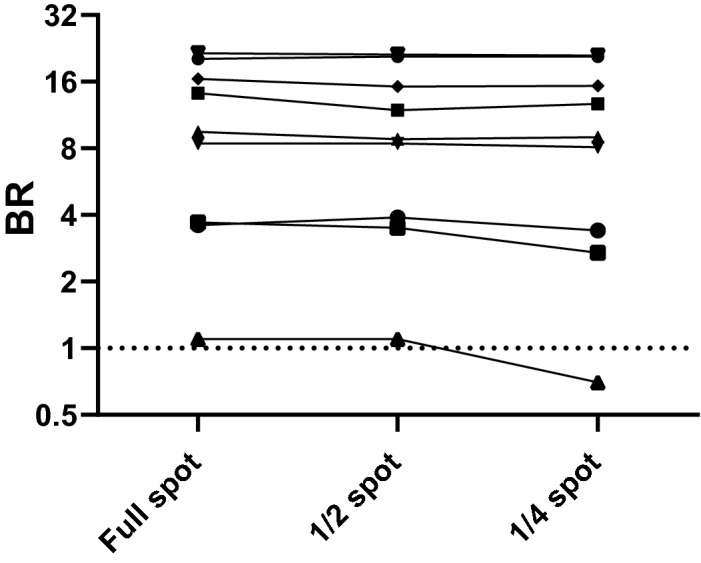
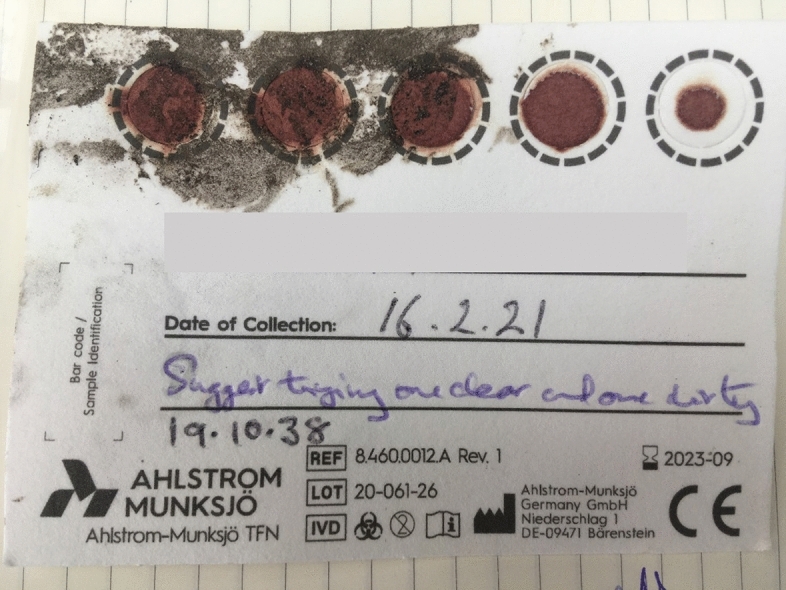
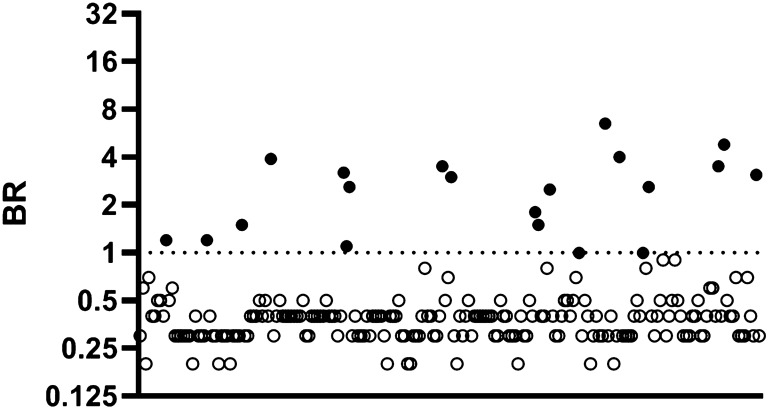
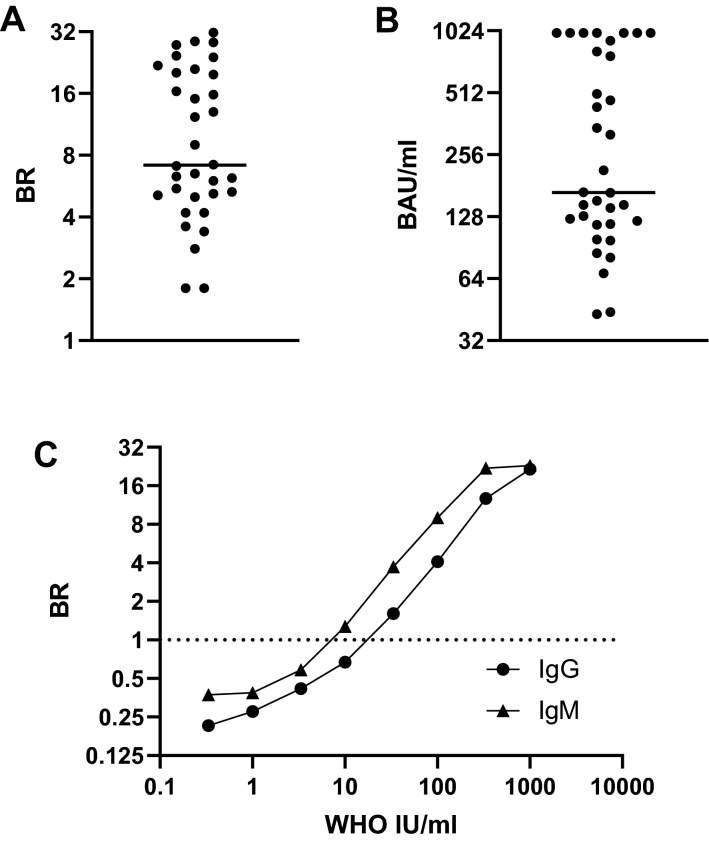
At-home sampling is key to large scale seroprevalence studies. Dried blood spot (DBS) self-sampling removes the need for medical personnel for specimen collection but facilitates specimen referral to an appropriately accredited laboratory for accurate sample analysis. To establish a highly sensitive and specific antibody assay that would facilitate self-sampling for prevalence and vaccine-response studies. Paired sera and DBS eluates collected from 439 sero-positive, 382 sero-negative individuals and DBS from 34 vaccine recipients were assayed by capture ELISAs for IgG and IgM antibody to SARS-CoV-2. IgG and IgM combined on DBS eluates achieved a diagnostic sensitivity of 97.9% (95%CI 96.6 to 99.3) and a specificity of 99.2% (95% CI 98.4 to 100) compared to serum, displaying limits of detection equivalent to 23 and 10 WHO IU/ml, respectively. A strong correlation (r = 0.81) was observed between serum and DBS reactivities. Reactivity remained stable with samples deliberately rendered inadequate, (p = 0.234) and when samples were accidentally damaged or 'invalid'. All vaccine recipients were sero-positive. This assay provides a secure method for self-sampling by DBS with a sensitivity comparable to serum. The feasibility of DBS testing in sero-prevalence studies and in monitoring post-vaccine responses was confirmed, offering a robust and reliable tool for serological monitoring at a population level.


Conflict of interest statement

The authors (CR, PC, MOM, RST) declare an in interest in the Imperial Hybrid DABA. Patent file IRN.FID4816059 and the S1 Capture Assay Patent Filing 2014047.1. The remaining authors have no conflicts of interest to declare.

Figures

Figure 1
Figure 1
Comparison of Binding Ratios (BR) determined in Hybrid DABA assay using serum and Ig S1 capture assays using DBS eluates. Samples (serum) and DBS (eluates) from 439 sero-positive persons were assayed using the hybrid DABA and S1 IgG and IgM capture assays, respectively. Horizontal line indicates the mean. Binding ratios (BR) from both assays are plotted on a log2 scale with samples from sero-positive individuals shown with filled circles and those from sero-negative individuals shown with empty circles. The dotted line represents the assay cut-off. For 27 individuals, who were IgG negative but IgM positive on DBS eluate, IgM BR are used. Otherwise, IgG BRs are shown.
Figure 2
Figure 2
Correlation of BRs from S1 Ig assays using DBS eluates and Hybrid DABA assay using serum. Serum samples and paired DBS eluates from 439 sero-positive and 382 sero-negative individuals were assayed using hybrid DABA and the S1 IgG and IgM capture assays, respectively. BRs from DABA serum assay were plotted against those generated from the DBS eluate on a Log10 scale. Samples from sero-positive individuals are shown with filled circles and those from sero-negative individuals with empty circles. Correlation of the DBS and serum BRs with each assay is shown graphically along with the coefficient of correlation, r, and the significance, p, generated using PRISM software. The dotted lines represent the cut-off for each assay. Discordant samples, namely those that were DABA-positive and DBS-negative (n = 9) are represented by a square and samples which were DABA-negative and DBS-positive (n = 3) represented by a triangle.
Figure 3
Figure 3
Analytical stability of DBS on IgG S1 capture assay. Eluates from eleven sero-positive DBS were serially diluted two-fold in elution buffer and the BRs determined on the IgG S1 capture assay. Each line with data points represents a different individual. The arrow indicates the highest dilution at which reactivity is maintained. The dotted line represents the assay cut-off.
Figure 4
Figure 4
Reactivity of eluates on IgG S1 from full and partial DBS samples. DBS samples from 20 different patients were extracted as full, half and quarter spots as described in the methods. The reactivity of the three resulting eluates from each individual was tested in the IgG S1capture. The resulting reactivity (BRs) of the full, half and quarter spot eluates is shown for each individual, each line representing a different individual. The dotted line indicates the assay cut-off.
Figure 5
Figure 5
Impact of a wet and muddy canine foot upon a DBS from a recipient of a first dose of Pfizer vaccine. This exemplifies the damage accidently inflicted by a dog’s muddy paws on a DBS sample which had been laid out to dry. Eluates from the imprinted spots produced a valid strong positive Ig capture result.
Figure 6
Figure 6
Seroprevalence determined by self-sampling and DBS analysis. DBS samples were obtained via self-sampling from 215 individuals employed in a London-based law firm. The BRs for S1 IgG alone are plotted on a log2 scale. Samples from 20 sero-positive individuals are shown with filled circles and those from sero-negative individuals with empty circles. The dotted line indicates the assay cut-off.
Figure 7
Figure 7
Measuring post-vaccine antibody responses using DBS sampling and the WHO International standard (NIBSC 20/136). DBS eluates obtained from 34 individuals who were ≥ 14 days post-immunisation are all reactive, demonstrating effectiveness at detecting vaccine-induced antibody responses. Binding Ratios (A) and inferred WHO International Units (B) from S1 IgG capture are displayed on a Log2 scale, the line is the median, BR of 1 and WHO32 IU are the cut off values. (C) The relationship between S1 IgM and IgG capture Binding Ratios and WHO IU/ml, with BR displayed on Log2 scale and IU/ml on a Log10 scale. IgG IU/ml are shown with a circle and IgM IU/ml are shown with a triangle.

References

    1. Kumleben N, et al. Test, test, test for COVID-19 antibodies: The importance of sensitivity, specificity and predictive powers. Public Health. 2020;185:88–90. doi: 10.1016/j.puhe.2020.06.006. - DOI - PMC - PubMed
    1. Deeks SG, Walker BD. Human immunodeficiency virus controllers: Mechanisms of durable virus control in the absence of antiretroviral therapy. Immunity. 2007;27(3):406–416. doi: 10.1016/j.immuni.2007.08.010. - DOI - PubMed
    1. Alter G, Seder R. The power of antibody-based surveillance. N. Engl. J. Med. 2020;383(18):1782–1784. doi: 10.1056/nejme2028079. - DOI - PMC - PubMed
    1. Tang YW, Schmitz JE, Persing DH, Stratton CW. Laboratory diagnosis of COVID-19: Current issues and challenges. J. Clin. Microbiol. 2020 doi: 10.1128/JCM.00512-20. - DOI - PMC - PubMed
    1. Ward, H. et al. Antibody prevalence for SARS-CoV-2 in England following first peak of the pandemic: REACT2 study in 100,000 adults. medRxiv. 10.1101/2020.08.12.20173690 (2020).

Publication types