. 2022 Feb 3;12(1):1911.
doi: 10.1038/s41598-022-05841-4.

MACSima imaging cyclic staining (MICS) technology reveals combinatorial target pairs for CAR T cell treatment of solid tumors

Affiliations

MACSima imaging cyclic staining (MICS) technology reveals combinatorial target pairs for CAR T cell treatment of solid tumors

Ali Kinkhabwala et al. Sci Rep. .

Abstract

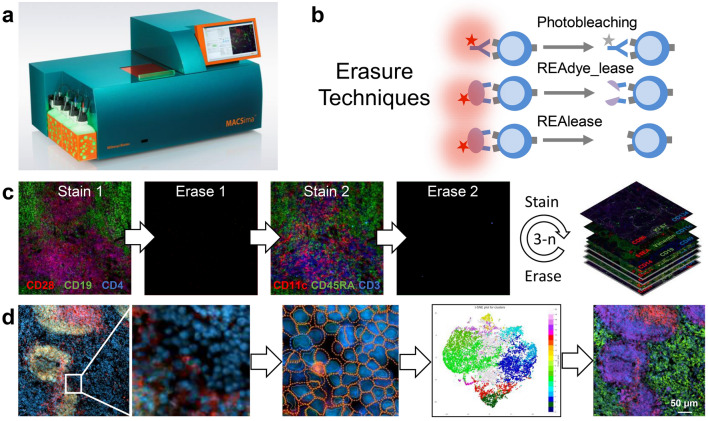
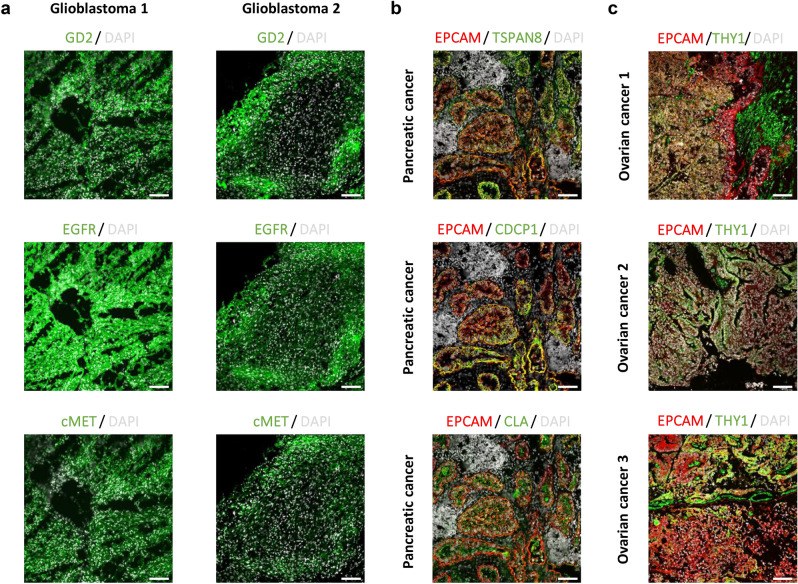
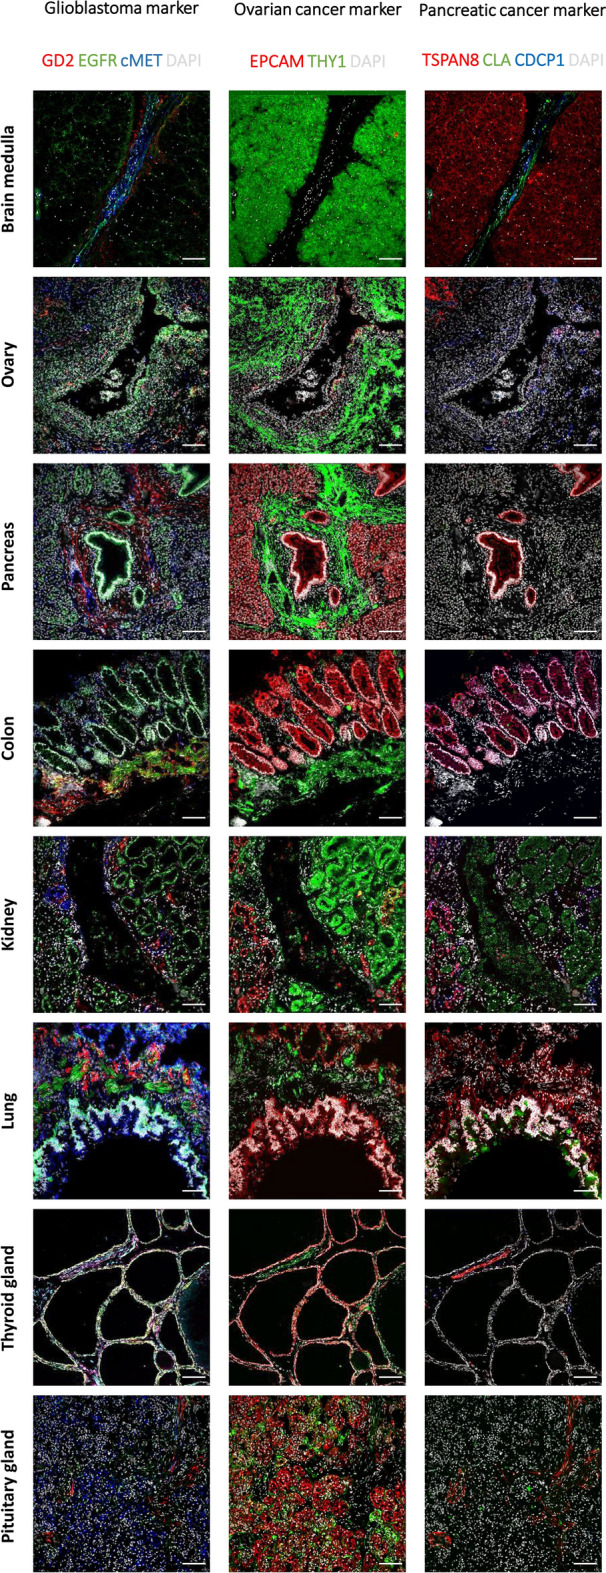
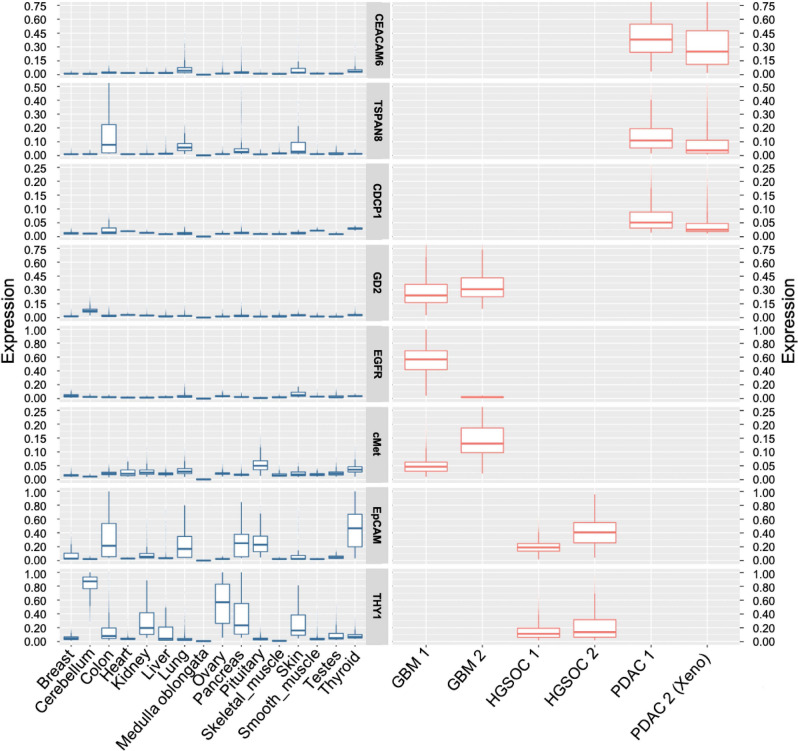
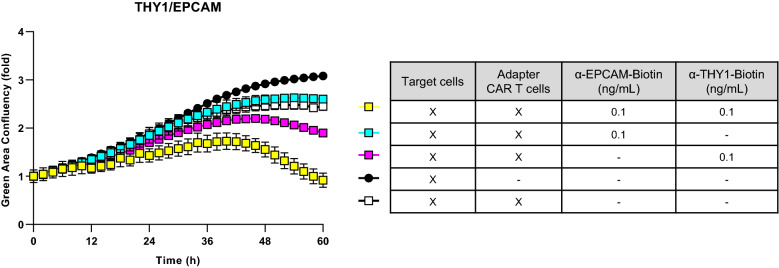
Many critical advances in research utilize techniques that combine high-resolution with high-content characterization at the single cell level. We introduce the MICS (MACSima Imaging Cyclic Staining) technology, which enables the immunofluorescent imaging of hundreds of protein targets across a single specimen at subcellular resolution. MICS is based on cycles of staining, imaging, and erasure, using photobleaching of fluorescent labels of recombinant antibodies (REAfinity Antibodies), or release of antibodies (REAlease Antibodies) or their labels (REAdye_lease Antibodies). Multimarker analysis can identify potential targets for immune therapy against solid tumors. With MICS we analysed human glioblastoma, ovarian and pancreatic carcinoma, and 16 healthy tissues, identifying the pair EPCAM/THY1 as a potential target for chimeric antigen receptor (CAR) T cell therapy for ovarian carcinoma. Using an Adapter CAR T cell approach, we show selective killing of cells only if both markers are expressed. MICS represents a new high-content microscopy methodology widely applicable for personalized medicine.


Conflict of interest statement

A.K., C.H., P.P., J.P., D.Y., S.R., S.Re., F.C.R., D.S., J.K., V.D., M.M.O., L.M., C.R., A.D., T.D.R., S.B., M.B., J.K., M.J., D.E., O.H., C.D., E.S., R.P.P., S.M., J.S., W.M., A.B. are or were employees of Miltenyi Biotec B.V. & Co., E.S. is an employee of Miltenyi Imaging GmbH and M.N. is an employee of Qi Biotech, Inc. There are patent applications pending related to this work.

Figures

Figure 1
Figure 1
Cyclic imaging with the MACSima Imaging Platform. (a) MACSima System with fully automated robotic liquid handling and image acquisition. (b) Erasure techniques based either on photobleaching of the dye, or disruption of the labeling conjugate by release reagent. The release reagent leads to a rapid detachment of the fluorescent dye only (REAdye_lease Antibodies) or disruption of the labeling conjugate with a spontaneous dissociation of the monomerized antibody fragments and the fluorescent dye (REAlease Antibodies) from their target epitopes. (c) Cyclic imaging. (d) Image analysis with the MACS iQ View Software consisting of cellular segmentation, clustering, and visualization of clustered cells across the original image.
Figure 2
Figure 2
Comparison of linearity and sensitivity of imaging-based cytometry on the MACSima System with flow cytometry on the MACSQuant Analyzer. (a) Means (square symbols) and ± 1σ ranges (shaded regions) describing the population distributions for beads incubated with different percentages of APC-labeled vs. unlabeled antibodies measured by the MACSQuant Analyzer (orange) and MACSima Imaging System (cyan). For the images (see inset), bead autofluorescence in the DAPI channel was used to create individual bead masks (gray) over which the total background-subtracted APC signal could be determined. Least-squares line fits on the log–log axes are shown (dashed lines), with the optimal slopes, m, and corresponding R2 values listed for each dataset. (b) Image of PFA-fixed PBMCs labeled with a CD3-APC antibody (red) and a CD45-VioBlue antibody, with the latter staining used to generate the displayed masks (gray) for each CD45+ cell. (c) CD45+ PBMCs were assessed for their CD3-APC co-staining for different stoichiometric amounts of an APC-labeled vs. unlabeled CD3 antibody on the MACSQuant Analyzer (orange) and MACSima Imaging System (cyan). The upper x-axis displays the approximate average number of labeled CD3 proteins per CD3+ cell for each assayed percentage, based on the previously measured average copy number of CD3 per cell amounting to 57,000. Only a small representative subset of the full MACSQuant Analyzer data (the latter ranging from 54,581 to 167,637 cells) is displayed for each assayed percentage of labeled probe to match the respective number of cells measured by the MACSima Imaging System (ranging from 417 to 2384 cells). The inset gives a zoomed-in view of the y-axis for better visualization of the scatter plot distributions. (d–g) Histograms for specific assayed percentages of labeled probe are shown based on the complete datasets from both instruments. For Nave = 190 (d), the CD3+ cell population is recognizable in both datasets as a second peak, permitting a double Gaussian fit and consequent determination of the separation parameter, s. For Nave = 57 (e) and Nave = 19 (f), a second peak is only distinguishable in the MACSima Imaging System’s dataset. The width of the distribution for the blank (g) provides a useful estimate of the measurement error expected for weak signals on both instruments.
Figure 3
Figure 3
Multi-channel analysis of a mouse spleen section on the MACSima Imaging System. A mouse spleen section was fixed by acetone and subsequently stained by directly fluorescently labeled antibodies in subsequent cycles. DAPI was used to stain the nuclei in the section, and it was used to register the images across the cycles and to segment the nuclei of the cells in the section. (a) Small images of each of the channels used to generate the more complex data visualizations in the subsequent panels. In total, 47 antibody staining images and one DAPI image are shown. (b) Result of an extensive k-means (40 clusters) clustering of the staining intensity values of cells after segmentation is shown, in which four cell populations are colored, with B cells in red, T cells in green, Non-B/Non-T cells in blue, and cells not recognized by the antibody panel in gray (17 clusters). The different color changes within the red (9 clusters), green (7 clusters) and blue (17 clusters) represent distinct subpopulations within the respective groups. (c) Results of hierarchical clustering (20 clusters) based on the mean staining intensity values of individual cells and a marker expression heat map of the various subpopulations. On the left side a colored dot inticates if a cluster consists mainly of cell types as classified in b, namely B or T cells or non-B/non-T cells.
Figure 4
Figure 4
Ultrahigh-content imaging enables the discovery of novel targets and target pairs in different cancer indications which can be targeted and lysed in vitro by Adapter CAR T cells. (a–c) Fresh-frozen human GBM, PDAC, and HGSOC samples were sliced and analyzed by MICS. DAPI is shown in white and the indicated markers of interest are shown in green or red. Scale bar represents 100 µm. (a) Examples of MICS analysis of two GBM patient samples showing the expression of GD2, EGFR and cMET. (b) Example of a PDAC patient sample analysis displaying the co-expression of EPCAM (red) as a general epithelial and tumor cell marker with the potential PDAC marker candidates (green) TSPAN, CDCP1 and CLA. (c) Examples of three HGSOC samples. Sample 1 and 2 co-express EPCAM (red) and THY1 (green), while sample 3 expresses EPCAM but not THY1.
Figure 5
Figure 5
Ultrahigh-content imaging validates expression of target candidates on healthy human tissues to predict safety and toxicity of target candidates. Fresh-frozen human tissues were sliced and fixed with acetone. The subsequent screening was performed on the MACSima Imaging Platform by employing a sequential staining of antibodies. Healthy human tissues, i.e. medulla oblongata, ovary, pancreas, colon, kidney, lung, thyroid gland, and pituitary gland, were analyzed for the expression of glioblastoma target candidates (left panel), GD2 is shown in red, EGFR in green, cMET in blue, and DAPI in white; ovarian cancer target candidates (middle panel), EPCAM is shown in red, THY1 in green, and DAPI in white; pancreatic cancer target candidates (right panel), TSPAN8 is shown in red, CLA in green, CDCP1 in blue, and DAPI in white. Scale bar represents 100 µm.
Figure 6
Figure 6
Comparison of marker expression in healthy and cancer samples. Tumor marker expression was quantified on a single-cell level for healthy (left panel) and tumor (right panel) tissue. Image data sets were segmented using MACS iQ View Software based on nuclei and cell membrane markers identifying individual cells. Background-subtracted mean fluorescent intensities (MFI) were computed for each cell and scaled between 0 and 1 for visualization and comparability. Values for all cells detected in one tissue image are displayed as box plots. Note that the scale of expression is kept constant for each marker across all tissues but varies between the markers for optimal representation. The ovarian cancer samples showed a weak but significant positive correlation of 0.35 and 0.20 (significant at α = 0.01; P value = 1.64e−311 and 5.63e−49, respectively) while healthy ovary tissue showed a weak but significant (α = 0.01; P value = 3.89e−107) negative correlation of − 0.23. The marker pair showed comparatively higher positive correlation of 0.58 in healthy breast tissue, but an overall very low expression level. Please note that expression values are only presented for tissues of interest.
Figure 7
Figure 7
Adapter CAR T cells targeting THY1 and EPCAM are selectively cytolytic against ovarian cancer cell line co-expressing THY1 and EPCAM. Primary human T cells were isolated and transduced with a CAR construct against biotin. Anti-biotin CAR T cells were co-cultured with THY1-, EPCAM-, and GFP-expressing target cells for 72 h in the presence of suboptimal single adapter doses or with the combinatorial use of suboptimal adapter doses. GFP-fluorescence was measured over time. CAR T cell-mediated lysis of target cells resulted in decreased GFP-fluorescence. Combined treatment with THY1- and EPCAM=reactive adapter antibodies triggered target cell lysis at concentrations which were too low to cause CAR T cell-mediated target cell lysis when applied separately. Each data point represents mean of a technical replicate ± SEM. Representative graph from three experiments shown.

References

    1. Schubert W, et al. Analyzing proteome topology and function by automated multidimensional fluorescence microscopy. Nat. Biotechnol. 2006;24:1270–1278. doi: 10.1038/nbt1250. - DOI - PubMed
    1. Hennig C, Adams N, Hansen G. A versatile platform for comprehensive chip-based explorative cytometry. Cytometry A. 2009;75:362–370. doi: 10.1002/cyto.a.20668. - DOI - PubMed
    1. Bendall SC, et al. Single-cell mass cytometry of differential immune and drug responses across a human hematopoietic continuum. Science. 2011;332:687–696. doi: 10.1126/science.1198704. - DOI - PMC - PubMed
    1. Rimm DL. Next-gen immunohistochemistry. Nat Methods. 2014;11:381–383. doi: 10.1038/nmeth.2896. - DOI - PubMed
    1. Lin J-R, Fallahi-Sichani M, Sorger PK. Highly multiplexed imaging of single cells using a high-throughput cyclic immunofluorescence method. Nat. Commun. 2015;6:8390. doi: 10.1038/ncomms9390. - DOI - PMC - PubMed

MeSH terms