. 2022 Feb 3;12(1):1900.
doi: 10.1038/s41598-022-05827-2.

Cardiac dyspnea risk zones in the South of France identified by geo-pollution trends study

Affiliations

Cardiac dyspnea risk zones in the South of France identified by geo-pollution trends study

Fanny Simões et al. Sci Rep. .

Abstract

The incidence of cardiac dyspnea (CD) and the distribution of pollution in the south of France suggests that environmental pollution may have a role in disease triggering. CD is a hallmark symptom of heart failure leading to reduced ability to function and engage in activities of daily living. To show the impact of short-term pollution exposure on the increment of CD emergency room visits, we collected pollutants and climate measurements on a daily basis and 43,400 events of CD in the Région Sud from 2013 to 2018. We used a distributed lag non-linear model (DLNM) to assess the association between air pollution and CD events. We divided the region in 357 zones to reconciliate environmental and emergency room visits data. We applied the DLNM on the entire region, on zones grouped by pollution trends and on singular zones. Each pollutant has a significant effect on triggering CD. Depending on the pollutant, we identified four shapes of exposure curves to describe the impact of pollution on CD events: early and late effect for NO2; U-shape and rainbow-shape (or inverted U) for O3; all the four shapes for PM10. In the biggest cities, O3 has the most significant association along with the PM10. In the west side, a delayed effect triggered by PM10 was found. Zones along the main highway are mostly affected by NO2 pollution with an increase of the association for a period up to 9 days after the pollution peak. Our results can be used by local authorities to set up specific prevention policies, public alerts that adapt to the different zones and support public health prediction-making. We developed a user-friendly web application called Health, Environment in PACA Region Tool (HEART) to collect our results. HEART will allow citizens, researchers and local authorities to monitor the impact of pollution trends on local public health.


Conflict of interest statement

The authors declare no competing interests.

Figures
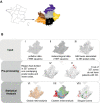
Figure 1
Figure 1
Study design and data analysis workflow. (A) The Région Sud and its 6 departments. The three databases used had different resolutions: non-overlapping meshes of 4 km squares for pollution (B I) and meteorological variables (B II), and postal codes for emergency room visits data (B III). To reconciliate the databases, we created 357 zones (B IV) of non-overlapping postal codes. 8 zones, for which no CD events were registered during the period under study, were filtered out, for a total of 349 zones (B V). Finally, the model was run globally on 251 zones out of 349 because 97 zones contain less than 18 CD events (minimal empirical value of employability of the model) over the entire period of 6 years concerned by this study (B VI). Then the model was run on zones grouped by pollution trends (B VII). Finally, the model was run on the 251 zones singularly and 23 zones with the highest number of CD events were selected (B VIII). Maps were created with the R package maptools v1.1-1.
Figure 2
Figure 2
Main characteristics of emergency room visits data. The incidence of CD events in Région Sud (A), by season (B) and by gender (C). The distribution of CD events by age (D) by department (E) and by zone (F). Maps were created with the R package maptools v1.1-1.
Figure 3
Figure 3
Global DLNM (only significant results are reported). Lag-specific effect on CD events for increases of each of the meteorological variables temperature (A), pressure (B), temperature amplitude (C) and pressure amplitude (D), over the thresholds indicated in the legend in the plot for all zones in Région Sud.
Figure 4
Figure 4
DLNM by pollution clusters (only significant results are reported). (A) Zones of Région Sud coloured by cluster of pollution. Colour code: light blue, cluster 1 (internal zones on the mountains); light green, cluster 3 (mountains); dark green, cluster 4 (big cities on the coast); pink, cluster 5 (highway); red, cluster 6 (west side); grey, zones not included. (B) Lag-specific effect on CD events for increases of NO2 levels over the two thresholds as indicated in the legend in the plot for zones in cluster 6 (west side). Lag-specific effect on CD events for increases of O3 levels over the thresholds indicated in the legend in the plot for zones in cluster 5 (highway) (C), cluster 1 (internal zones on the mountains) (D) and cluster 3 (mountains) (E). (F) Lag-specific effect on CD events for increases of PM10 over the thresholds indicated in the legend in the plot for zones in cluster 4 (big cities on the coast). Maps were created with the R package maptools v1.1-1.
Figure 5
Figure 5
DLNM by singular zones, only significant results for the selected 23 zones are reported. Lag-specific effect on CD events for increases of NO2 (A), O3 (B) and PM10 (C) over the thresholds indicated in the legend in the plot. Only the most representative plot is reported for each pollutant and shape of the response-effect curves. Others zones showing similar trends are reported in Supplementary Fig. 5. Maps were created with the R package maptools v1.1-1.

References

    1. Cardiology ES of. The ESC Textbook of Cardiovascular Medicine. 1423. (OUP, 2009).
    1. van Mourik Y, Rutten FH, Moons KGM, Bertens LCM, Hoes AW, Reitsma JB. Prevalence and underlying causes of dyspnoea in older people: A systematic review. Age Ageing. 2014;43(3):319–326. doi: 10.1093/ageing/afu001. - DOI - PubMed
    1. Peters SP. When the chief complaint is (or should be) dyspnea in adults. J. Allergy Clin. Immunol. Pract. 2013;1(2):129–136. doi: 10.1016/j.jaip.2013.01.004. - DOI - PubMed
    1. Benbrahim-Tallaa L, Baan RA, Grosse Y, Lauby-Secretan B, El Ghissassi F, Bouvard V, et al. Carcinogenicity of diesel-engine and gasoline-engine exhausts and some nitroarenes. Lancet Oncol. 2012;13(7):663–664. doi: 10.1016/S1470-2045(12)70280-2. - DOI - PubMed
    1. Hamra Ghassan B, Neela G, Aaron C, Francine L, Ole R-N, Jonathan S, et al. Outdoor particulate matter exposure and lung cancer: A systematic review and meta-analysis. Environ. Health Perspect. 2014;122(9):906–911. doi: 10.1289/ehp/1408092. - DOI - PMC - PubMed

Publication types

MeSH terms