. 2022 Feb;54(2):134-142.
doi: 10.1038/s41588-021-00991-z. Epub 2022 Feb 3.

Combined effects of host genetics and diet on human gut microbiota and incident disease in a single population cohort

Affiliations

Combined effects of host genetics and diet on human gut microbiota and incident disease in a single population cohort

Youwen Qin et al. Nat Genet. 2022 Feb.

Erratum in

Abstract

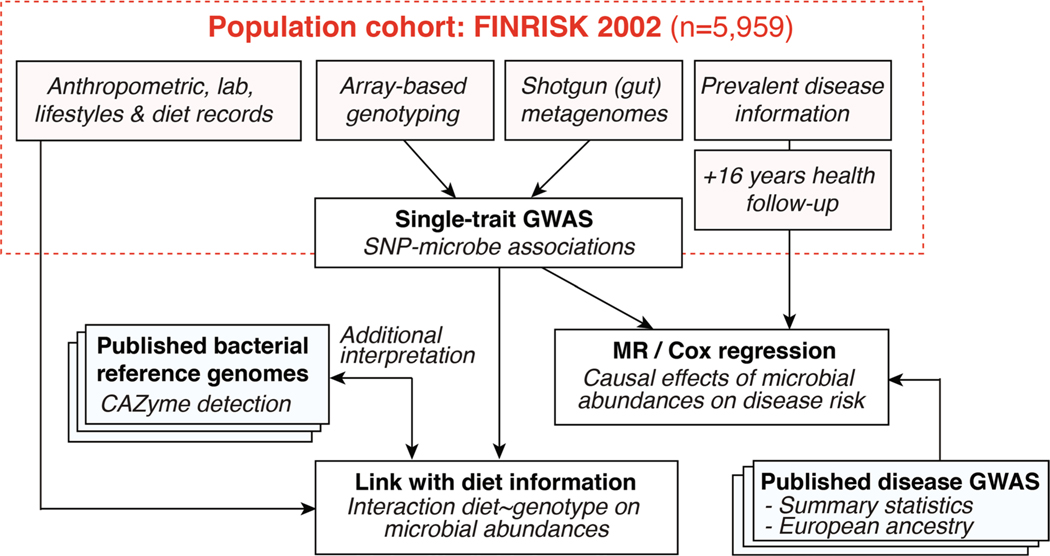
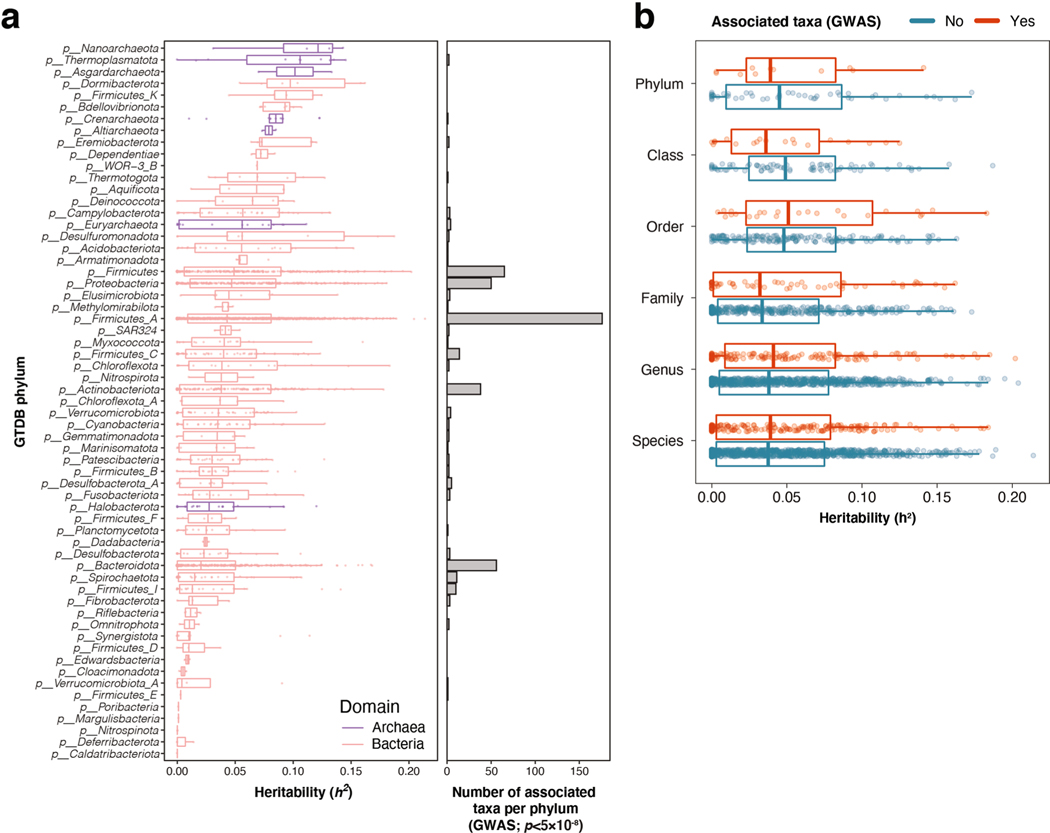
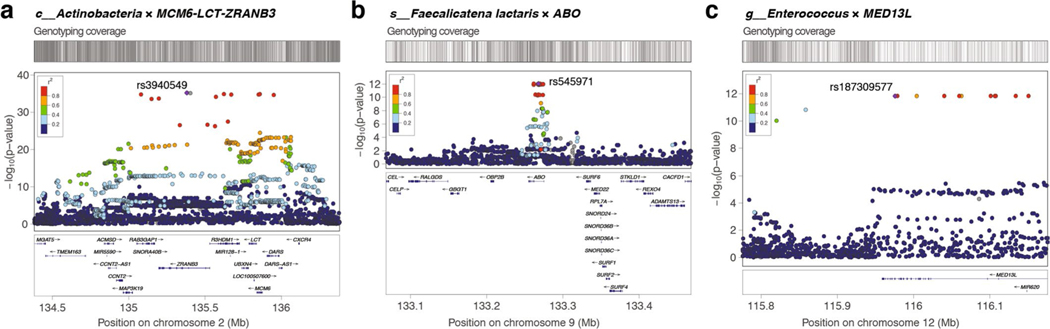
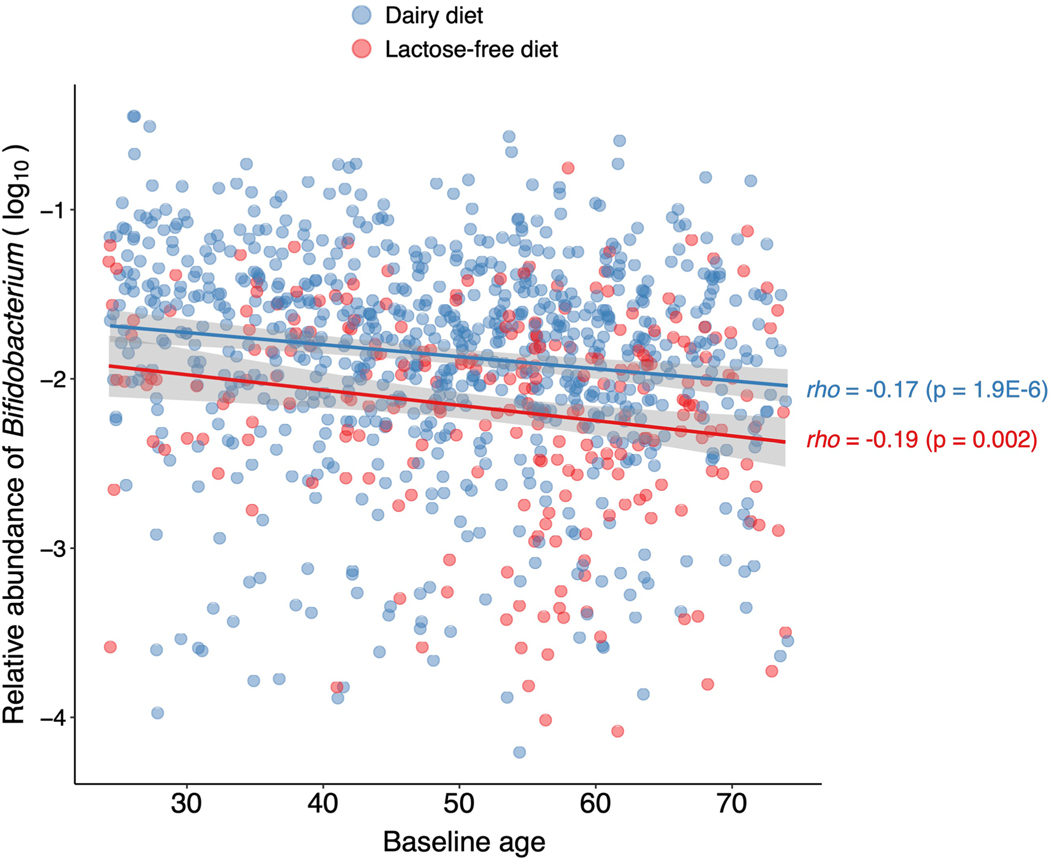
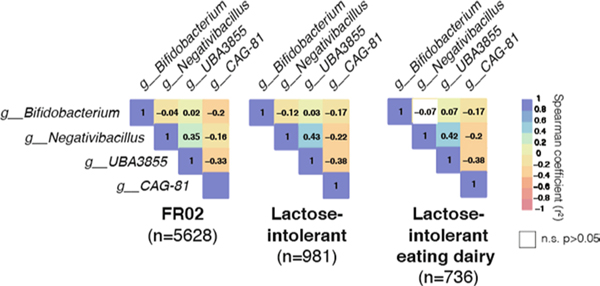
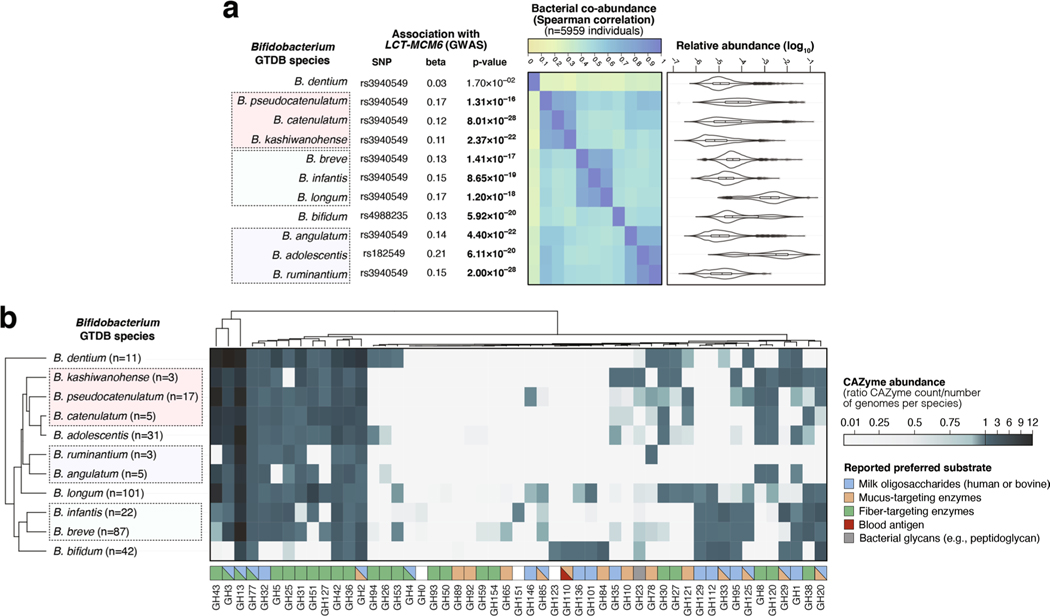
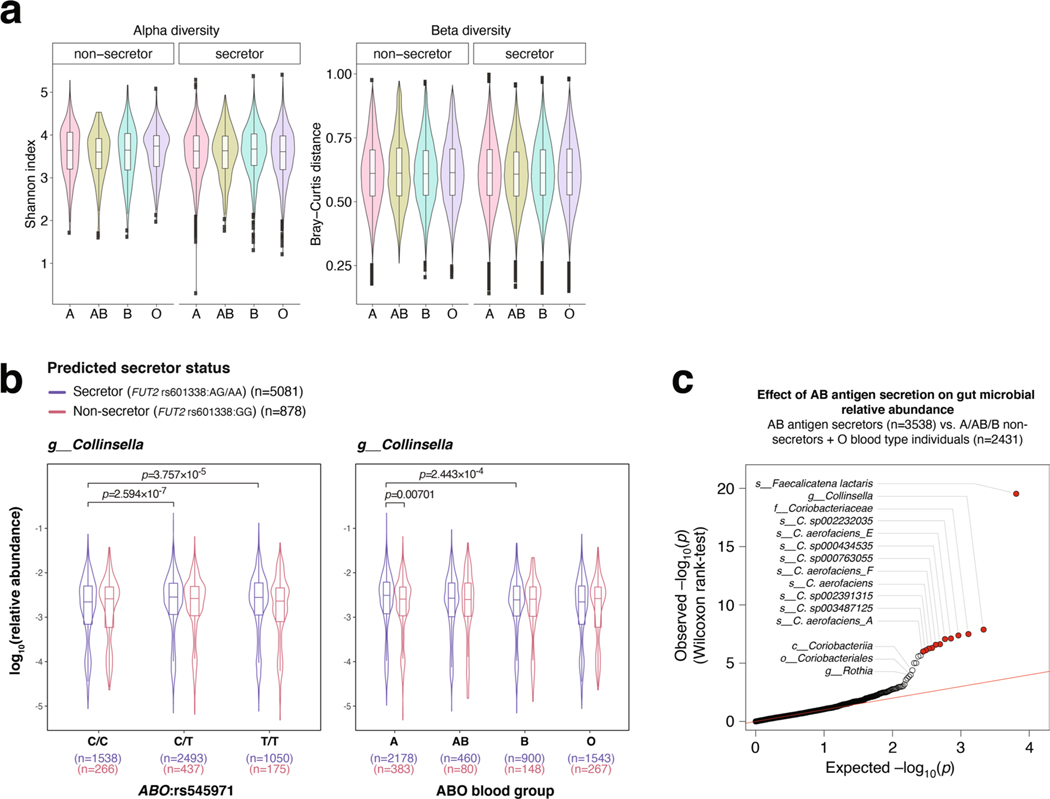
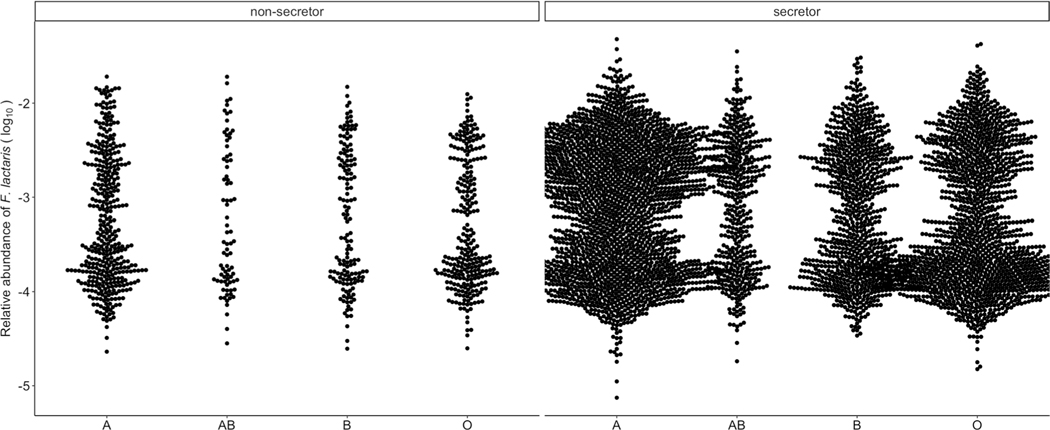
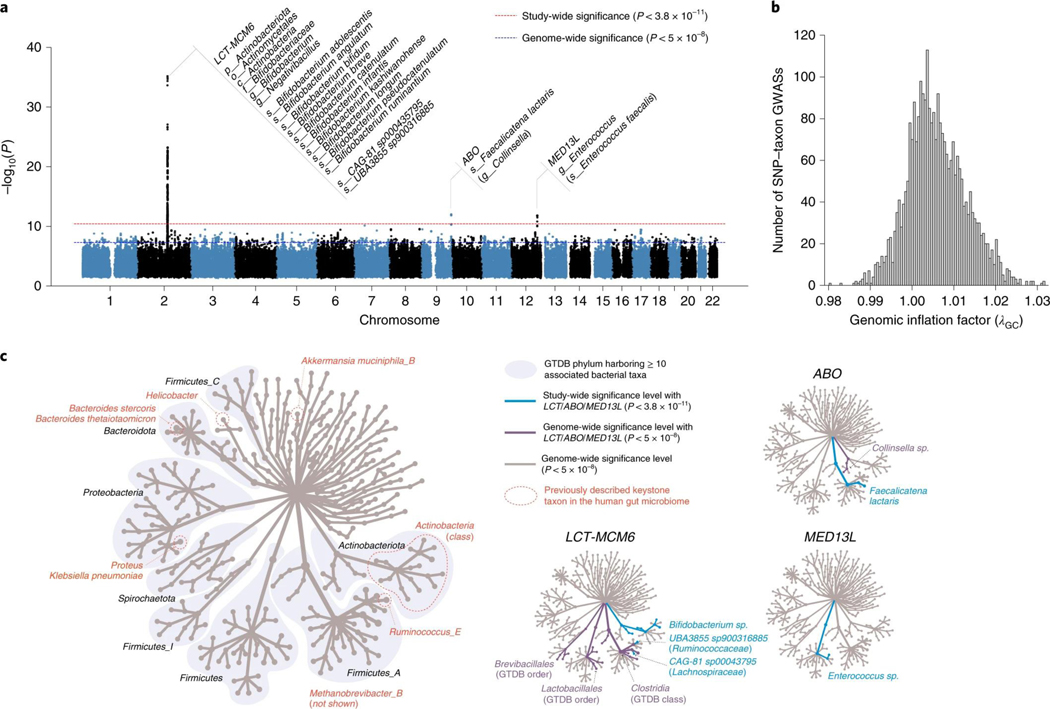
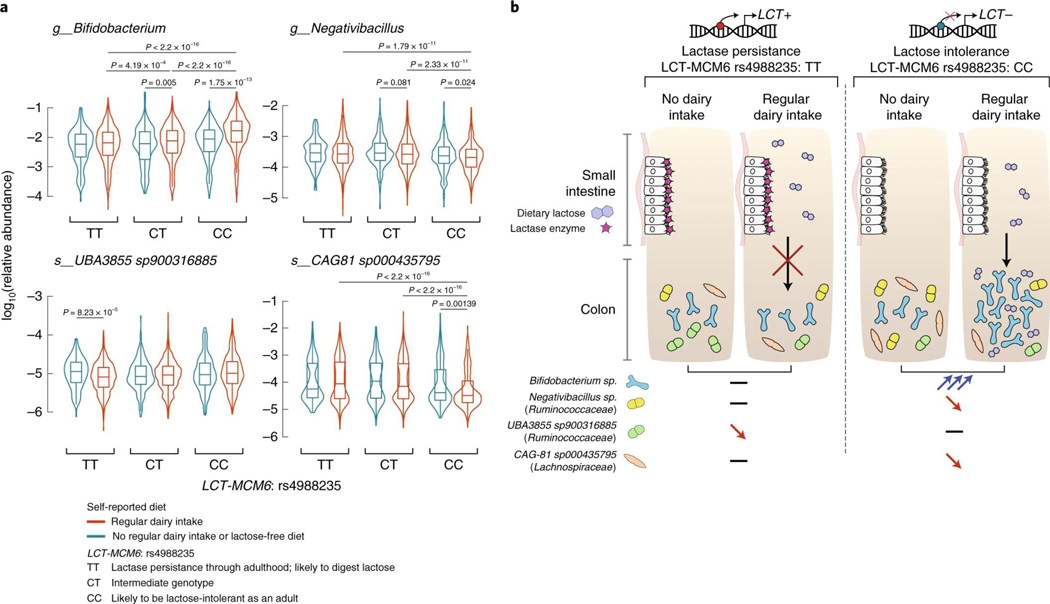
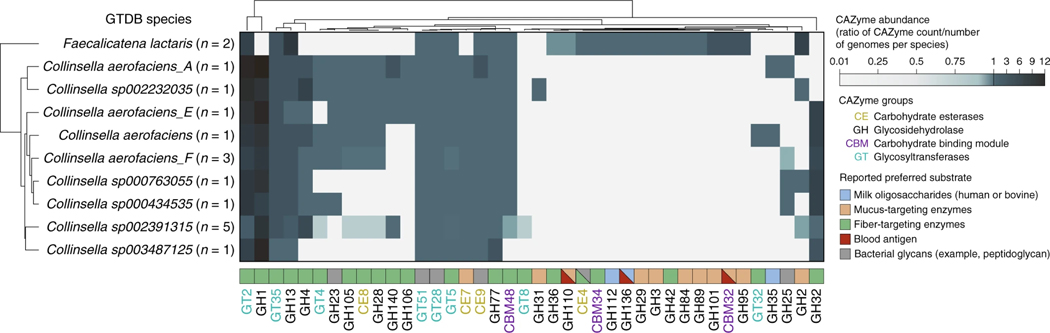
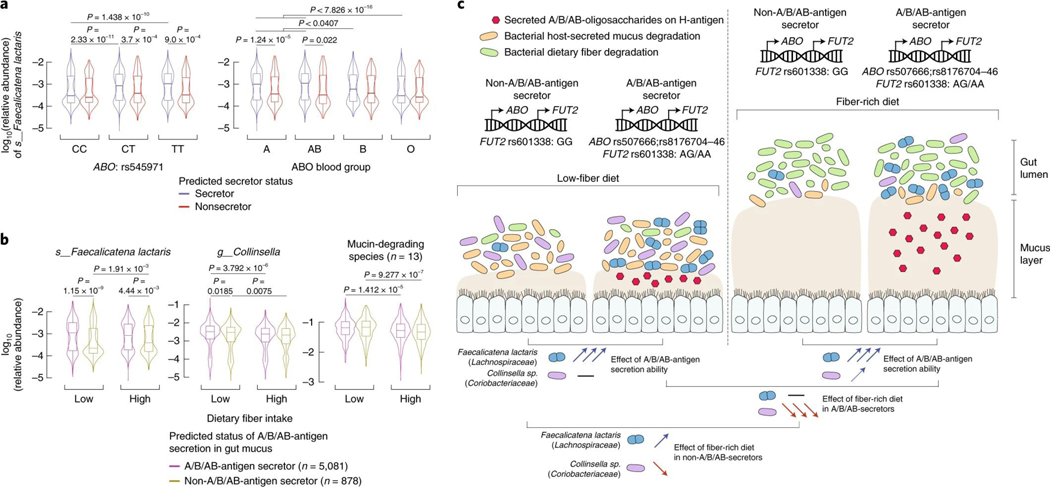
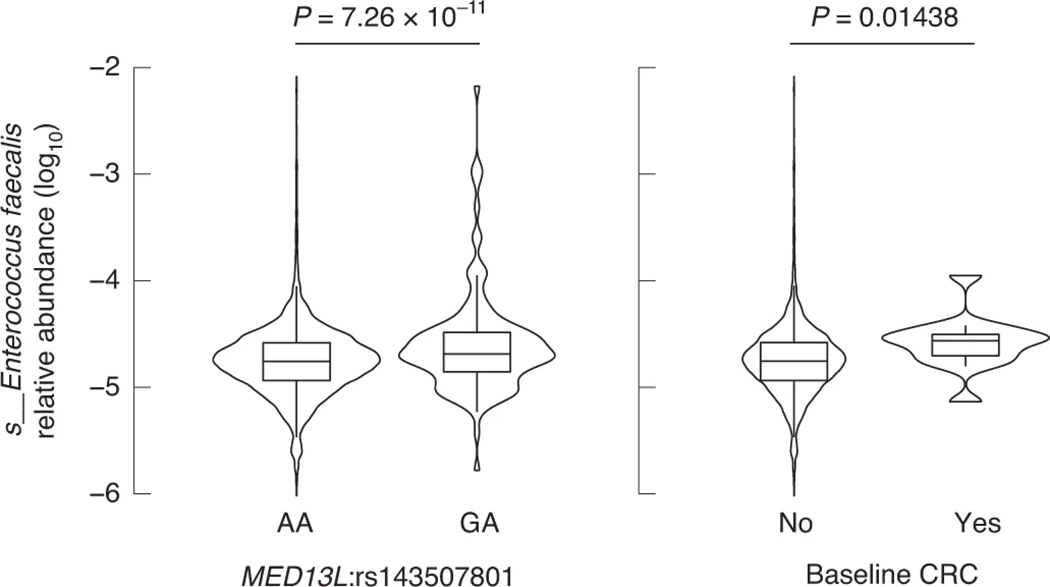
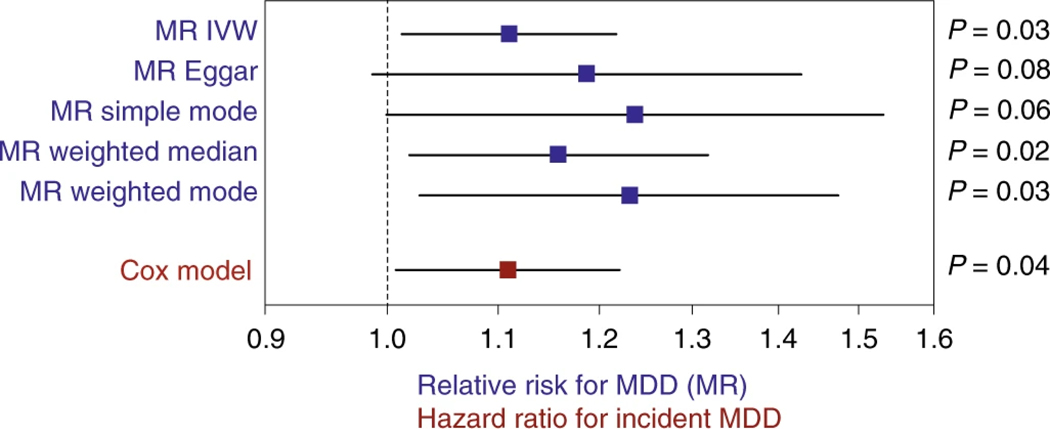
Human genetic variation affects the gut microbiota through a complex combination of environmental and host factors. Here we characterize genetic variations associated with microbial abundances in a single large-scale population-based cohort of 5,959 genotyped individuals with matched gut microbial metagenomes, and dietary and health records (prevalent and follow-up). We identified 567 independent SNP-taxon associations. Variants at the LCT locus associated with Bifidobacterium and other taxa, but they differed according to dairy intake. Furthermore, levels of Faecalicatena lactaris associated with ABO, and suggested preferential utilization of secreted blood antigens as energy source in the gut. Enterococcus faecalis levels associated with variants in the MED13L locus, which has been linked to colorectal cancer. Mendelian randomization analysis indicated a potential causal effect of Morganella on major depressive disorder, consistent with observational incident disease analysis. Overall, we identify and characterize the intricate nature of host-microbiota interactions and their association with disease.


Figures

Extended Data Fig. 1 |
Study flowchart.
Extended Data Fig. 2 |
Extended Data Fig. 2 |. Heritability of SNPs associated with microbial taxa.
(a) Associated SNP heritability (h2) for all 2,801 taxa included in the genome-wide association analysis, grouped into their 61 corresponding GTDB phyla, and ordered by median heritability per phylum. Red denotes bacterial phyla, and purple denotes archaeal phyla. The right panel indicates the number of genome-wide significant associated taxa for each phylum. (b) Associated SNP heritability is shown for each associated taxon, grouped by its taxonomic rank. Genome-wide significance was defined as a threshold of p < 5 × 10⁻⁸ for all p-values obtained after joint analysis using GTCA-COJO in the GWAS (see Methods). For all box plots (A and B), the central line, box and whiskers represent the median, interquartile range (IQR) and 1.5 times the IQR, respectively.
Extended Data Fig. 3 |
Extended Data Fig. 3 |. LocusZoom plots for three loci with study-wide significant associations (p < 3.8 × 10⁻¹¹).
Associations with top taxa are shown. Top SNPs are indicated in purple diamond. Other SNPs are coloured by their linkage disequilibrium (LD) values with the top SNPs. Genes covered by the region are indicated in the bottom and the genotyping coverage is indicated on top of the plot. (A) Associated SNPs at the LCT locus spans over a 2 Mbp genomic region, while they are grouped on a 400 kbp region for both (B) ABO and (C) the MED13L loci.
Extended Data Fig. 4 |
Extended Data Fig. 4 |. Correlation between individual baseline age and the relative abundance of bacteria from the Bifidobacterium genus in lactose intolerant individuals.
Only genetically lactose intolerance individuals (rs4988235:CC) are shown, and coloured by dietary dairy habits (blue: self-reported regular consumption of dairy, n = 763; and red: self-reported irregular dairy diet or lactose-free diet, n = 253). Best fitted lines and 95% confidence intervals are indicated. Two-sided Spearman correlation coefficients are given.
Extended Data Fig. 5 |
Extended Data Fig. 5 |. Spearman correlation of relative abundances in 4 taxa associated with the LCT locus.
Abundances of the Bifidobacterium, Negativibacillus, UBA3855 and CAG-81 genera are compared. Abundances in the entire FR02 cohort is compared to those in a subset of genetically lactose-intolerant individuals, and to a subset of genetically lactose-intolerant individuals who reported a regular dairy diet. Coloured boxes denote the strength of correlation (ranging from −1 in red to 1 in dark blue), while a white square denotes a non-significant p-value for the two-sided Spearman correlation (p > 0.05).
Extended Data Fig. 6 |
Extended Data Fig. 6 |. Co-abundance and carbohydrate-active enzymes (CAZyme) distribution patterns in 11 Bifidobacterium species harboured by > 25% of individuals in the FR02 cohort.
(a) Associations between the LCT-MCM6 locus and 11 Bifidobacterium species; (left) top association results between variation of 11 Bifidobacterium species and the LCT locus, with study-wide significant associations (with p-values from the joint analysis using GTCA-COJO below the p < 3.8 × 10⁻¹¹ threshold) highlighted in bold; (middle) Two-sided Spearman coefficients calculated on CLR-transformed abundances; (right) relative abundances across the FR02 cohort, ranging from 0 (light green) to 1 (dark blue). (b) CAZyme distribution patterns in 327 previously published reference genomes from 11 Bifidobacterium GTDB species which were included in the GTDB release 89 index used to classify metagenomes in this study. The heatmap indicates abundance of corresponding CAZyme families in species, corresponding to the total count of detected families for each species divided by the number of reference genomes examined for the same species. Values <1 (white to light blue) indicate that less than one copy per genome of the corresponding CAZyme family was detected for each species, values >1 (light blue to dark blue) indicate that more than one copy per genome was detected. Preferred substrate groups are based on literature search and descriptions on CAZypedia.org. For all box plots (A), the central line, box and whiskers represent the median, interquartile range (IQR) and 1.5 times the IQR, respectively. Violin plots represent the distribution density of the data points.
Extended Data Fig. 7 |
Extended Data Fig. 7 |. Effect of ABO genotypes, blood type and secretor status on microbial diversity and gut levels of ABO-associated taxa.
(a) (left) Alpha diversity represented by Shannon indices; (right) beta diversity, represented by Bray-Curtis distances. Alpha and beta diversity were calculated from individual taxonomic profiles at the genus level. Individuals were segregated according to their predicted blood type and secretor status, both predicted from genotype data. (b) Abundances are compared across stratified groups of individuals from the FR02 cohort according to (left panel): ABO:rs545971 genotype and predicted secretor status (blue: secretor status conferred by FUT2 rs601338:AG/AA genotype; red: non-secretor status conferred by FUT2 rs601338:GG genotype) and (right panel) according to predicted A, AB, B and O blood types, and predicted secretor status. All statistical comparisons denote the p-values of Wilcoxon rank test on the distributions. (c) Effect of AB antigen secretion on gut microbial relative abundance, using the 2,801 taxa considered for GWAS in our study. Taxa with FDR adjusted p value <0.05 are highlighted in red. Red line indicates the expected distribution of p values under the null hypothesis. P values were calculated using Wilcoxon rank test. For all box plots (A and B), the central line, box and whiskers represent the median, interquartile range (IQR) and 1.5 times the IQR, respectively. Violin plots represent the distribution density of the data points.
Extended Data Fig. 8 |
Extended Data Fig. 8 |. Sequencing depth does not influence alpha diversity.
Alpha-diversity (Shannon index) were computed and plotted against the log10 (left) or the raw (right) number of sequencing reads for each 5,959 individual gut metagenome in this study. No correlation was observed between sequencing depth and Shannon diversity index (two-sided Spearman’s ⍴=−0.001598, p = 0.90). Grey shaded area corresponds to the 95% confidence interval.
Extended Data Fig. 9 |
Extended Data Fig. 9 |. Effect of geographical region of sampling, microbiome sequencing batch or antibiotic prescription on overall microbiome diversity.
Beta-diversity (Bray Curtis dissimilarity indices) was calculated using the R package vegan, and the 4 top PCoA axes (explaining a combined 25.9% of the total microbiome variation) were plotted against each other, with each individual point labelled according to geographical sampling (panel A), gut metagenomic sequencing batch (panel B), or whether antibiotics were prescribed up to 1 month (n = 250/5959) before baseline sampling.
Extended Data Fig. 10 |
Extended Data Fig. 10 |. Distribution of F. lactaris relative abundance in groups of individuals with different predicted blood types.
A beeswarm plot is used to visualise the distribution of relative abundances.
Fig. 1 |
Fig. 1 |. Genome-wide association of human genetic and gut microbial variations.
a, Manhattan plot aggregating the top associations with microbial variation. Each SNP was tested against each of the 2,801 taxa and the Manhattan plot shows the lowest resulting P value for each SNP. Loci with associations above study-wide significance level (P < 3.8 × 10⁻¹¹; red dashed line) are annotated with the human locus name and the corresponding associated microbial taxa. The blue dashed line denotes genome-wide significance level (P < 5 × 10⁻⁸). Of all genome-wide significant associations shown on the Manhattan plot, 320 of 567 (56.4%) involved 265 lead SNPs with MAF between 1% and 5%, and 247 of 567 (43.6%) involved 185 lead SNPs with MAF > 5%. P values denote significance of the joint analysis model using GTCA-COJO. b, The distribution of genomic inflation factor (λGC) in 2,801 tested taxa (median(λGC)=1.0051; mean(λGC)=1.0059). c, Tree-based visualization of the taxonomic diversity of genome-wide associated microbial taxa. The central root of the tree represents the Bacteria domain, the first connected node represents phylum, the second connected node class, the third order and the fourth family. Every node represents at least one associated taxon in the GWAS at genome-wide significance level. The three smaller trees on the right highlight all taxonomic groups containing at least one taxon identified as associated with the LCT-MCM6, ABO and MED13L loci (blue edges and nodes denote taxa associated at study-wide significance level and purple edges and nodes denote taxa associated at genome-wide significance level). The main tree is annotated to indicate phyla harboring >10 distinct genome-wide associated taxa, as well as previously described keystone taxa. MAF, minor allele frequency.
Fig. 2 |
Fig. 2 |. Interaction of human genotype, dairy diet and gut bacterial variation with the LCT locus.
a, The four panels present variation in microbial relative abundances (not CLR-transformed) for the four taxa associated at study-wide significance level with the LCT locus at P < 3.8 × 10⁻¹¹: Bifidobacterium, Negativibacillus, UBA3855 sp900316885 and CAG-81 sp000435795. Abundances are compared across stratified groups of individuals from the FR02 cohort according to LCT-MCM6:rs4988235 genotype and self-reported dietary lactose intake (red, regular dairy diet; blue, lactose-free diet). Sample sizes for groups of individuals self-reporting a regular dairy diet: rs4988235:TT (n = 1,786), CT (n = 2,413), CC (n = 736); self-reporting a nonregular dairy diet or lactose-free diet: TT (n = 150), CT (n = 198), CC (n = 245). All statistical comparisons denote the P values of Wilcoxon rank test on the distributions of untransformed relative abundances. Only significantly different comparisons (P < 0.05) are indicated. For all box plots, the central line, box and whiskers represent the median, interquartile range (IQR) and 1.5 times the IQR, respectively. Violin plots represent the distribution density of the data points. b, Host genetics and gut microbes interact in the context of dairy intake and lactose intolerance.
Fig. 3 |
Fig. 3 |. Functional profiling of reference genomes from two bacterial taxa associated with the ABO locus.
CAZyme distribution patterns in F. lactaris and Collinsella reference genomes (from the GTDB release 89 index used to classify metagenomes in this study). The heatmap indicates species abundance in corresponding CAZyme families, corresponding to the total count of detected families for each species divided by the number of reference genomes examined for the same species. Values < 1 (white to light blue) indicate that less than one copy per genome of the corresponding CAZyme family was detected for each species; values > 1 (light blue to dark blue) indicate that more than one copy per genome was detected. Preferred substrate groups are based on literature search and descriptions on CAZypedia.org.
Fig. 4 |
Fig. 4 |. Effects of host genetics and dietary fiber intake on gut abundance variation of two bacterial taxa associated with the ABO locus.
a, ABO-associated F. lactaris relative abundances (not CLR-transformed) are compared across stratified groups of individuals from the FR02 cohort according to (left panel) ABO:rs4988235 genotype and predicted secretor status (blue, secretor status conferred by FUT2 rs601338:AG/AA genotype; red, nonsecretor status conferred by FUT2 rs601338:GG genotype), and (right panel) according to predicted A, AB, B and O blood types, and predicted secretor status. Sample sizes for compared groups: secretor status with rs545971:C/C (n = 1,538), C/T (n = 2,493), T/T (n = 1,050) and blood group A (n = 2,178), AB (n = 460), B (n = 900), O (n = 1,543); nonsecretor status with rs545971:C/C (n = 266), C/T (n = 437), T/T (n = 175) and blood group A (n = 383), AB (n = 80), B (n = 148), O (n = 267). b, ABO-associated F. lactaris and Collinsella sp. relative abundances, as well as compounded abundances from 13 mucin-degrading species from Tailford et al. (2015), are compared across stratified groups of individuals from the FR02 cohort according to the predicted A/B/AB-antigen secretion status and dietary fiber intake. Secretion status was defined to segregate individuals. A/B/AB-antigen secretors were defined as secretor individuals from blood types A, AB and B. Non-A/B/AB-antigen secretors were defined as nonsecretor individuals and O-antigen secretors. Fiber intake was compared in individual groups from the top and bottom quartiles of total fiber score (Methods). Sample sizes for compared groups of individuals: A/B/AB-antigen secretors (n = 1,393) following a low-fiber diet (n = 723) or a fiber-rich diet (n = 670), or non-A/B/AB-antigen secretors (n = 952) following a low-fiber diet (n = 490) or a fiber-rich diet (n = 462). All statistical comparisons denote the P values of Wilcoxon rank test on the distributions of untransformed relative abundances. For all box plots (b and c), the central line, box and whiskers represent the median, IQR and 1.5 times the IQR, respectively. Violin plots represent the distribution density of the data points. c, Host genetics and gut microbes interact in the context of fiber intake, secretor status and blood types.
Fig. 5 |
Fig. 5 |. Effect of host genetics and prevalent CRC on gut levels of E. faecalis associated with MED13L variation across participants of the FR02 cohort.
Abundances are compared across individuals grouped according to (left panel) MED13L:rs143507801 genotype and (right panel) CRC prevalence according to the Finnish Cancer Registry. The comparison between E. faecalis variation and MED13L:rs143507801 reflects the GWAS results (Supplementary Table 1). The comparison of E. faecalis abundances in individuals with or without a history of CRC at the time of sampling was performed using a Wilcoxon rank test. Sample sizes for compared groups of individuals: rs143507801:A/A (n = 5,825), G/A (n = 130) (note: only 1 of 5,959 individuals in our cohort was G/G); with CRC (n = 14), without a history of CRC at baseline (n = 5,941). For all box plots, the central line, box and whiskers represent the median, IQR and 1.5 times the IQR, respectively. Violin plots represent the distribution density of the data points.
Fig. 6 |
Fig. 6 |. MR-based causal effects and incident depression analysis link Morganella with MDD.
Forest plot (in blue) representing the magnitude of the effect on MDD risk per 1-s.d. increase in bacterial abundance. MR analysis was carried out with 28 genetic instruments and their effect sizes from FR02 (5,959 samples) and MR-Base summary statistics (173,005 samples). In red is shown the hazard ratio for incident MDD in the FR02 cohort up to 16 yr after baseline sampling, using Cox model (Methods). Error bars represent the 95% CIs. IVW, inverse-variance weighted.

Similar articles

  • Effect of host genetics on the gut microbiome in 7,738 participants of the Dutch Microbiome Project.
    Lopera-Maya EA, Kurilshikov A, van der Graaf A, Hu S, Andreu-Sánchez S, Chen L, Vila AV, Gacesa R, Sinha T, Collij V, Klaassen MAY, Bolte LA, Gois MFB, Neerincx PBT, Swertz MA; LifeLines Cohort Study; Harmsen HJM, Wijmenga C, Fu J, Weersma RK, Zhernakova A, Sanna S. Lopera-Maya EA, et al. Nat Genet. 2022 Feb;54(2):143-151. doi: 10.1038/s41588-021-00992-y. Epub 2022 Feb 3. Nat Genet. 2022. PMID: 35115690
  • Identification of host gene-microbiome associations in colorectal cancer patients using mendelian randomization.
    Xiang Y, Zhang C, Wang J, Cheng Y, Wang L, Tong Y, Yan D. Xiang Y, et al. J Transl Med. 2023 Aug 10;21(1):535. doi: 10.1186/s12967-023-04335-9. J Transl Med. 2023. PMID: 37563724 Free PMC article.
  • Challenges and future directions for studying effects of host genetics on the gut microbiome.
    Sanna S, Kurilshikov A, van der Graaf A, Fu J, Zhernakova A. Sanna S, et al. Nat Genet. 2022 Feb;54(2):100-106. doi: 10.1038/s41588-021-00983-z. Epub 2022 Feb 3. Nat Genet. 2022. PMID: 35115688 Review.
  • Large-scale association analyses identify host factors influencing human gut microbiome composition.
    Kurilshikov A, Medina-Gomez C, Bacigalupe R, Radjabzadeh D, Wang J, Demirkan A, Le Roy CI, Raygoza Garay JA, Finnicum CT, Liu X, Zhernakova DV, Bonder MJ, Hansen TH, Frost F, Rühlemann MC, Turpin W, Moon JY, Kim HN, Lüll K, Barkan E, Shah SA, Fornage M, Szopinska-Tokov J, Wallen ZD, Borisevich D, Agreus L, Andreasson A, Bang C, Bedrani L, Bell JT, Bisgaard H, Boehnke M, Boomsma DI, Burk RD, Claringbould A, Croitoru K, Davies GE, van Duijn CM, Duijts L, Falony G, Fu J, van der Graaf A, Hansen T, Homuth G, Hughes DA, Ijzerman RG, Jackson MA, Jaddoe VWV, Joossens M, Jørgensen T, Keszthelyi D, Knight R, Laakso M, Laudes M, Launer LJ, Lieb W, Lusis AJ, Masclee AAM, Moll HA, Mujagic Z, Qibin Q, Rothschild D, Shin H, Sørensen SJ, Steves CJ, Thorsen J, Timpson NJ, Tito RY, Vieira-Silva S, Völker U, Völzke H, Võsa U, Wade KH, Walter S, Watanabe K, Weiss S, Weiss FU, Weissbrod O, Westra HJ, Willemsen G, Payami H, Jonkers DMAE, Arias Vasquez A, de Geus EJC, Meyer KA, Stokholm J, Segal E, Org E, Wijmenga C, Kim HL, Kaplan RC, Spector TD, Uitterlinden AG, Rivadeneira F, Franke A, Lerch MM, Franke L, Sanna S, D'Amato M, Pedersen O, Paterson AD, Kraaij R, Raes J, Zhernakova A. Kurilshikov A, et al. Nat Genet. 2021 Feb;53(2):156-165. doi: 10.1038/s41588-020-00763-1. Epub 2021 Jan 18. Nat Genet. 2021. PMID: 33462485 Free PMC article.
  • Genetic liability of gut microbiota for idiopathic pulmonary fibrosis and lung function: a two-sample Mendelian randomization study.
    Ren Y, Zhang Y, Cheng Y, Qin H, Zhao H. Ren Y, et al. Front Cell Infect Microbiol. 2024 May 22;14:1348685. doi: 10.3389/fcimb.2024.1348685. eCollection 2024. Front Cell Infect Microbiol. 2024. PMID: 38841114 Free PMC article.

Cited by

References

    1. Belizário JE & Napolitano M. Human microbiomes and their roles in dysbiosis, common diseases, and novel therapeutic approaches. Front. Microbiol 6, 1050 (2015). - PMC - PubMed
    1. Levy M, Kolodziejczyk AA, Thaiss CA & Elinav E. Dysbiosis and the immune system. Nat. Rev. Immunol 17, 219–232 (2017). - PubMed
    1. Blekhman R. et al. Host genetic variation impacts microbiome composition across human body sites. Genome Biol. 16, 191 (2015). - PMC - PubMed
    1. Davenport ER et al. ABO antigen and secretor statuses are not associated with gut microbiota composition in 1,500 twins. BMC Genomics 17, 941 (2016). - PMC - PubMed
    1. Goodrich JK et al. Genetic determinants of the gut microbiome in UK twins. Cell Host Microbe 19, 731–743 (2016). - PMC - PubMed

Publication types

MeSH terms