. 2022 Feb;28(2):315-324.
doi: 10.1038/s41591-021-01655-5. Epub 2022 Feb 3.

Intestinal Akkermansia muciniphila predicts clinical response to PD-1 blockade in patients with advanced non-small-cell lung cancer

Affiliations

Intestinal Akkermansia muciniphila predicts clinical response to PD-1 blockade in patients with advanced non-small-cell lung cancer

Lisa Derosa et al. Nat Med. 2022 Feb.

Abstract

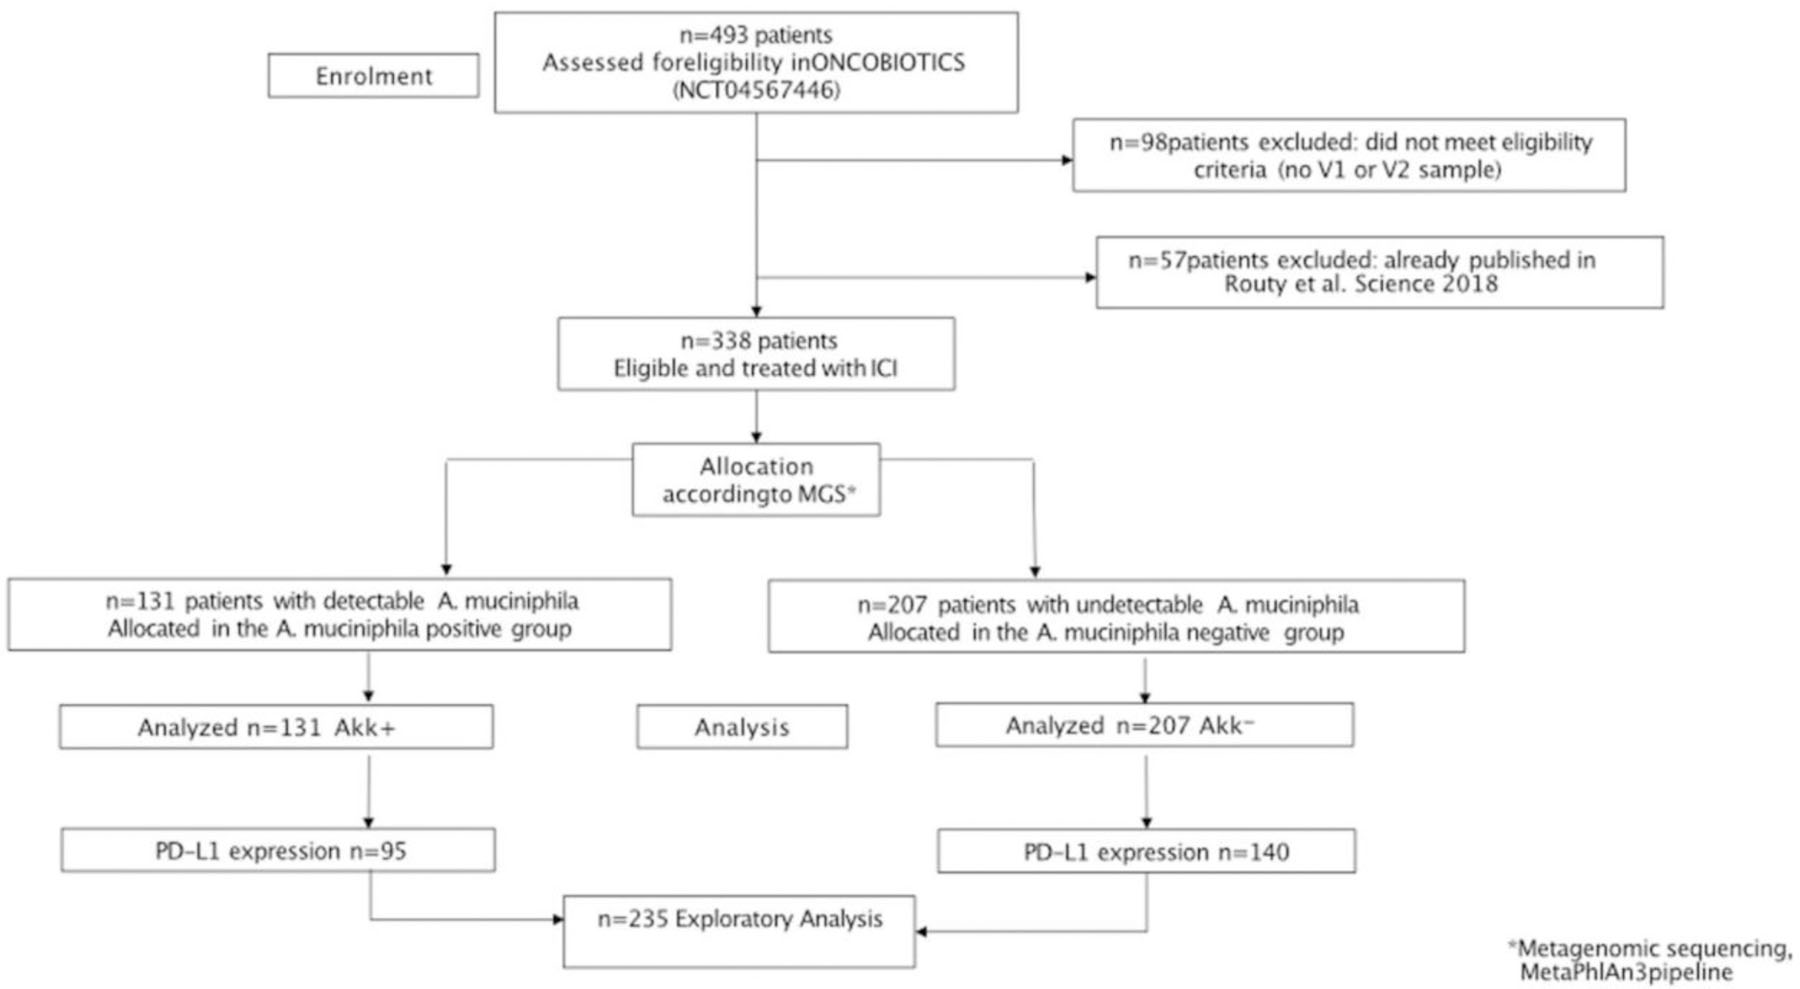
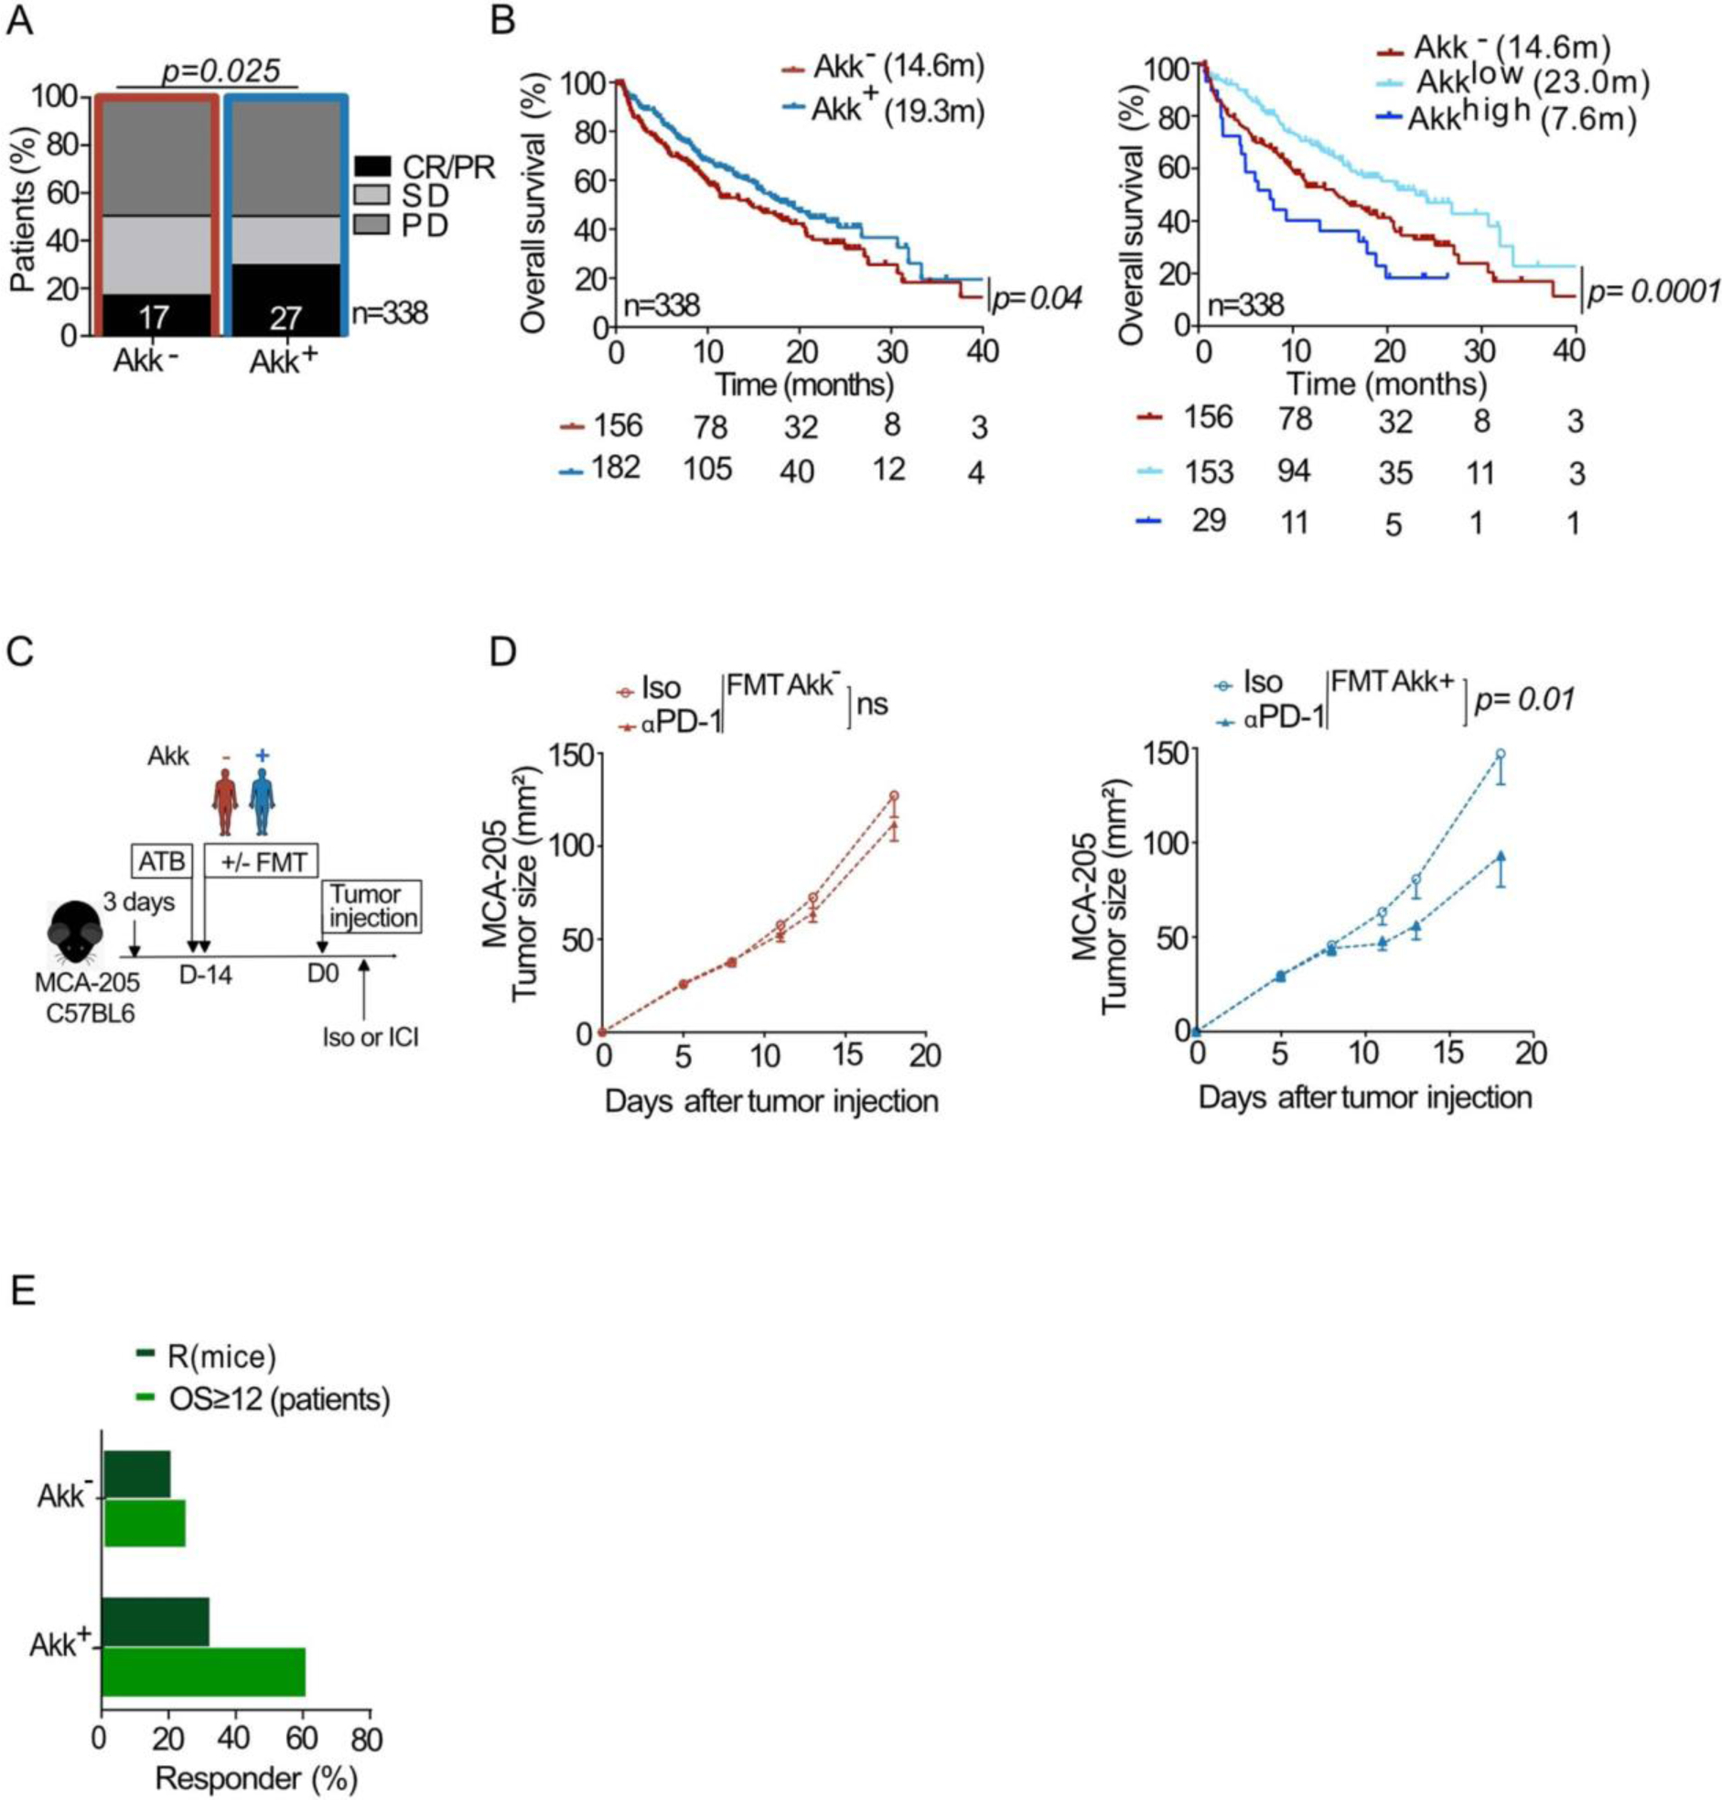
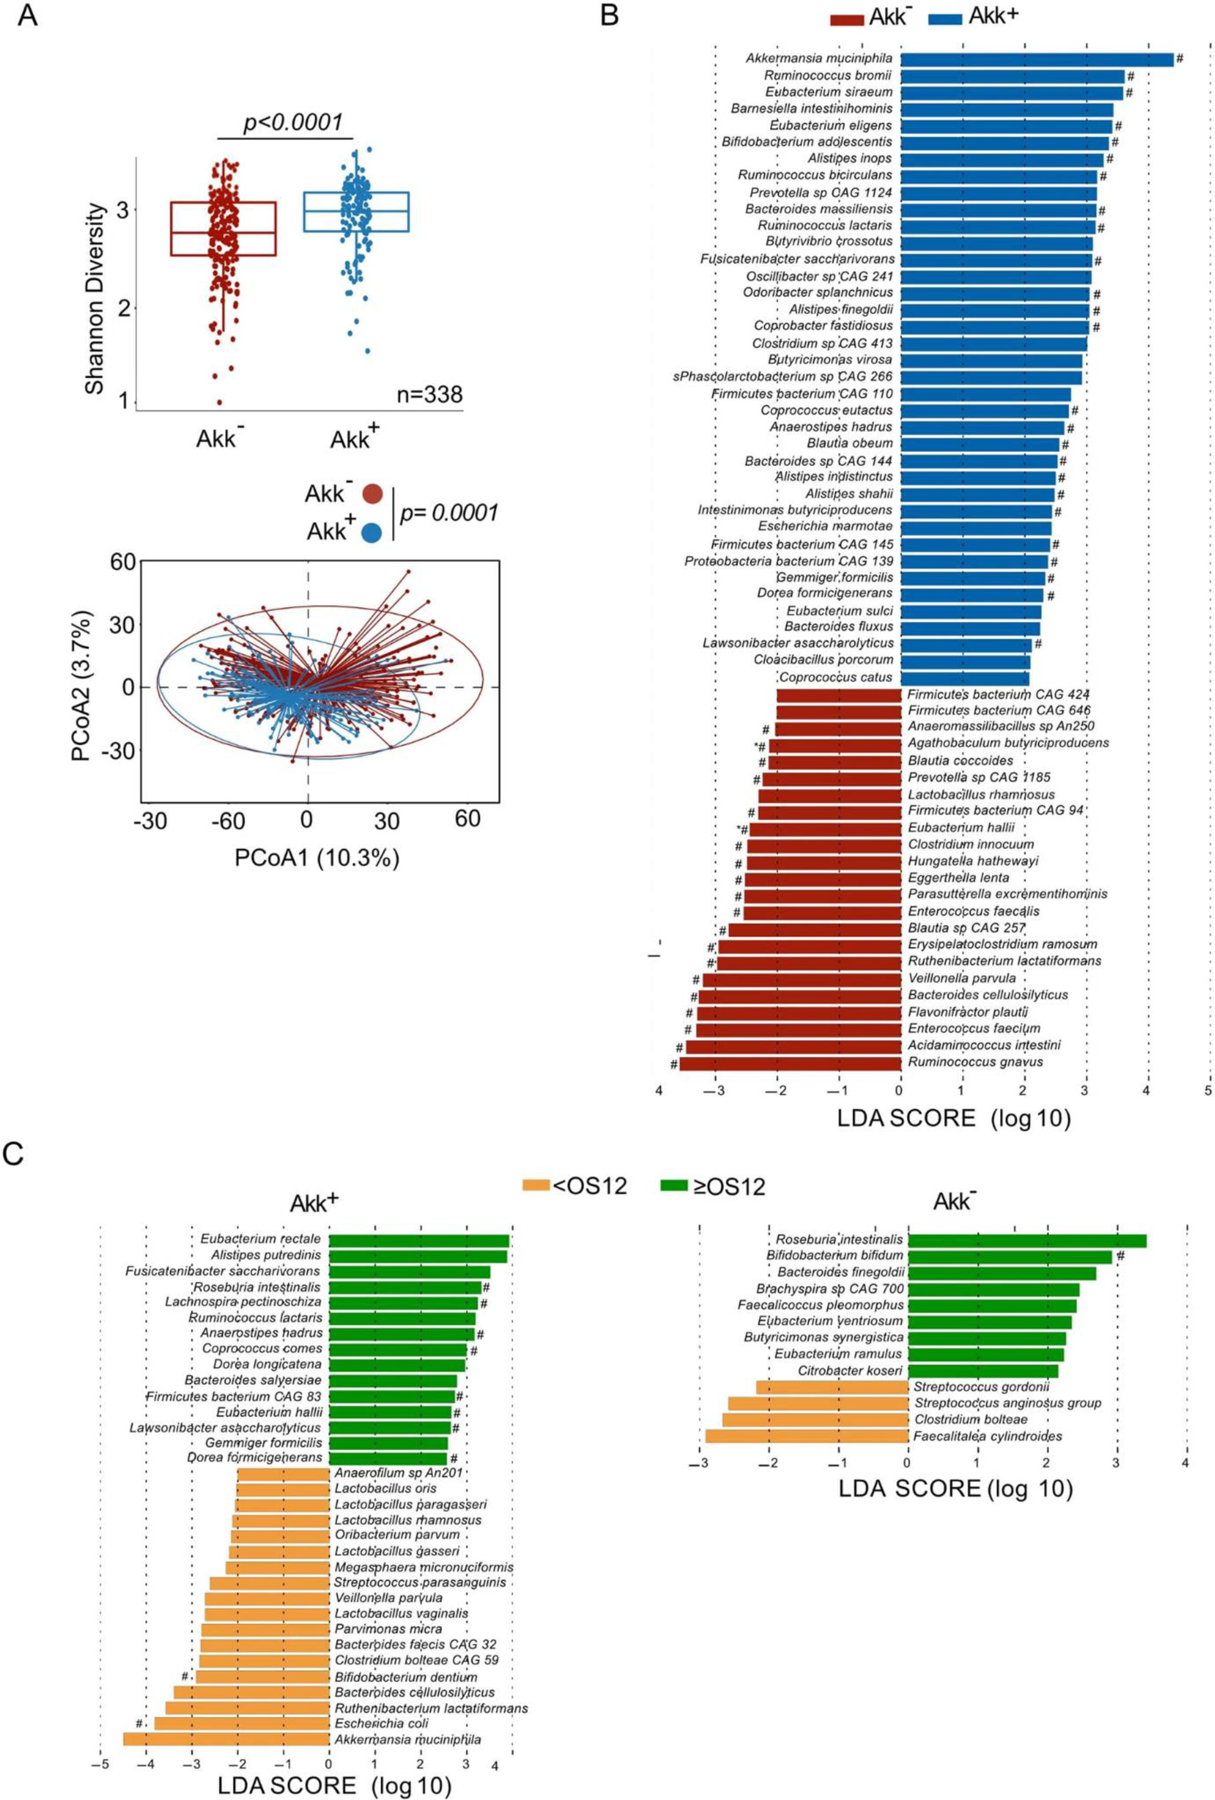
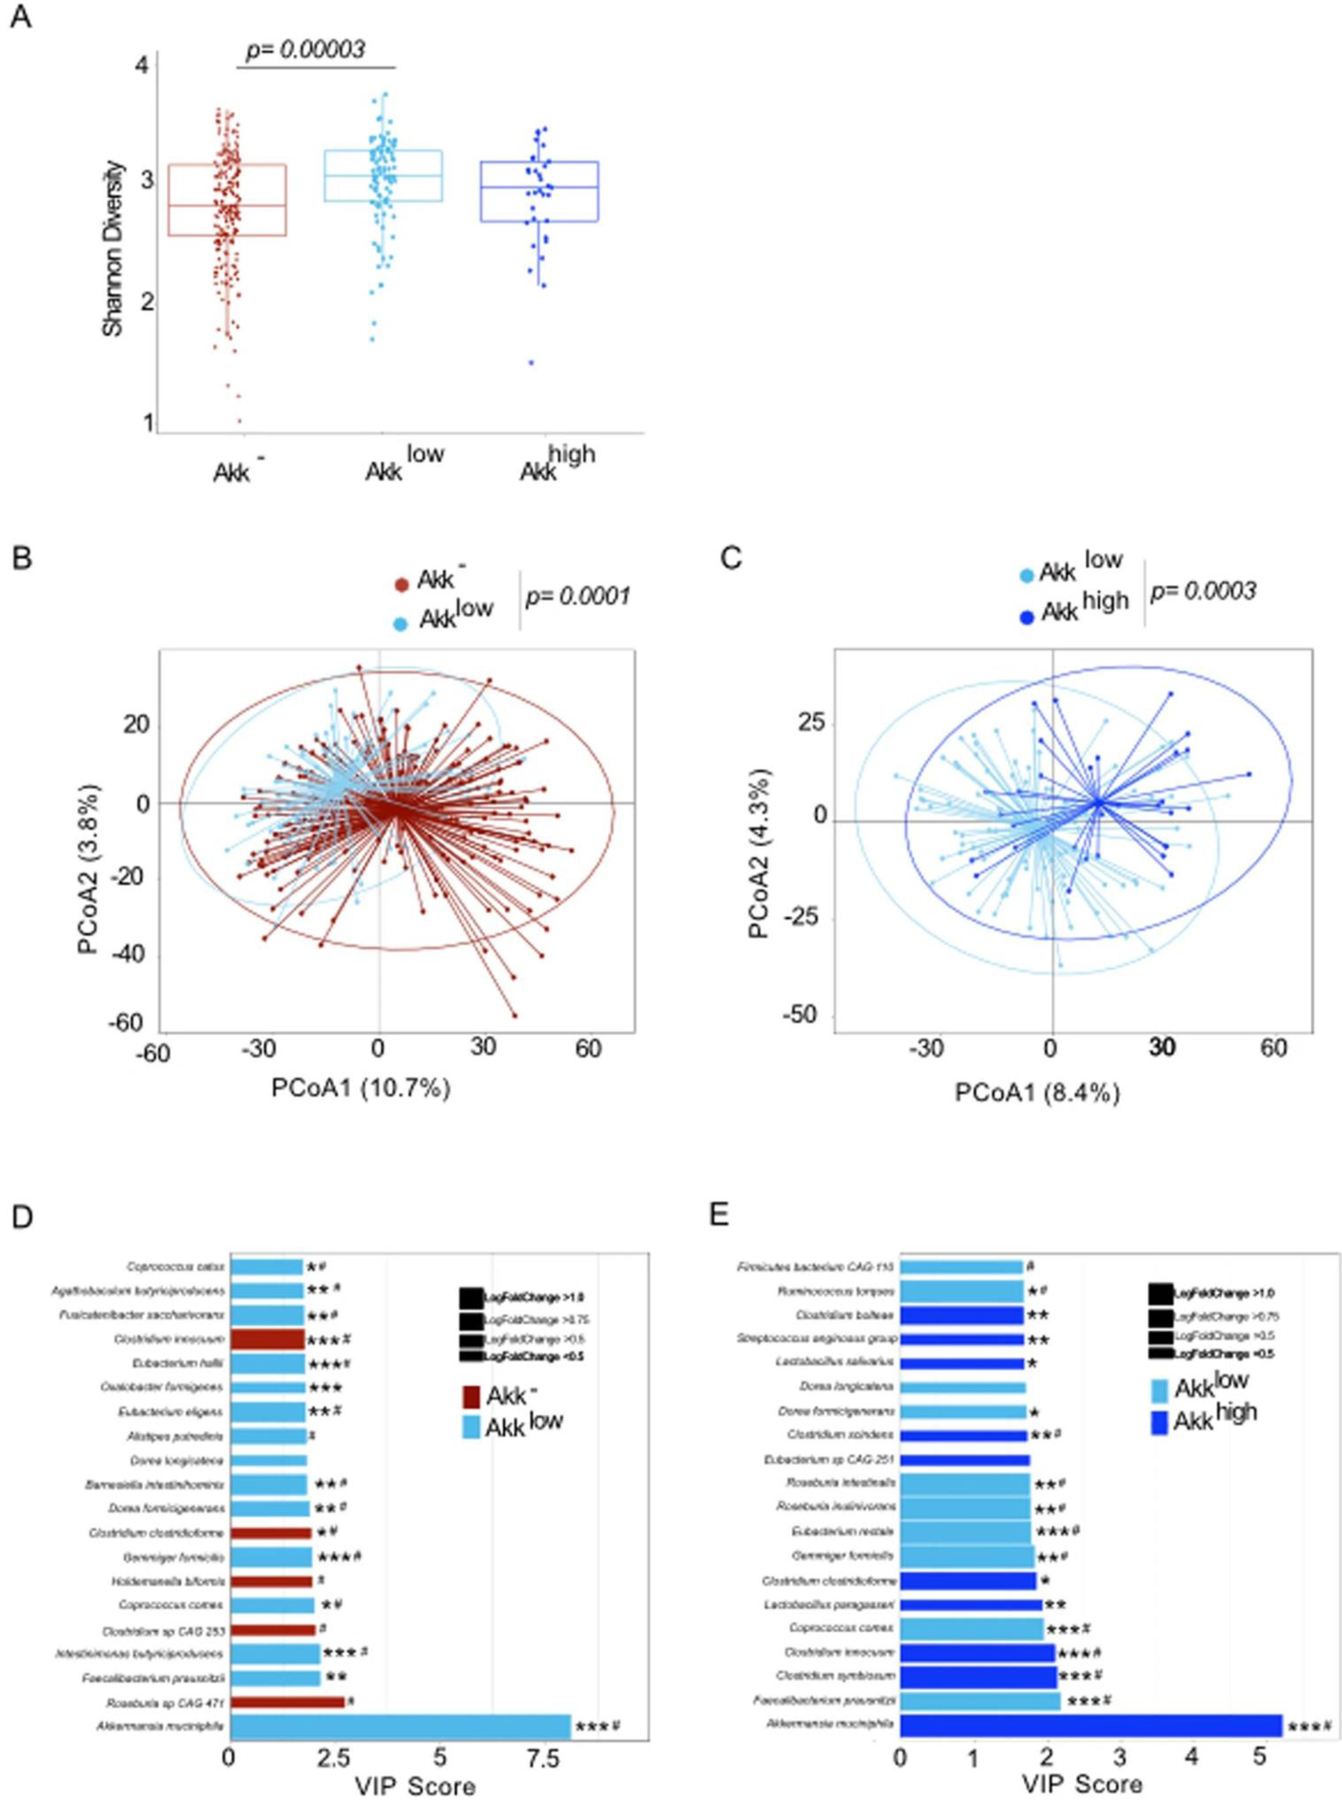
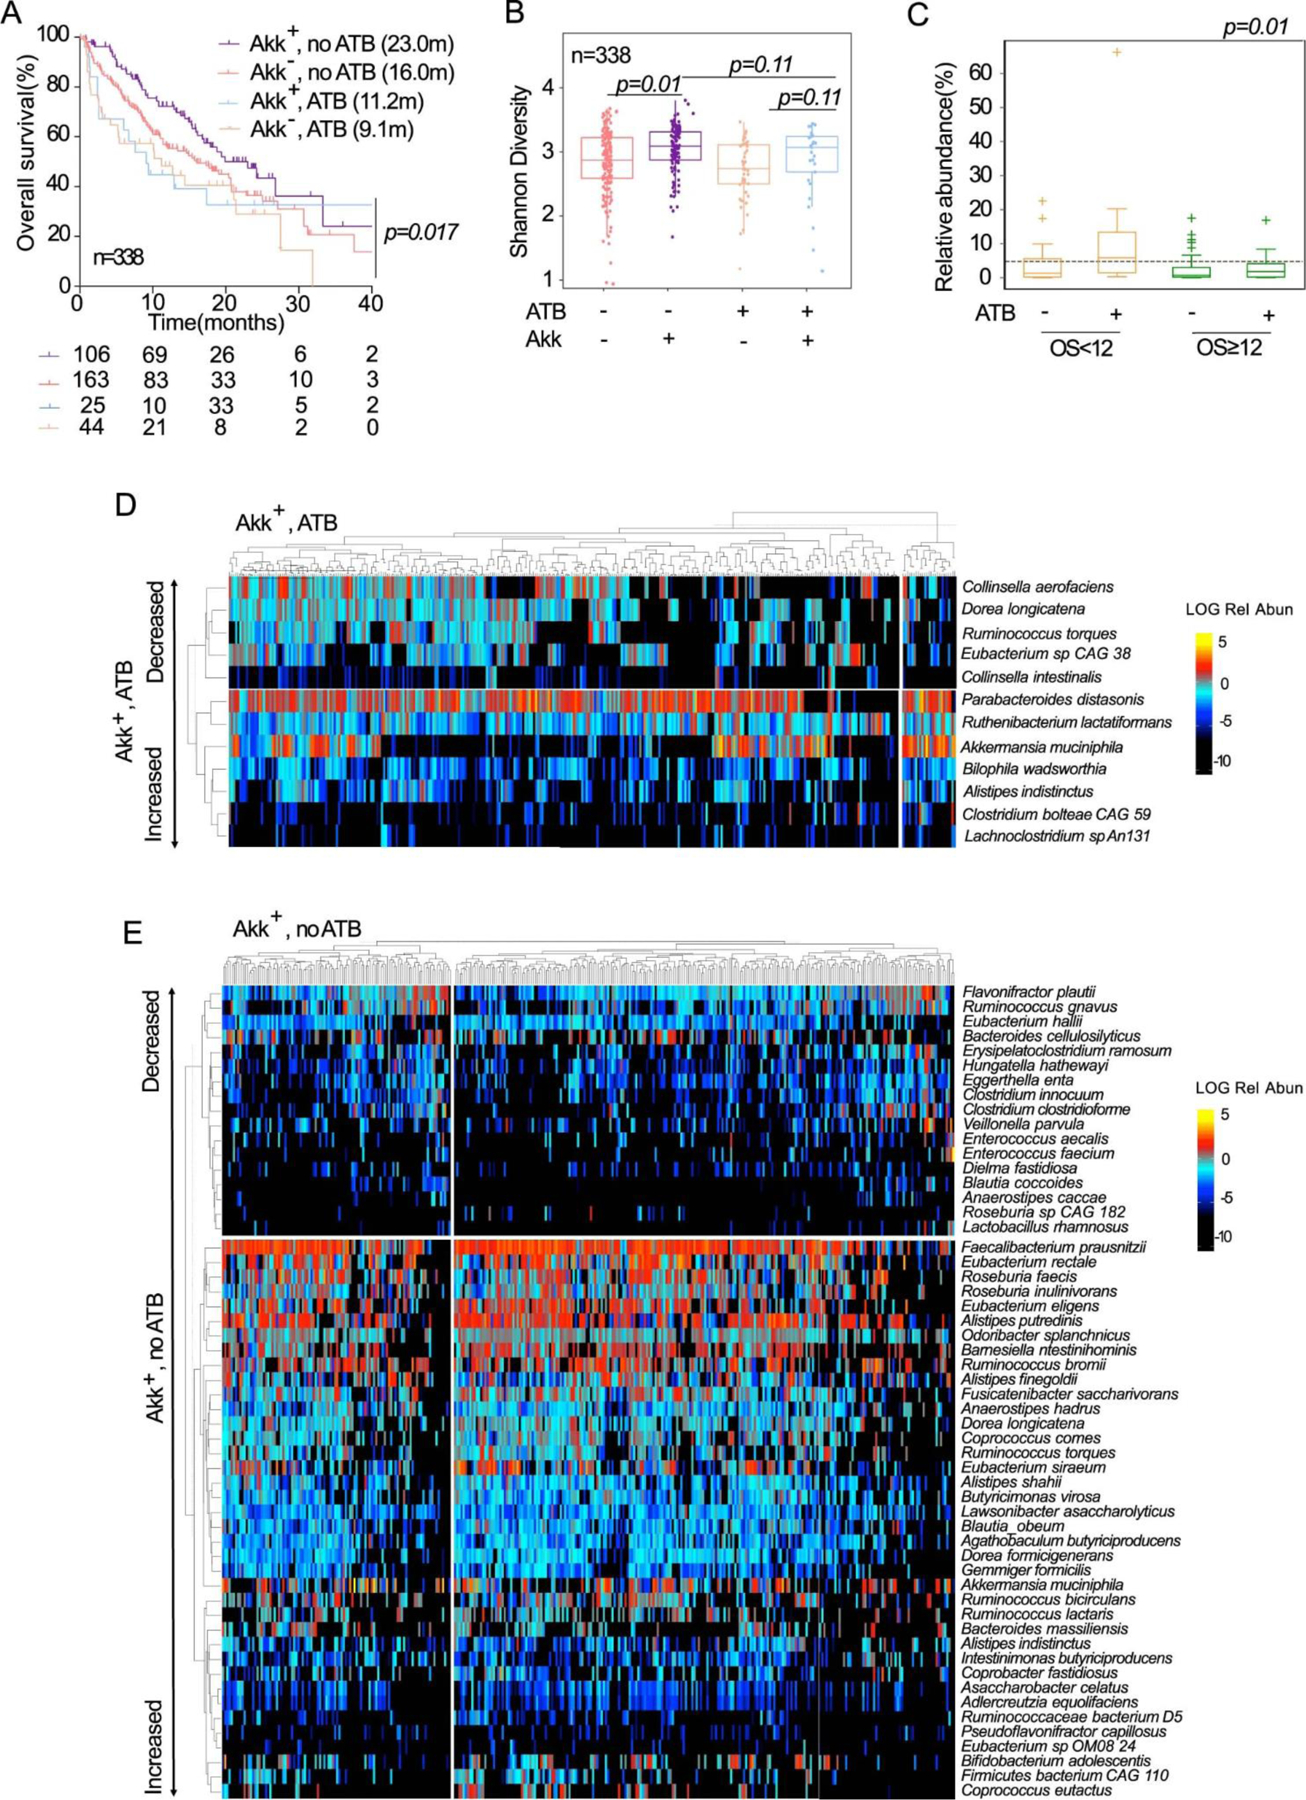
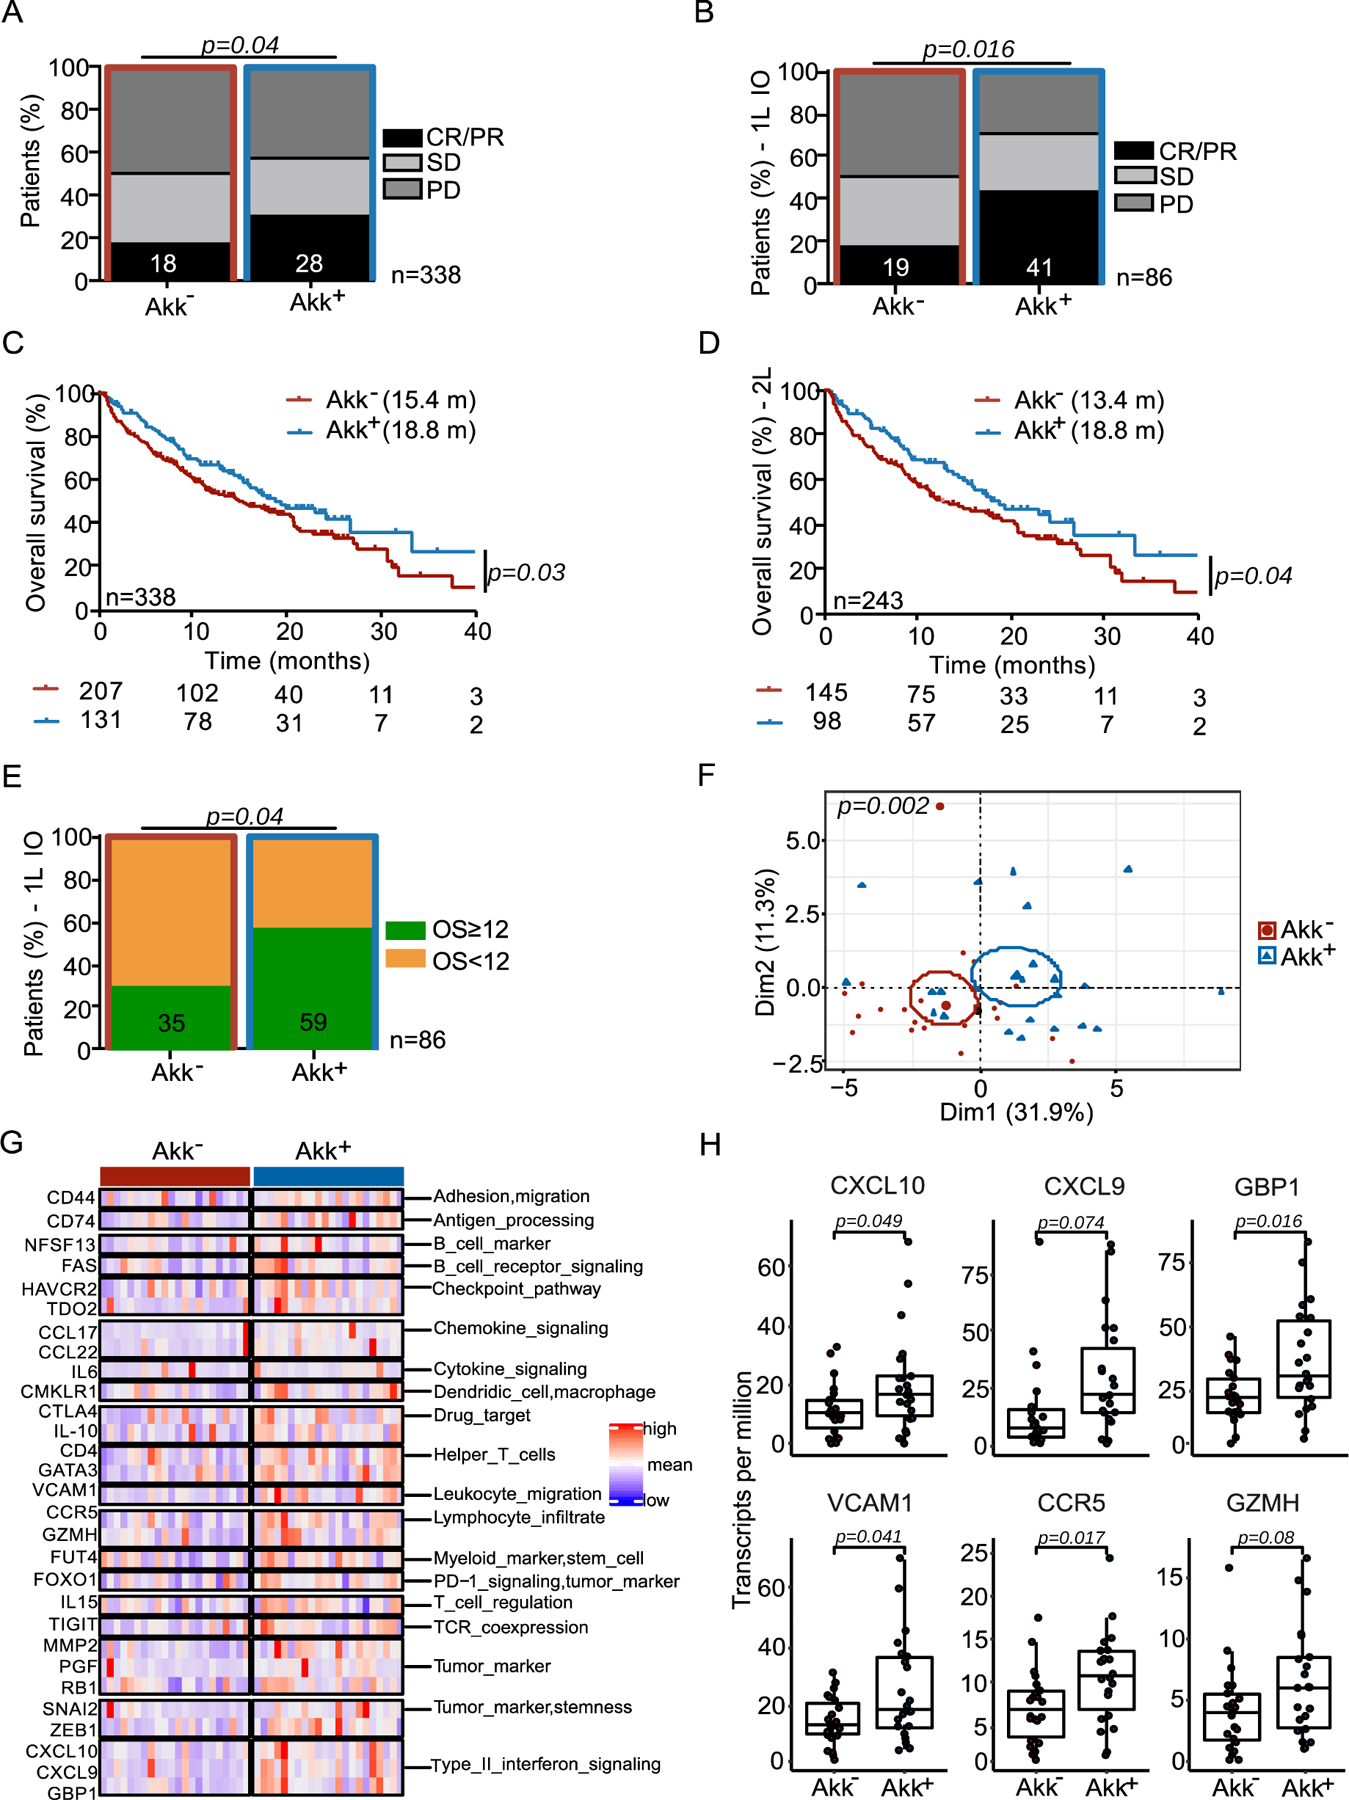
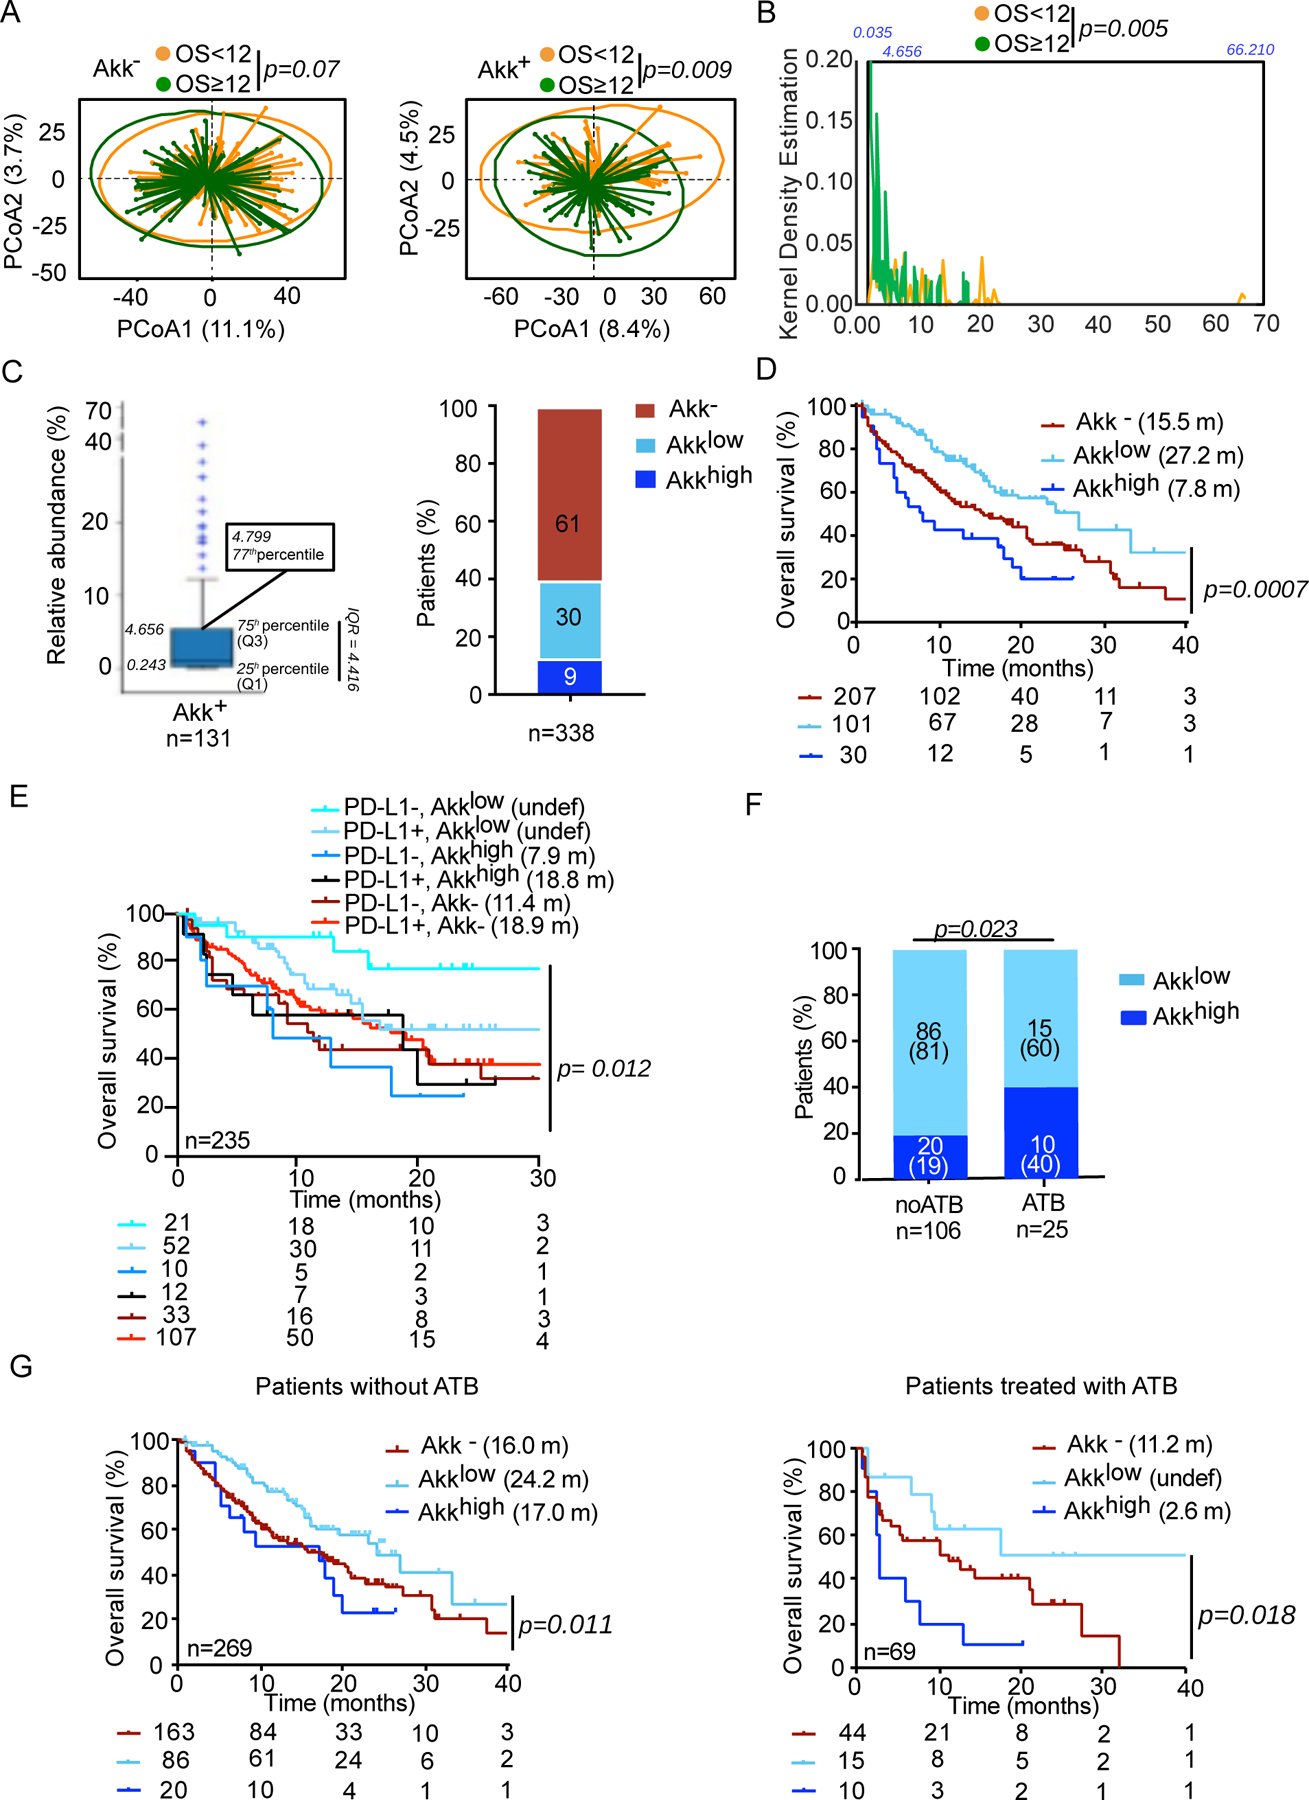
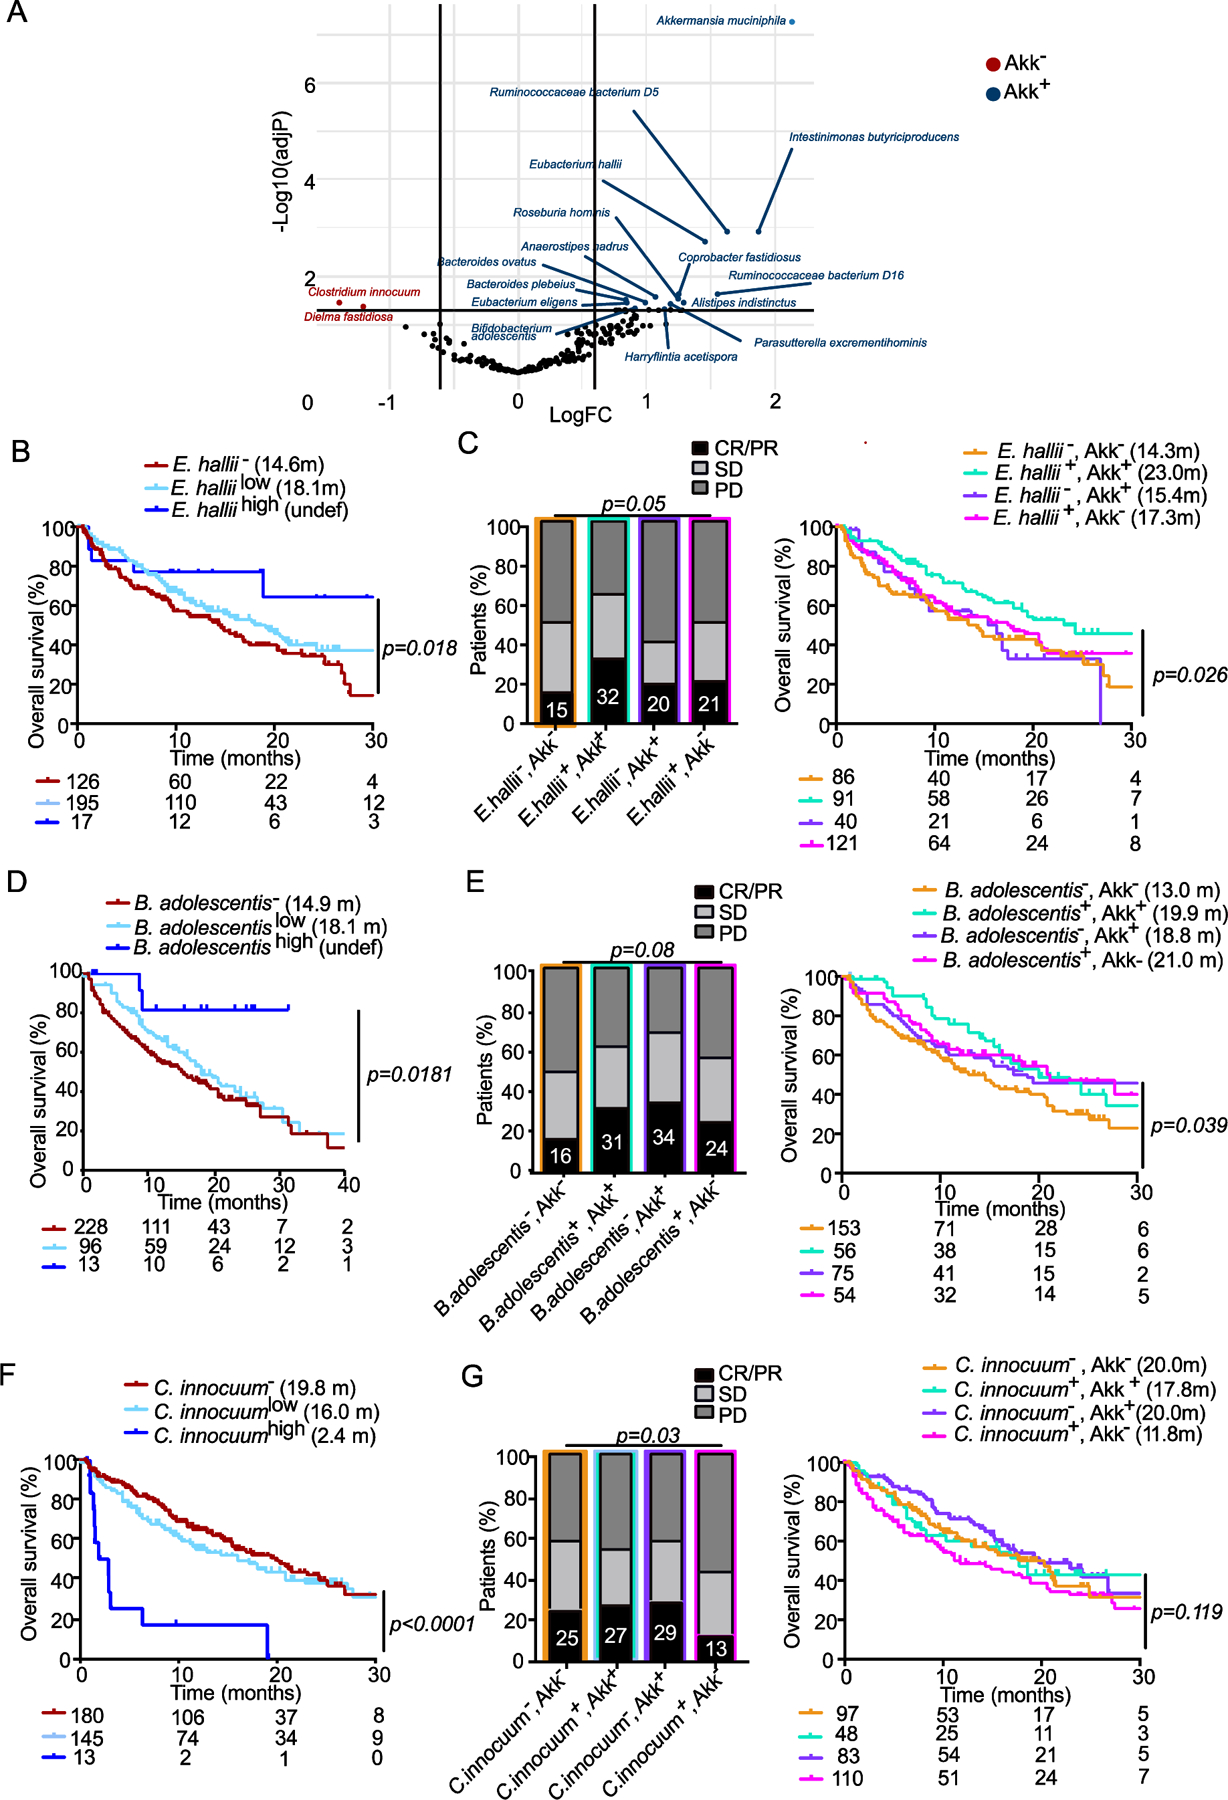
Aside from PD-L1 expression, biomarkers of response to immune checkpoint inhibitors (ICIs) in non-small-cell lung cancer (NSCLC) are needed. In a previous retrospective analysis, we documented that fecal Akkermansia muciniphila (Akk) was associated with clinical benefit of ICI in patients with NSCLC or kidney cancer. In the current study, we performed shotgun-metagenomics-based microbiome profiling in a large cohort of patients with advanced NSCLC (n = 338) treated with first- or second-line ICIs to prospectively validate the predictive value of fecal Akk. Baseline stool Akk was associated with increased objective response rates and overall survival in multivariate analyses, independent of PD-L1 expression, antibiotics, and performance status. Intestinal Akk was accompanied by a richer commensalism, including Eubacterium hallii and Bifidobacterium adolescentis, and a more inflamed tumor microenvironment in a subset of patients. However, antibiotic use (20% of cases) coincided with a relative dominance of Akk above 4.8% accompanied with the genus Clostridium, both associated with resistance to ICI. Our study shows significant differences in relative abundance of Akk that may represent potential biomarkers to refine patient stratification in future studies.


Conflict of interest statement

CONFLICTS OF INTEREST

LZ received research contract from Kaleido and Innovate Pharma and Pilege. LD had consulting, and advisory role for BMS, Sanofi and was supported by Philantropia Fondation Gustave Roussy. GZ received a research grant from Fondation Roche, received fees from Roche, MSD, BMS, Astra-Zeneca and is consultant for Da Volterra & Inventiva. ED reports grants and personal fees from Roche Genentech, grants from Boehringer, grants from Astrazeneca, grants and personal fees from Merck Serono, grants from BMS, and grants from MSD. PD had consulting, and advisory role for AstraZeneca, Bristol-Myers Squibb, Boehringer Ingelheim, Celgene, Daiichi Sankyo, Eli Lilly, Merck, Novartis, Pfizer, prIME Oncology, Peer CME, Roche, Samsung, as well as honoraria from AstraZeneca, Bristol-Myers Squibb, Boehringer Ingelheim, Celgene, Eli Lilly, Merck, Novartis, Pfizer, prIME Oncology, Peer CME, Roche, Samsung. PD ran clinical trials as principal or co-investigator for AstraZeneca, Bristol-Myers Squibb, Boehringer Ingelheim, Eli Lilly, Merck, Novartis, Pfizer, Roche, Medimmun, Sanofi-Aventis, Taiho Pharma, Novocure, Daiichi Sankyo, and received Travel, Accommodation, Expenses: from AstraZeneca, Roche, Novartis, prIME Oncology, Pfizer. FG received honoraria from Amgen,Sanofi, Merk Serono, MSD, BMS, Astra Zeneca, had a consultancy or advisory role for Roche, Enterome and received direct research fundings from Roche, Enterome, Astra Zeneca, Servier and traveling supports from Servier, Amgen, Roche. JCS In the last 2 years consultancy fees from Relay Therapeutics, Gritstone are holds shares from Hookipa, Gritstone, AstraZeneca, Daiichi Sankyo and was a full time employee for AstraZeneca 2017–2019.

Figures

Extended Data Fig. 1:
Consort diagram describing the stool collection in the whole NSCLC ONCOBIOTICS cohort.
Extended Data Fig. 2:
MetaOMineR-based analysis of the association between stool A. muciniphila (Akk) and clinical benefit to ICI in patients. A-B. Correlations between stool prevalence of Akk (MetaOMineR pipeline) and ORR (A) or OS (B) in 1+2L NSCLC patients (N=338, A-B) based on MGS identification of Akk in the MetaOMineR algorithm (INRAE). Chi-square test (A) and Cox regression analysis for median overall survival (OS) depicted in Kaplan Meier curves according to detectable or undetectable Akk (Akk+ or Akk) analyzed in 2 groups (B, left panel) or segregated in 3 groups (Akk−, Akklow and Akkhigh) (B, right panel). Chi-square test P-values are two-sided, with no adjustments made for multiple comparisons (A). The Akk status was compared using the stratified log-rank test. P-values are one-sided with no adjustment (B). C. Experimental setting of avatar mice. FMT of NSCLC patients (Supplementary Table S3) segregated according to the presence or absence of Akk into MCA-205 tumor bearing C57BL/6 mice. Treatments are indicated by arrows (ATB, FMT, anti-PD-1 (ICI) mAbs, or isotype control mAbs (Iso)). D. MCA-205 tumor growth kinetics in each group of FMT according to the prevalence of Akk. in isotype Ctl versus anti-PD-1 mAbs treated mice. Data are presented as mean values +/−SEM of tumor sizes within 6 animals/group. Concatenation of at least n=8 experiments (using a different stool of NSCLC patient) containing 6 mice/group. Tumor sizes according to FMT Akk− (D, left panel) versus Akk+ (D, right panel) are depicted, each dot representing one mouse. Statistics were mixed-effect modeling with specific software ((https://kroemerlab.shinyapps.io/TumGrowth/) for longitudinal tumor growth analysis. P-value are indicated. E. Percentages of responding mice (tumor reduction of>25 % compared with means of controls in the anti-PD-1 mAbs -treated group) and patients (ORR) in each category of stools used for FMT (derived from patients in Supplementary Table S3). CR; complete response. PR; partial response, SD; stable disease, PD; progressive disease.
Extended Data Fig. 3:
Metagenomic species characterizing Akk+ stools and patient survival. Shannon diversity index representing stool alpha diversity in Akk+ and Akk− groups of fecal specimens (N=338) (A, upper panel). Beta-diversity measured by Bray-Curtis Index represented by Principal Coordinates analysis (PCoA) between Akk+ versus Akk− groups in the whole cohort of 1+2L (A, lower panel). p-values were calculated using PERMANOVA with 999 permutations. The lower and the upper hinges of boxplots corresponds to the 25th and 75th percentiles, respectively. The midline is the median. The upper and lower whiskers extend from the hinges to the largest (or smallest) value no further than 1.5 interquartile range from the hinge, defined as the distance between the 25th and 75th percentiles. P-values were calculated testing the null hypothesis and using a two-sided test. Exact p-value: 3.84573e-05. B-C. Differential abundance of metagenomic species measured by linear discriminant analysis of effect size (LEfSe) according to the presence of A. muciniphila (Akk) (B) and the OS at 12 months (C) within Akk+ group (C, left panel) and Akk− group (C, right panel). LDA; Linear discriminant analysis. OS: overall survival. P-values were calculated using a two-sided nonparametric factorial Kruskal-Wallis (KW) sum-rank test. # Multivariate analysis (ANCOM-BC/Maaslin2) with a false discovery rate (FDR) adjusted p-value <0.2.
Extended Data Fig. 4:
Compositional taxonomic differences in stools of NSCLC patients segregated according to Akk relative abundance. A. Alpha diversity according to Akk relative abundance segregated in 3 groups Akk−: undetectable Akk, Akklow: A. muciniphila relative abundance between 0.035–4.799% (<77th percentile of positive samples), and Akkhigh: 4.799% (> 77th percentile) (N=338). The lower and upper hinges of boxplots correspond to the 25th and 75th percentiles, respectively. The midline is the median. The upper and lower whiskers extend from the hinges to the largest (or smallest) value no further than ×1.5 interquartile range from the hinge, defined as the distance between the 25th and 75th percentiles. P-values were calculated using a two-sided nonparametric Wilcoxon sum-rank test. B-C. Beta-diversity using PCoA between Akk− and Akklow (B) and between Akklow and Akkhigh (C) p-values were calculated using PERMANOVA with 999 permutations. The PERMANOVA test compares groups of objects and tests the null hypothesis that the centroids and dispersion of the groups are equivalent. The P-value is calculated by comparing the actual F test to that gained from (in this case 999) random permutations of the objects between the groups. If p <0.05, the null hypothesis is disregarded and we conclude that the centroids and dispersion between the groups are not equivalent. D-E. Variable importance plot (VIP) discriminant analysis of taxonomic stool composition according to Akk relative abundance, between Akk− versus Akklow (D) and Akklow versus Akkhigh (E). Differences in bacterial prevalence and abundance in fold ratios are indicated in these VIP plots. VIP: Variable importance plot. * p <0.05,** p <0.01, *** p <0.001. P-values were calculated using a two-sided nonparametric Wilcoxon sum-rank test. # Multivariate analysis (ANCOM-BC/Maaslin2) with a false discovery rate (FDR) adjusted p-value <0.2.
Extended Data Fig. 5:
Interaction between ATB and A.muciniphila on survival and microbiome composition. A. Kaplan-Meier curve and Cox regression analysis of overall survival in the n=338 patients according to detectable versus undetectable Akk (Akk+ and Akk−) and ATB use (noATB: no exposure to ATB, ATB: antibiotics exposure within 2 months prior to ICI initiation). The Akk status and ATB use were compared using the stratified log-rank test. P-values are one-sided with no adjustment. B. Shannon diversity index representing stool alpha diversity in Akk+ and Akk− groups of fecal specimen from patients exposed or not to ATB (N=338). The lower and upper hinges of boxplots correspond to the 25th and 75th percentiles, respectively. The midline is the median. The upper and lower whiskers extend from the hinges to the largest (or smallest) value no further than ×1.5 interquartile range from the hinge, defined as the distance between the 25th and 75th percentiles. P-values were calculated using a two-sided nonparametric Wilcoxon sum-rank test. C. Box Plots representing the relative abundance (mean+/−SEM) of Akk according to overall survival at 12 months and exposure or not to ATB in n=338 patients. The lower and upper hinges of boxplots correspond to the 25th and 75th percentiles, respectively. The midline is the median. The upper and lower whiskers extend from the hinges to the largest (or smallest) value no further than ×1.5 interquartile range from the hinge, defined as the distance between the 25th and 75th percentiles. The test used was Kruskal-Wallis, two-sided, 5% level of significance. No adjustments were made for multiple comparisons. D. Heatmap showing differentially abundant species identified in stools with detectable Akk (Akk+) in patients exposed to (D) or not exposed to (E) ATB within 2 months prior to ICI initiation. Species were identified using a non-parametric Kruskall-Wallis test comparing 4 groups made up of 2 variables: Akkermansia muciniphila presence/absence and antibiotic use. The figure shows species’ abundances across samples whose False Discovery Rate (FDR) was <0.2 in the KW test and whose Wilcoxon Rank Sum Test p-value was <0.05 when comparing the highlighted group to the rest.
Extended Data Fig. 6:
Akkp2261 modulated the murine microbiome composition, rescuing responsiveness to PD-1 blockade. A. Experimental setting. After 3 days of ATB, FMT was performed in mice by oral gavage using patient stools classified according to Akk (Akk+ and Akk−). 14 days later, MCA-205 tumors were i.d inoculated, and mice were treated with anti-PD-1 or iso-control mAbs 4 times every 3 days concomitantly with oral supplementation of Akkp2261 four times every 3 days. B-D. Mean MCA-205 tumor sizes+/−SEM are depicted at day 12 after 4 therapeutic injections of anti-PD-1 mAbs, in each FMT groups (Akk+ and Akk−) supplemented or not with Akkp2261 as well as in animals reared in SPF conditions (FMT-). Concatenation of>25 experiments using n=53 mice in Iso group, n=51 in Iso FMT+ group, n=56 in anti-PD-1 and anti-PD-1 FMT+ groups. Each experiment comprising 6 mice/group and was performed at least 2 times for each FMT (Supplementary Table S6) (B). Tumor sizes according to FMT Akk− (C left, n=72/group; C right, n=49 in Iso group and n=48 in other groups) versus Akk+ (D left, n=6/group, D right, n=12 in Iso and anti-PD-1 groups, n=14 in anti-PD-1 with Akkp2261) are depicted, each dot representing one mouse. Statistics were mixed-effect modeling with specific software ((https://kroemerlab.shinyapps.io/TumGrowth/) for longitudinal tumor growth analysis (D) and Mann–Whitney U-test (B-C) to compare two independent groups (after Kruskal–Wallis test was implemented using Dunn’s test for multiple groups). ns=not significant. E. Clustermap of ratios of Akkp2261-related tumor reduction at day 12–15 following PD-1 mAbs in FMT normalized onto ratios obtained in SPF mice. The relative tumor size reduction follows a blue color code (the darker the greater; R, Responders)). 29 FMT were performed according to A. N=29–30 mice/group in total. Each experiment contained 6 mice/group and was performed 2–3 times for each tumor model (E, left panel). 16S rRNA sequencing of gene amplicons of stools harvested in recipient avatar tumor bearers at day 12 post-4 injections of anti-PD-1 Abs and 4 oral gavages with Akkp2261 divided into green (R) and red (NR) groups. VIP plot repartition of discriminant metagenomic species segregating groups of mice that responded to oral Akkp2261 (R, green bars) or not (NR, red bars). (E, right panel). Asterisks represent significant Mann-Whitney U test without FDR at 10%. * p <0.05, ** p <0.01, *** p <0.001. P-values were calculated using a two-sided nonparametric Wilcoxon sum-rank test. Adjustments for multiple comparisons were not made.
Figure 1.
Figure 1.. Stool A. muciniphila (Akk) is associated with ICI clinical benefit.
A-B Correlations between stool Akk and ORR in 1L+2L (n=338) and 1L immunotherapy NSCLC (n=86) patients. CR; complete response. PR; partial response, SD; stable disease, PD; progressive disease analyzed using Chi-square test. C-D Kaplan-Meier curves and Cox regression analyses of overall survival (OS) of 1L+2L (n=338) and 2L (n=243) according to Akk status. E. Difference of the intestinal prevalence of Akk between patients with OS < 12 months versus > 12 months in 1L immunotherapy (IO) analyzed using Chi-square test. F-H. RNA sequencing of tumor biopsies in a sub-group of 44 NSCLC patients (17 non-metastatic and 27 metastatic patients, Table S3). F. Principal Component Analysis (PCoA) of the differentially expressed genes according to intestinal prevalence of Akk, using the 395 immune-related gene selection of the Oncomine Immune Response Research Assay indicating significant differences using a Mann-Whitney p-value < 0.10 through PERMANOVA test using Euclidian distance. G. Heatmap of the differentially expressed gene products after normalization (between Akk+ vs Akk− patients) classified by category. H. Boxplot of selected gene expression values according to Akk groups. Differences between groups were assessed with Mann-Whitney tests. C-X-C motif chemokine ligand 10 (CXCL10), C-X-C motif chemokine ligand 9 (CXCL9), Guanylate binding protein 1 (GBP1), Vascular cell adhesion protein 1 (VCAM1), C-C chemokine receptor type 5 (CCR5), Granzyme H (GZMH).
Figure 2.
Figure 2.. Akk relative abundance represents a prognostic marker of ICI.
A. Beta-diversity measured by Bray-Curtis Index represented by Principal Coordinates analysis (PCoA) between Akk versus Akk+ groups between OS < or ≥ 12 months within each subgroup. OS; overall survival. p-values were calculated using PERMANOVA with 999 permutations. B. Kernel density estimation aligning two variables, OS < or ≥ 12 and relative abundance of Akk in the entire cohort of 338 patients. C. Distribution of the relative abundance of Akk in patients with detectable Akk according to 77th percentile (left panel) and percentages of patients within each of the three groups of Akk relative abundance (right panel). Akk: undetectable Akk, Akklow: Akk relative abundance between 0.035–4.799%, Akkhigh: >4.799% (77th percentile). D-E. Kaplan-Meier curve and Cox regression multivariate analysis of overall survival in 338 NSCLC patients according to Akk relative abundance segregated in 3 groups (Akk, Akklow and Akkhigh) (D) and considering PD-L1 expression (E). F. Distribution of patients according to Akk relative abundance segregated in 2 groups (Akklow and Akkhigh) and ATB use (noATB: no exposure to ATB, ATB: antibiotics exposure within 2 months prior to ICI initiation). G. Kaplan-Meier curve and Cox regression multivariate analysis of overall survival in 338 NSCLC patients according to Akk relative abundance segregated in 3 groups (Akk, Akklow and Akkhigh) and ATB use (noATB n=269, left panel and ATB n=69, right panel).
Figure 3.
Figure 3.. Stratification of clinical outcome based on other components of the Akk - associated ecosystem.
A. Volcano plot (indicating Fold Change (FC) and p-values in ANOVA statistical analyses) to segregate taxonomic species (with a prevalence> 2.5%) according to their relative abundance in baseline fecal specimen of 338 patients based on their association with Akk: species significantly associated with or excluded from Akk enriched ecosystems (Akk+, blue dots, Akk, red dots) B, D, F. Kaplan Meier overall survival curves in 338 NSCLC patients according to the trichotomic distribution of the relative abundance of beneficial or harmful bacteria (undetectable bacterium: , low versus high) retained in the LEfSe model, MaAsLin2 and the Volcano plot/ANOVA Table S6). C, E, G. Influence of collateral bacteria associated with Akk (retained in Table S6) in the Akk-associated impact on ORR and OS in a dichotomic pattern (presence/absence) using Chi-square test (for ORR, left panels) and Cox regression multivariate analysis for Kaplan Meier curves (right panels). CR; complete response. PR; partial response, SD; stable disease, PD; progressive disease.

Comment in

References

    1. Herbst RS et al. Pembrolizumab versus docetaxel for previously treated, PD-L1-positive, advanced non-small-cell lung cancer (KEYNOTE-010): a randomised controlled trial. The Lancet 387, 1540–1550 (2016). - PubMed
    1. Brahmer J et al. Nivolumab versus Docetaxel in Advanced Squamous-Cell Non–Small-cell Lung Cancer. N. Engl. J. Med 373, 123–135 (2015). - PMC - PubMed
    1. Borghaei H et al. Nivolumab versus Docetaxel in Advanced Nonsquamous Non–Small-cell Lung Cancer. N. Engl. J. Med 373, 1627–1639 (2015). - PMC - PubMed
    1. Gandhi L et al. Pembrolizumab plus chemotherapy in metastatic non-small-cell lung cancer. N. Engl. J. Med 378, 2078–2092 (2018). - PubMed
    1. Paz-Ares L et al. Pembrolizumab plus Chemotherapy for Squamous Non–Small-Cell Lung Cancer. N. Engl. J. Med 379, 2040–2051 (2018). - PubMed

Publication types

MeSH terms

Substances

Supplementary concepts