. 2022 Feb;3(2):188-202.
doi: 10.1038/s43018-021-00316-3. Epub 2022 Feb 3.

SETD2 loss perturbs the kidney cancer epigenetic landscape to promote metastasis and engenders actionable dependencies on histone chaperone complexes

Affiliations

SETD2 loss perturbs the kidney cancer epigenetic landscape to promote metastasis and engenders actionable dependencies on histone chaperone complexes

Yuchen Xie et al. Nat Cancer. 2022 Feb.

Abstract

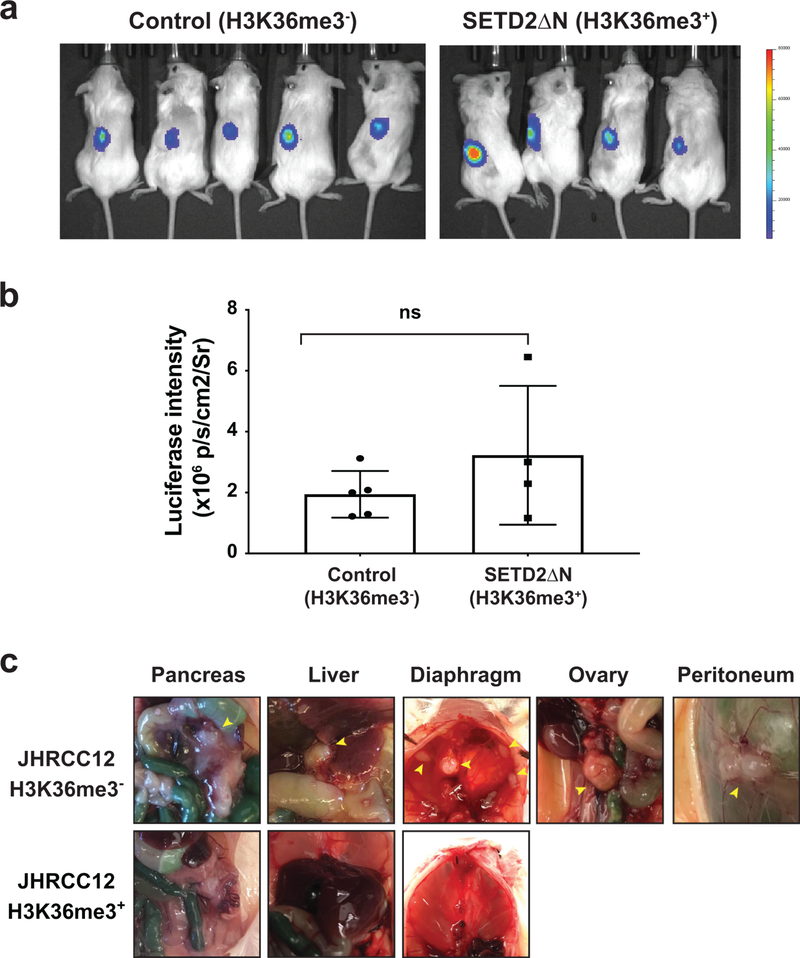
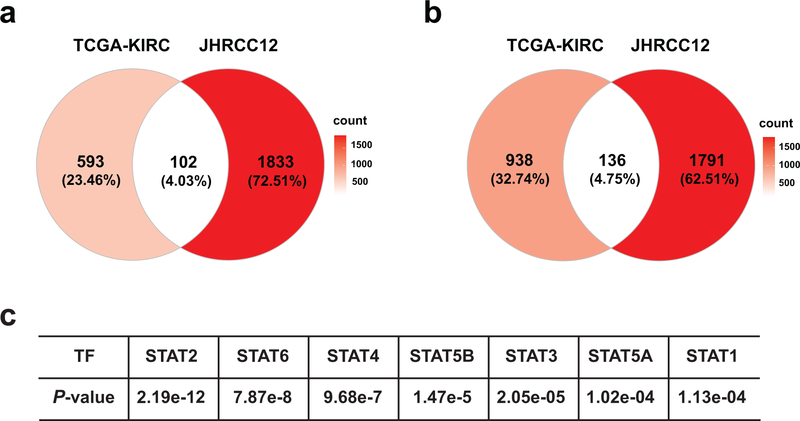
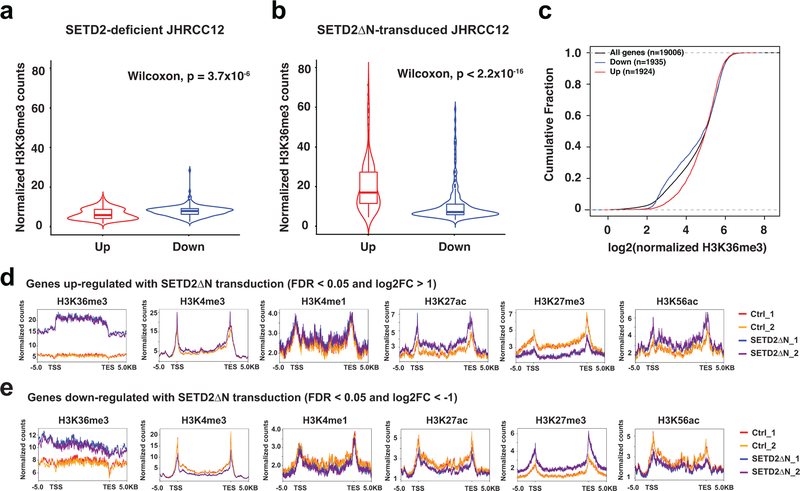
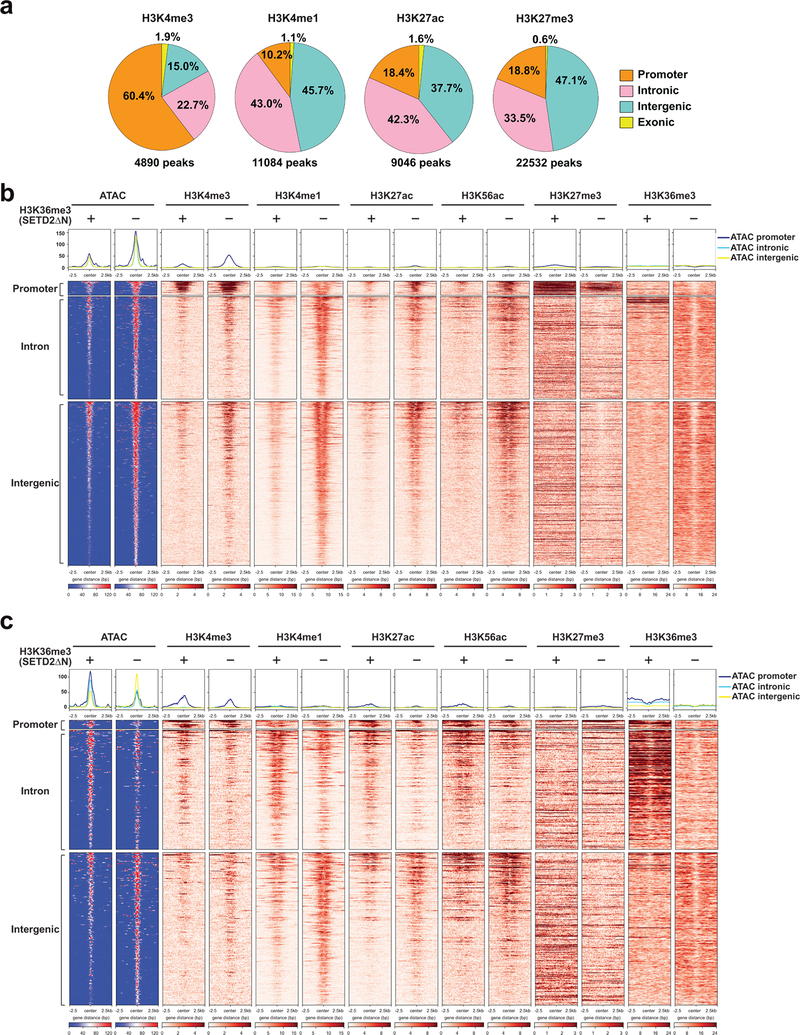
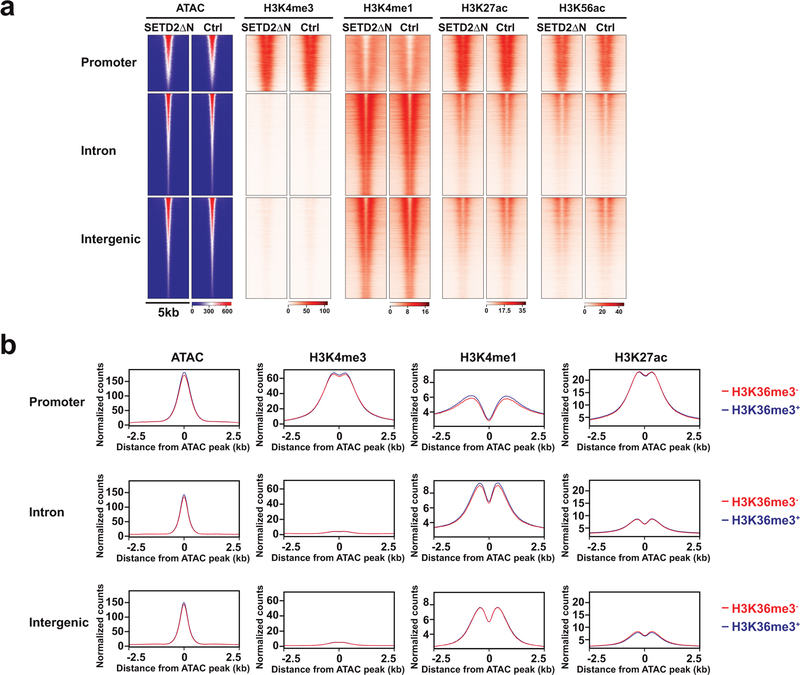
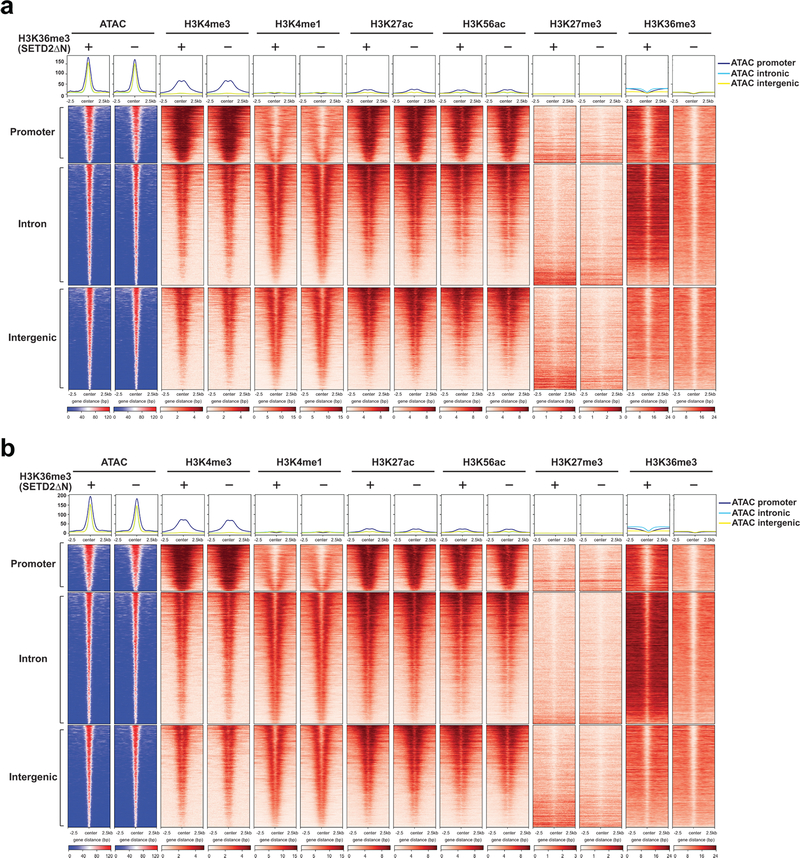
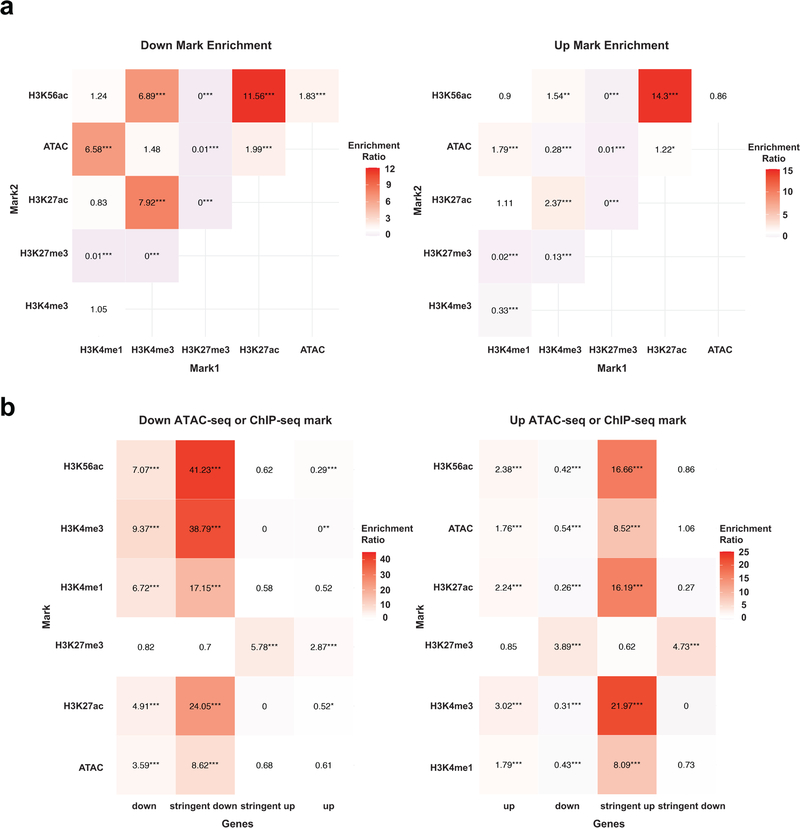
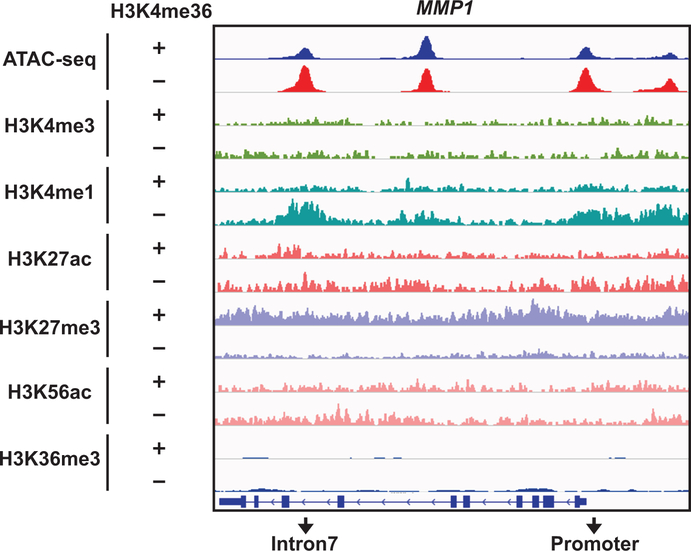
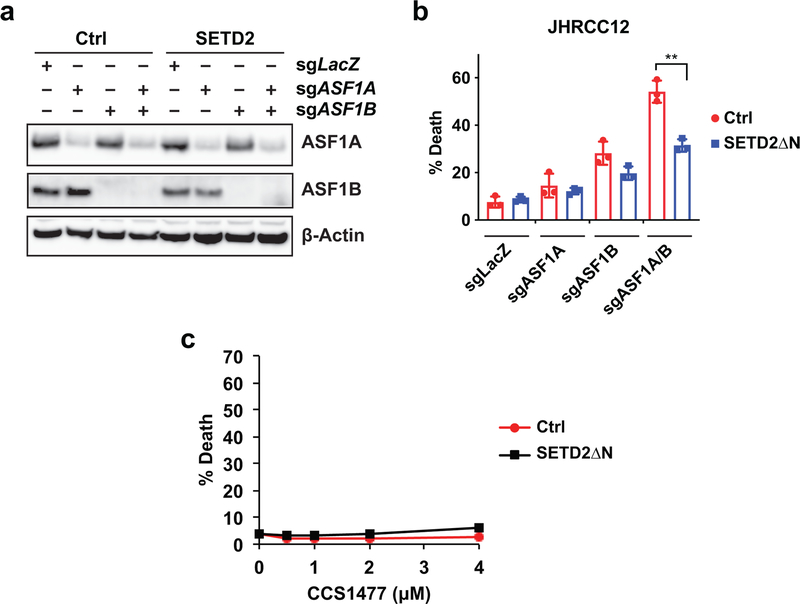
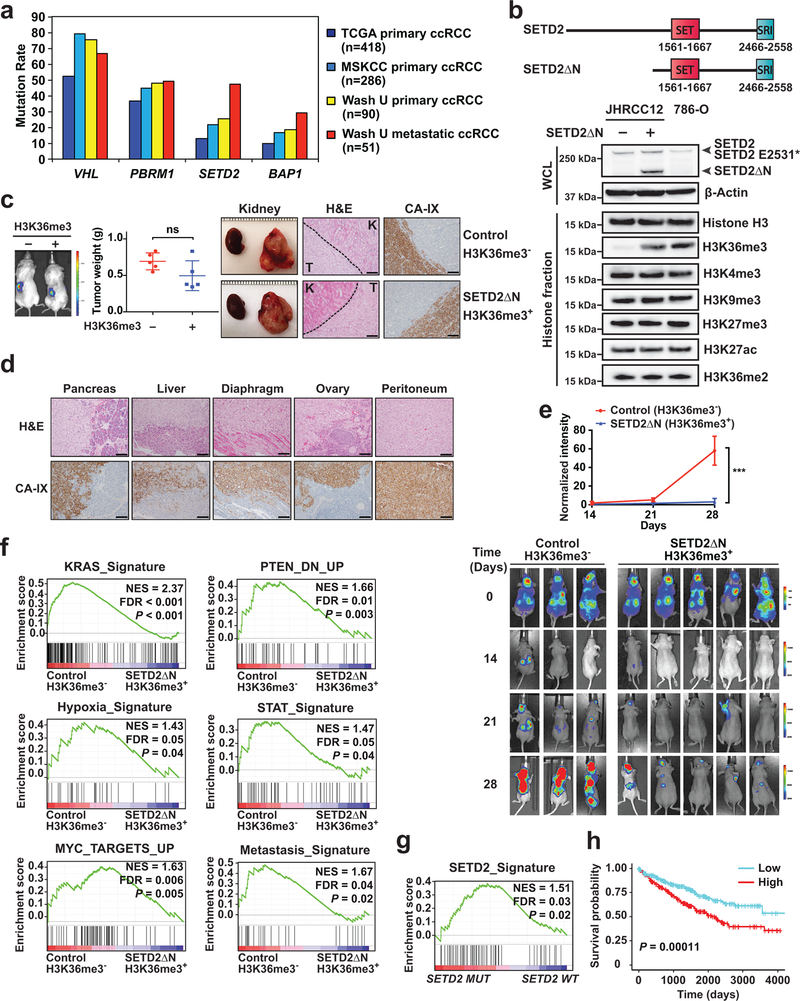
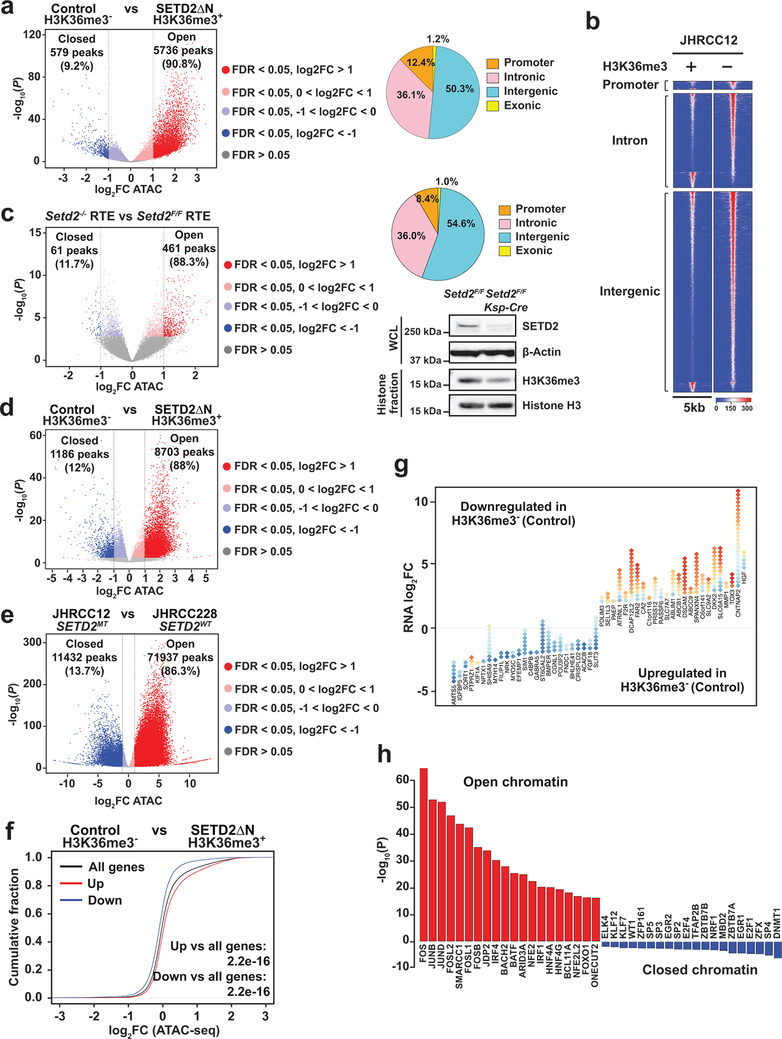
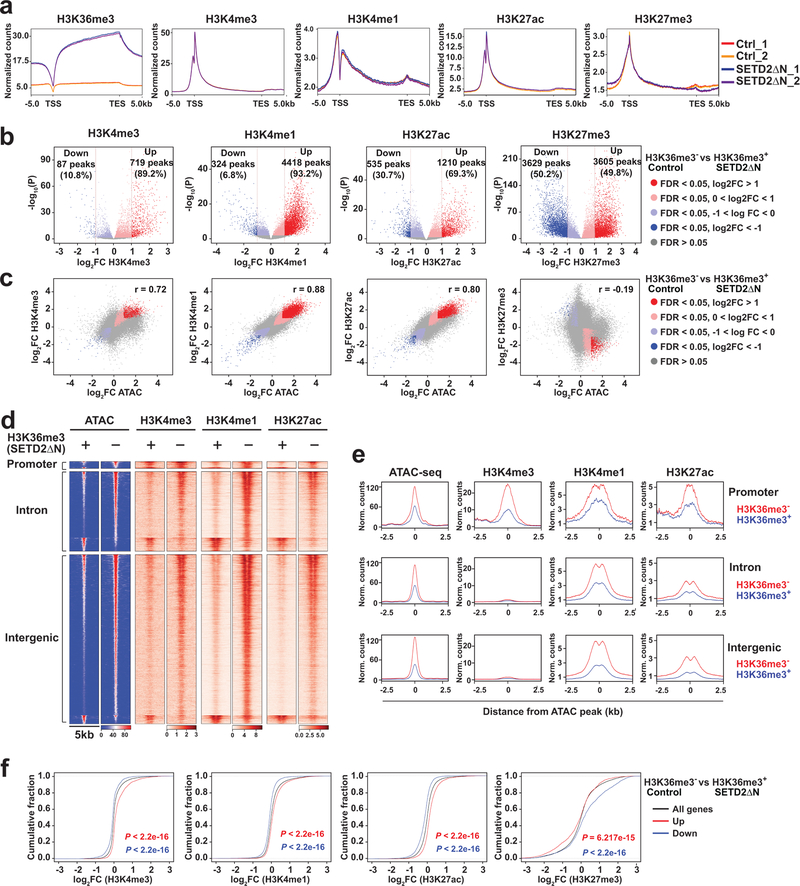
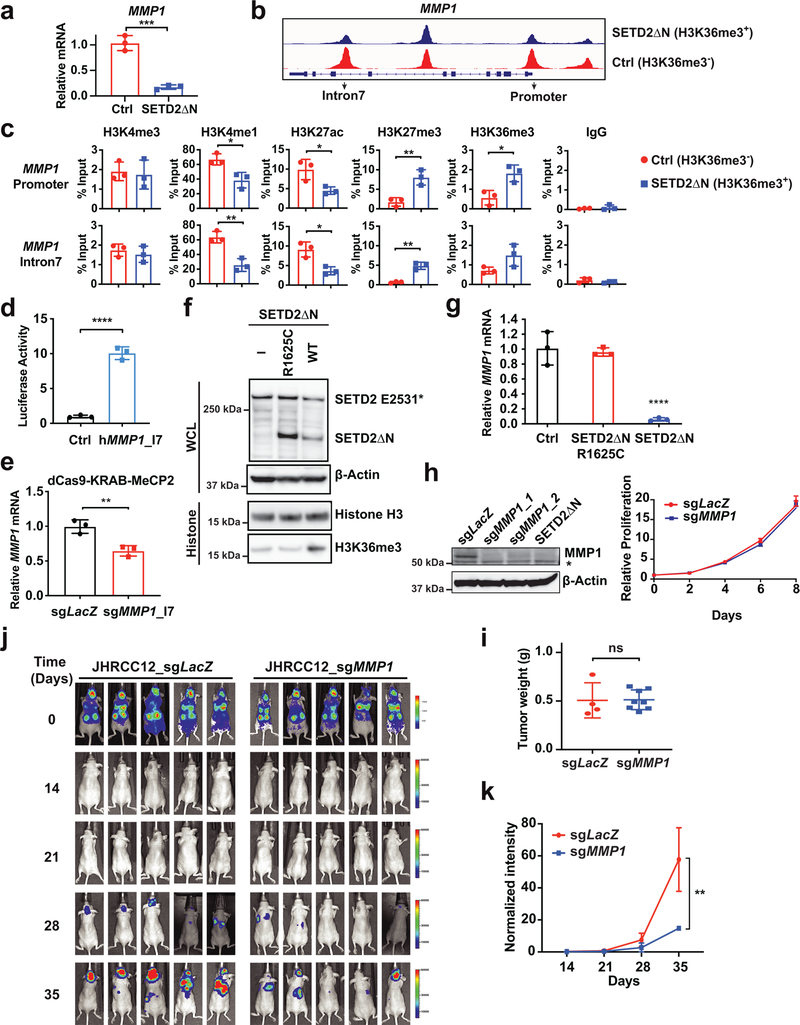
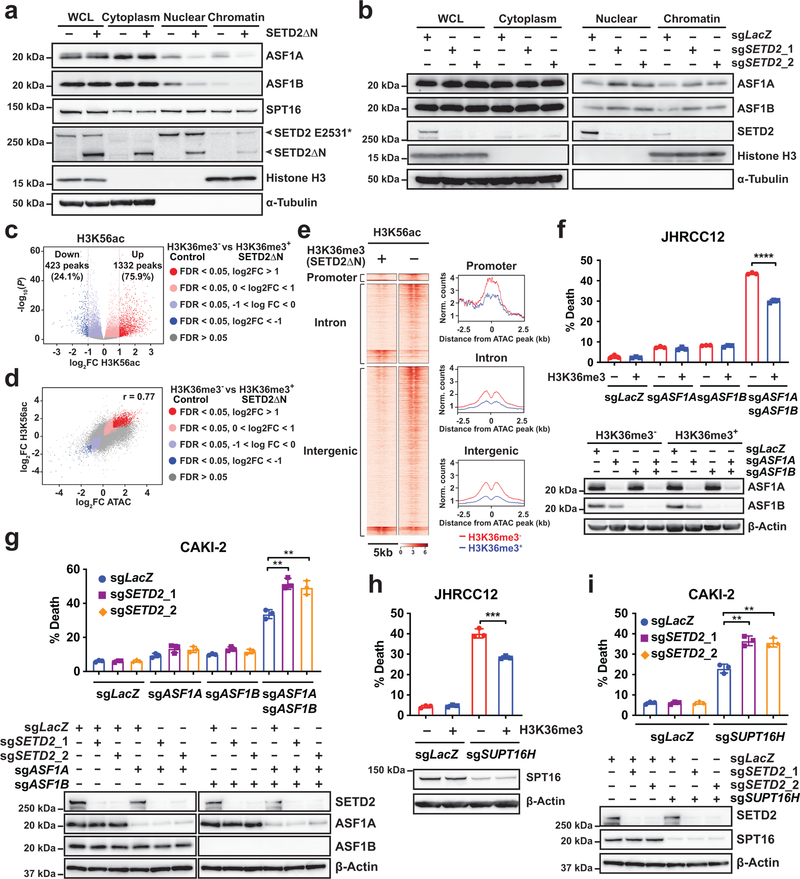
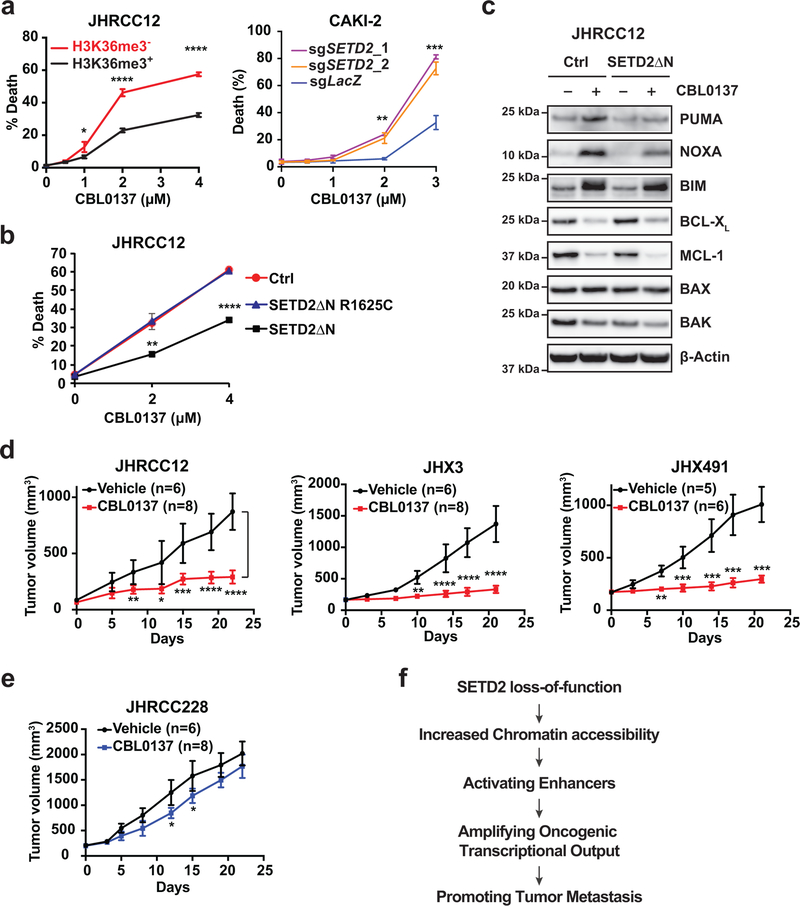
SETD2 is a histone H3 lysine 36 (H3K36) trimethyltransferase that is mutated with high prevalence (13%) in clear cell renal cell carcinoma (ccRCC). Genomic profiling of primary ccRCC tumors reveals a positive correlation between SETD2 mutations and metastasis. However, whether and how SETD2 loss promotes metastasis remains unclear. In this study, we used a SETD2-mutant (SETD2MT) metastatic ccRCC human-derived cell line and xenograft models and showed that H3K36me3 restoration greatly reduced distant metastases of ccRCC in mice in a matrix metalloproteinase 1 (MMP1)-dependent manner. An integrated multiomics analysis using assay for transposase-accessible chromatin using sequencing (ATAC-seq), chromatin immunoprecipitation-sequencing (ChIP-seq) and RNA sequencing (RNA-seq) established a tumor suppressor model in which loss of SETD2-mediated H3K36me3 activates enhancers to drive oncogenic transcriptional output through regulation of chromatin accessibility. Furthermore, we uncovered mechanism-based therapeutic strategies for SETD2-deficient cancer through the targeting of specific histone chaperone complexes, including ASF1A/ASF1B and SPT16. Overall, SETD2 loss creates a permissive epigenetic landscape for cooperating oncogenic drivers to amplify transcriptional output, providing unique therapeutic opportunities.


Figures

Extended Data Fig. 1
Extended Data Fig. 1. Restoration of H3K36me3 in SETD2 mutant ccRCC cells suppresses tumor metastasis.
a-b, Representative bioluminescence images of NOD.Cg-Prkdcscid Il2rgtm1Wjl/SzJ (NSG) mice injected with the indicated JHRCC12 cells into subrenal capsules of unilateral kidneys are shown in a and the quantification of bioluminescence is shown in b (mean ± s.d., n = 5 for H3K36me3-deficient and n = 4 for H3K36me3-proficient). n.s., not significant (two-tailed unpaired Student’s t-test). c, Representative gross images of the indicated organs in mice received subrenal capsule injection of the indicated JHRCC12 cells. Yellow arrowheads indicate metastatic tumors.
Extended Data Fig. 2
Extended Data Fig. 2. Summary of differentially expressed genes in H3K36me3 compared to H3K36me3+ JHRCC12 cells as well as in SETD2MT compared to SETD2WT ccRCC.
a, Venn diagram showing overlap of differentially upregulated genes (FDR < 0.05, log2(FC) > 0) in H3K36me3 compared to H3K36me3+ (SETD2ΔN-transduced) JHRCC12 cells and differentially upregulated genes (FDR < 0.05, log2(FC) > 0) in SETD2MT compared to SETD2WT ccRCC from the TCGA-KIRC dataset. b, Venn diagram showing overlap of differentially downregulated genes (FDR < 0.05, log2(FC) < 0) in H3K36me3 compared to H3K36me3+ (SETD2ΔN-transduced) JHRCC12 cells and differentially downregulated genes (FDR < 0.05, log2(FC) < 0) in SETD2MT compared to SETD2WT ccRCC from the TCGA-KIRC dataset. c, The open chromatin peaks comparing H3K36me3-with H3K36me3+ JHRCC12 cells were enriched for the binding motifs of STAT family transcription factors.
Extended Data Fig. 3
Extended Data Fig. 3. Genes that are upregulated in SETD2ΔN-transduced compared to SETD2-deficient JHRCC12 cells have higher H3K36me3 levels than downregulated genes in SETD2ΔN-transduced cells.
a, Normalized H3K36me3 ChIP-seq counts in SETD2-deficient JHRCC12 cells over gene bodies of stringently up- and down-regulated genes (FDR < 0.05 and log2(FC) >1) in SETD2-proficient (SETD2ΔN-transduced) compared to SETD2-deficient cells. b, Normalized H3K36me3 ChIP-seq counts in SETD2ΔN-transduced JHRCC12 cells over gene bodies of stringently up- and down-regulated genes (FDR < 0.05 and log2(FC) >1) in SETD2-proficient (SETD2ΔN-transduced) compared to SETD2-deficient cells. Centers of the boxes indicate median values, the lower and upper hinges correspond to the first and third quartiles and the upper (lower) whiskers extend from the hinge to the largest (smallest) value no further than 1.5 times the distance between the first and third quartiles. P values were calculated using one-sided Wilcoxon rank sum tests. c, Cumulative distribution of H3K36me3 levels in SETD2ΔN-transduced cells over gene bodies of significantly upregulated (red) or downregulated (blue) genes (FDR < 0.05) in SETD2-proficient (SETD2ΔN-transduced) compared to SETD2-deficient cells. P values were calculated using one-sided KS test comparing H3K36me3 levels in differentially expressed genes to all genes. d, Metaplots showing the normalized average levels of histone marks across gene bodies of stringently upregulated genes (FDR < 0.05 and log2(FC) > 1, n=174) comparing H3K36me3+ (SETD2ΔN-transduced) with H3K36me3 (control) JHRCC12 cells by ChIP-seq. e, Metaplots showing the normalized average levels of histone marks across gene bodies of stringently downregulated genes (FDR < 0.05 and log2(FC) < −1, n=194) comparing H3K36me3+ (SETD2ΔN-transduced) with H3K36me3 (control) JHRCC12 cells by ChIP-seq. TSS, transcription start site; TES, transcription end site.
Extended Data Fig. 4
Extended Data Fig. 4. Loss of SETD2-mediated H3K36me3 induces genome-wide epigenetic changes.
a. Pie chart showing the percentage of differentially enriched ChIP-seq peaks (FDR < 0.05) for each histone mark in promoter, intronic, intergenic, and exonic regions comparing H3K36me3 with H3K36me3+ (SETD2ΔN-transduced) JHRCC12 cells. b. Heatmap of differentially accessible ATAC-seq peaks (FDR < 0.05 and log2(FC) > 1) assigned to an upregulated gene, in a 5kb window grouped by localization at promoter, intron, and intergenic regions (n = 1012). c. Heatmap of differentially accessible ATAC-seq peaks (FDR < 0.05 and log2(FC) > 1) assigned to a downregulated gene, in a 5kb window grouped by localization at promoter, intron, and intergenic regions (n = 456).
Extended Data Fig. 5
Extended Data Fig. 5. Open chromatin regions that are not affected by the status of H3K36me3 show no differences in both enhancer and promoter marks.
a. Heatmaps for non-differential ATAC-seq peaks (FDR > 0.05; n = 24016) in 5kb window grouped by localization at promoter, intron, and intergenic regions and heatmaps showing histone modifications in 5kb window in the same regions of ATAC-seq peaks. b. Metapeak plots of non-differential ATAC-seq peaks (FDR > 0.05) in 5kb window grouped by localization at promoter, intron, and intergenic regions and metapeak plots of histone modifications in 5kb window in the same regions of ATAC-seq peaks.
Extended Data Fig. 6
Extended Data Fig. 6. Open chromatin regions that are not affected by the status of H3K36me3 show no differences in histone modifications.
a. Heatmap of non-differential ATAC-seq peaks assigned to an upregulated gene in a 5kb window grouped by localization at promoter, intron, and intergenic regions (n = 6313) and heatmaps showing histone modifications in 5kb window in the same regions of ATAC-seq peaks. b. Heatmap of non-differential ATAC-seq peaks assigned to a downregulated gene in a 5kb window grouped by localization at promoter, intron, and intergenic regions (n = 7835) and heatmaps showing histone modifications in 5kb window in the same regions of ATAC-seq peaks.
Extended Data Fig. 7
Extended Data Fig. 7. Loss of SETD2-mediated H3K36me3 induces a genome-wide increase of active/permissive histone marks that correlate with increased chromatin accessibility.
a, The extent of co-occurrence of two up/downregulated histone modification ChIP-seq or ATAC-seq peaks were assessed using Fisher’s exact test for each pairwise comparison of those peaks. The plot shows the odds ratio and Bonferroni adjusted P value from Fisher’s exact test. Enrichment ratios greater than 1 implies the peaks of interest are more likely to co-occur, whereas enrichment ratios less than 1 means that the peaks of interest are less likely to co-occur (*, P < 0.05; **, P < 0.01; ***, P < 0.001). b, The extent of co-occurrence of up- or downregulated genes with up- or downregulated histone modification ChIP-seq or ATAC-seq peaks were assessed using Fisher’s exact test for each pairwise comparison. The plot shows the odds ratio and Bonferroni adjusted P value from Fisher’s exact test. Enrichment ratios greater than 1 implies that up- (or down-) regulated genes are enriched in up- (or down-) regulated peaks, while enrichment ratios less than 1 implies that up- (or down-) regulated genes are depleted in up- (or down-) regulated peaks (*, P < 0.05; **, P < 0.01; ***, P < 0.001).
Extended Data Fig. 8
Extended Data Fig. 8. Comparison of ATAC-seq and ChIP-seq at the MMP1 locus.
ATAC-seq tracks and ChIP-seq tracks for the indicated histone marks at the MMP1 locus in H3K36me3 or H3K36me3+ (SETD2ΔN-transduced) JHRCC12 cells.
Extended Data Fig. 9
Extended Data Fig. 9. Loss of SETD2-mediated H3K36me3 increases H3K56ac levels.
a. Metaplots showing the normalized distribution profiles of H3K56ac across gene bodies. b. Pie chart showing the percentage of differentially enriched ChIP-seq peaks for H3K56ac (FDR < 0.05; n = 11251) in promoter, intronic, intergenic, and exonic regions comparing H3K36me3 (control) with H3K36me3+ (SETD2ΔN-transduced) JHRCC12 cells.
Extended Data Fig. 10
Extended Data Fig. 10. Loss of SETD2-mediated H3K36me3 sensitizes cancer cells to KO of both ASF1A and ASF1B but not the inhibitor of p300/CBP, CCS1477.
a-b, JHRCC12 cells infected with control retrovirus or retrovirus expressing SETD2ΔN were subjected to lentiviral CRISPR/Cas9-mediated KO of ASF1A (exon 3), ASF1B, or both ASF1A (exon 3) and ASF1B and analyzed by the indicated immunoblots in a. Cell death was quantified by annexin-V staining (mean ± s.d., n = 3) in b. **, P < 0.01 (two-tailed unpaired Student’s t-test). c, JHRCC12 cells infected with control retrovirus or retrovirus expressing SETD2ΔN were treated with the p300/CBP inhibitor CCS1477 at the indicated concentrations. Cell death was quantified by annexin-V staining (mean ± s.d., n = 3).
Fig. 1 |
Fig. 1 |. SETD2 is highly mutated in metastatic ccRCC tumors and restoration of H3K36me3 in SETD2 mutant ccRCC suppresses tumor metastasis.
a, The mutation rates of VHL, PBRM1, SETD2, and BAP1 in the indicated ccRCC cohorts. b, A schematic diagram of the domain structure of SETD2 and SETD2ΔN. Whole cell lysates (WCL) and histone fractions from the indicated JHRCC12 cells or from 786-O cells were assessed by immunoblots. c, The indicated luciferase-transduced JHRCC12 cells were injected into subrenal capsules of unilateral kidneys of NSG mice to establish orthotopic xenografts. Successful injection was confirmed by bioluminescence imaging. A representative bioluminescence image is shown. The weight of kidney tumors in each mouse was estimated by subtracting the weight of kidney without orthotopic implantation from that of kidney with orthotopic implantation after 5–6 weeks. Data shown are mean ± s.d. (n = 5 mice for each group, two-tailed unpaired Student’s t-test). Representative gross images of bilateral kidneys (only left kidney with orthotopic xenograft tumors), H&E staining and immunohistochemistry staining for CA-IX are shown. T, tumor; K, adjacent normal kidney. Scale bars, 100 μm. d,, Representative H&E staining and IHC staining for CA-IX of the indicated organs with metastatic tumors developed in mice received orthotopic implantation of JHRCC12 cells. Scale bars, 100 μm. e, Bioluminescence images of athymic nude mice at the indicated times after intracardiac injection of the indicated luciferase-transduced JHRCC12 cells (mean ± s.d., n = 3 mice for H3K36me3-deficient and n = 5 mice for H3K36me3-proficient). ***, P = 0.0002 (two-way ANOVA). f, GSEA plots of the differentially expressed genes (FDR < 0.05) comparing control (H3K36me3) with SETD2ΔN-transduced (H3K36me3+) JHRCC12 cells using the indicated gene sets. NES, normalized enrichment score. g, GSEA plot of the differentially expressed genes (FDR < 0.05) comparing SETD2MT with SETD2WT human ccRCC from TCGA using the SETD2-dependent gene signature defined in JHRCC12 cells. h, Kaplan-Meier analysis of overall survival in ccRCC patients from TCGA based on the expression of the refined SETD2 signature (the top 50% highly expressed are shown in red and the bottom 50% are shown in blue). P = 0.00038 (Mantel–Cox test).
Fig. 2 |
Fig. 2 |. Loss of SETD2-mediated H3K36me3 induces a genome-wide increase in chromatin accessibility that correlates with increased oncogenic transcriptional output.
a, Volcano plot of ATAC-seq peaks comparing control (H3K36me3) with SETD2ΔN-transduced (H3K36me3+) JHRCC12 cells. Peaks with differential chromatin accessibility upon H3K36me3 restoration (FDR < 0.05; n = 24016) are highlighted. The number of peaks with significant changes (FDR < 0.05 and log2(fold change; FC) > 1; n = 6315 peaks) upon H3K36me3 restoration is shown. Pie chart showing the percentage of differentially accessible ATAC-seq peaks (FDR < 0.05) at promoter, intronic, intergenic, and exonic regions. b, Heatmap of differentially accessible ATAC-seq peaks described in a (FDR < 0.05 and log2(FC) > 1) in 5kb window grouped by localization at promoter, intron, and intergenic regions. c, Volcano plot of ATAC-seq peaks comparing primary murine renal tubular epithelial (RTE) cells cultured from Setd2F/FKsp-Cre+ mice with those from littermate Setd2F/F mice. Peaks with differential chromatin accessibility upon Setd2 deletion (FDR < 0.05) are highlighted. The number of peaks with significant changes (FDR < 0.05 and log2(FC) > 1) is shown. Whole cell lysates (WCL) and histone fractions from the indicated RTE cells were assessed by immunoblots. d-e, Volcano plots of ATAC-seq peaks comparing H3K36me3 with H3K36me3+ (SETD2ΔN-transduced) JHRCC12 PDXs (d) or comparing JHRCC12 (VHLMTPBRM1MTSETD2MT) PDXs with JHRCC228 (VHLMTPBRM1MTSETD2WT) PDXs (e). Peaks with differential chromatin accessibility (FDR < 0.05) are highlighted (red, open chromatin; blue, closed chromatin). The number of peaks with significant changes (FDR < 0.05 and log2(FC) > 1) is shown. P values were obtained using DESeq2 (Methods). f, Distribution of chromatin accessibility changes associated with significantly upregulated (red) or downregulated (blue) genes comparing H3K36me3 with H3K36me3+ JHRCC12 cells. P values calculated using one-sided KS test comparing peaks associated with differentially expressed genes to all genes. g, Diamond plots of changes in chromatin accessibility for the top 25 most upregulated and 25 most downregulated genes comparing H3K36me3 with H3K36me3+ JHRCC12 cells. Red, open chromatin; blue, closed chromatin. h, The 20 most significantly enriched transcription factor binding motifs in open (red) and closed (blue) chromatin peaks comparing H3K36me3 with H3K36me3+ JHRCC12 cells.
Fig. 3 |
Fig. 3 |. Loss of SETD2-mediated H3K36me3 induces genome-wide epigenetic reprogramming and activation of enhancers.
a, Metaplots showing the normalized average levels of H3K36me3, H3K4me3, H3K4me1, H3K27ac, and H3K27me3 across gene bodies comparing control (H3K36me3) with SETD2ΔN-transduced (H3K36me3+) JHRCC12 cells by ChIP-seq. TSS, transcription start site; TES, transcription end site. b, Volcano plots showing changes in ChIP-seq for the indicated histone modifications comparing H3K36me3 with H3K36me3+ JHRCC12 cells. Peaks with differential enrichment for each histone modification (FDR < 0.05) are highlighted. The number of peaks with significant changes (FDR < 0.05 and log2(FC) > 1) in each histone modification is shown. c, Scatter plots showing correlation between log2(FC) of ChIP-seq for each histone modification and log2(FC) of ATAC-seq comparing H3K36me3 with H3K36me3+ JHRCC12 cells. Peaks with significant changes (FDR < 0.05) in both histone modification and chromatin accessibility are highlighted. d, Heatmaps of differentially accessible ATAC-seq peaks (FDR < 0.05 and log2(FC) > 1; n = 6280) in 5kb window grouped by localization at promoter, intron, and intergenic regions as well as ChIP-seq signals for the indicated histone modifications in the same regions of ATAC-seq peaks. e, Metapeak plots of differentially accessible ATAC-seq peaks (FDR < 0.05 and log2(FC) > 1) and ChIP-seq signals as described in d. f, Cumulative distribution of histone modification changes in significantly upregulated (red) or downregulated (blue) genes (FDR < 0.05) comparing H3K36me3 with H3K36me3+ (SETD2ΔN-transduced) JHRCC12 cells. P values calculated using one-sided KS test comparing peaks associated with differentially expressed genes to all genes.
Fig. 4 |
Fig. 4 |. SETD2 loss-of-function induces MMP1 expression to promote ccRCC metastasis.
a, The MMP1 mRNA was assessed in the indicated JHRCC12 cells by qRT-PCR. Data were normalized against β-Actin (mean ± s.d., n = 3 independent experiments). b, ATAC-seq tracks at the MMP1 locus in the indicated JHRCC12 cells. c, The indicated JHRCC12 cells were assessed by ChIP-qPCR for the promoter and intron 7 of MMP1. Data shown are the percent input (mean ± s.d., n = 3 independent experiments). d, CAKI-2 cells were transiently transfected with either pGL2-pro or pGL2-pro containing the DNA fragment from the ATAC-seq peak at the intron 7 of MMP1 together with pRL-SV40. The firefly and Renilla luciferase activities were assessed and normalized (mean ± s.d., n = 3 independent experiments). e, The MMP1 mRNA was assessed in JHRCC12 cells transfected with dCas9–KRAB–MeCP2 and the indicated sgRNAs as in a. f, Whole cell lysates (WCL) and histone fractions from the indicated JHRCC12 cells were assessed by immunoblots. g, The MMP1 mRNA was assessed in the indicated JHRCC12 cells by qRT-PCR as in a. h, The indicated JHRCC12 cells were assessed by immunoblots. The asterisk denotes a cross-reactive band. Cellular proliferation was assessed by CellTiter-Glo assays. i, The indicated luciferase-transduced JHRCC12 cells were injected into subrenal capsules of unilateral kidneys of NSG mice to establish orthotopic xenografts. The weight of kidney tumors in each mouse was estimated by subtracting the weight of kidney without orthotopic implantation from that of kidney received subcapsular injection of the indicated JHRCC12 cells after 5–6 weeks. Data shown are mean ± s.d. (n = 4 mice for sgLacZ and n = 8 mice for sgMMP1). j, Bioluminescence images of athymic nude mice at the indicated times after intracardiac injection of the indicated luciferase-transduced JHRCC12 cells. k, Quantification of bioluminescence shown in j (mean ± s.d., n = 5 mice for each group). P = 0.0055 (two-way ANOVA). P values in a, c, d, e and g were determined by two-tailed unpaired Student’s t-test. *, P < 0.05; **, P < 0.01; ***, P < 0.001; ****, P < 0.0001.
Fig. 5 |
Fig. 5 |. Loss of SETD2-mediated H3K36me3 increases histone chaperone recruitment and sensitizes cancer cells to genetic inactivation of histone chaperones.
a, Whole cell lysates (WCL), cytoplasm, nuclear, and chromatin fractions of the indicated JHRCC12 cells were analyzed by immunoblots. b, WCL, cytoplasm, nuclear, and chromatin fractions of the indicated CAKI-2 cells were analyzed by immunoblots. c, Volcano plot showing changes in ChIP-seq for H3K56ac comparing control (H3K36me3) with SETD2ΔN-transduced (H3K36me3+) JHRCC12 cells. Peaks with differential enrichment for H3K56ac (FDR < 0.05; n = 11251) are highlighted. The number of peaks with significant changes (FDR < 0.05 and log2(FC) > 1; n = 1755) in H3K56ac is shown. d, Scatter plot showing correlation between log2(FC) of H3K56ac ChIP-seq and log2(FC) of ATAC-seq comparing H3K36me3 with H3K36me3+ JHRCC12 cells. Peaks with significant changes (FDR < 0.05) in both histone modification and chromatin accessibility are highlighted. e, Heatmaps and metapeak plots showing H3K56ac ChIP-seq in the same regions of ATAC-seq peaks in 5kb window. f, H3K36me3 and H3K36me3+ (SETD2ΔN-transduced) JHRCC12 cells were subjected to lentiviral CRISPR/Cas9-mediated KO of ASF1A (exon 1), ASF1B, or both ASF1A (exon 1) and ASF1B, and analyzed by immunoblots. Cell death was quantified by annexin-V staining (mean ± s.d., n = 3 independent transductions). g, CAKI-2 cells transduced with lentivirus expressing sgRNAs targeting LacZ or SETD2 were subsequently transduced with lentivirus expressing sgRNAs targeting LacZ, ASF1A, ASF1B, or both ASF1A and ASF1B, and analyzed by immunoblots. Cell death was quantified by annexin-V staining (mean ± s.d., n = 3 transductions). h, H3K36me3 and H3K36me3+ (SETD2ΔN-transduced) JHRCC12 cells were subjected to lentiviral CRISPR/Cas9-mediated KO of SUPT16H and analyzed by immunoblots. Cell death was quantified by annexin-V staining (mean ± s.d., n = 3 transductions). i, CAKI-2 cells transduced with lentivirus expressing sgRNAs targeting LacZ or SETD2 were subsequently transduced with lentivirus expressing sgRNAs targeting LacZ or SUPT16H. Cell death was quantified by annexin-V staining (mean ± s.d., n = 3 transductions). P values in f, g, h and i were determined by two-tailed unpaired Student’s t-test. *, P < 0.05; **, P < 0.01; ***, P < 0.001; ****, P < 0.0001.
Fig. 6 |
Fig. 6 |. Loss of SETD2-mediated H3K36me3 sensitizes cancer cells to inhibition of the FACT complex.
a, H3K36me3 and H3K36me3+ (SETD2ΔN-transduced) JHRCC12 cells as well as CAKI-2 cells transduced with the indicated sgRNAs were treated with the FACT complex inhibitor CBL0137 at the indicated concentrations. Cell death was quantified by annexin-V staining (mean ± s.d., n = 3 independent experiments). *, P < 0.05; **, P < 0.01; ***, P < 0.001; ****, P < 0.0001 (two-tailed unpaired Student’s t-test). b, JHRCC12 cells infected with control retrovirus or retrovirus expressing SETD2ΔN_R1625C or SETD2ΔN_WT were treated with CBL0137 at the indicated concentrations. Cell death was quantified by annexin-V staining (mean ± s.d., n = 3 independent experiments). **, P < 0.01; ****, P < 0.0001 (two-tailed unpaired Student’s t-test). c, JHRCC12 cells infected with control retrovirus or retrovirus expressing SETD2ΔN were untreated or treated with CBL0137 (2 μM) and assessed by the indicated immunoblots. d, NSG mice bearing patient-derived VHLMTPBRM1MTSETD2MT ccRCC xenografts (JHRCC12, JHX3 and JHX491) were treated with vehicle or CBL0137 (60 mg/kg, twice weekly). *, P < 0.05; **, P < 0.01; ***, P < 0.001; ****, P < 0.0001 (Multiple t-test, Sidak-bonferroni). e, NSG mice bearing patient-derived VHLMTPBRM1MTSETD2WT ccRCC xenografts (JHRCC228) were treated with vehicle or CBL0137 (60 mg/kg, twice weekly). *, P < 0.05 (Multiple t-test, Sidak-bonferroni). f, A schematic summarizing the tumor suppressor model of SETD2 in kidney cancer metastasis. In panels d, e: n = number of mice.

References

    1. Sun X-J et al. Identification and characterization of a novel human histone H3 lysine 36-specific methyltransferase. Journal of Biological Chemistry 280, 35261–35271 (2005). - PubMed
    1. Kizer KO et al. A novel domain in Set2 mediates RNA polymerase II interaction and couples histone H3 K36 methylation with transcript elongation. Mol Cell Biol 25, 3305–3316, doi:10.1128/mcb.25.8.3305-3316.2005 (2005). - DOI - PMC - PubMed
    1. Edmunds JW, Mahadevan LC & Clayton AL Dynamic histone H3 methylation during gene induction: HYPB/Setd2 mediates all H3K36 trimethylation. The EMBO journal 27, 406–420 (2008). - PMC - PubMed
    1. Hu M et al. Histone H3 lysine 36 methyltransferase Hypb/Setd2 is required for embryonic vascular remodeling. Proceedings of the National Academy of Sciences of the United States of America 107, 2956–2961, doi:10.1073/pnas.0915033107 (2010). - DOI - PMC - PubMed
    1. Wagner EJ & Carpenter PB Understanding the language of Lys36 methylation at histone H3. Nature reviews Molecular cell biology 13, 115 (2012). - PMC - PubMed

Publication types