. 2022 Feb;25(2):226-237.
doi: 10.1038/s41593-021-01006-0. Epub 2022 Feb 3.

Answer ALS, a large-scale resource for sporadic and familial ALS combining clinical and multi-omics data from induced pluripotent cell lines

Emily G Baxi  1   2 Terri Thompson  3 Jonathan Li  4 Julia A Kaye  5 Ryan G Lim  6 Jie Wu  7 Divya Ramamoorthy  4 Leandro Lima  5 Vineet Vaibhav  8 Andrea Matlock  8 Aaron Frank  9 Alyssa N Coyne  1   2 Barry Landin  10 Loren Ornelas  9 Elizabeth Mosmiller  2 Sara Thrower  11 S Michelle Farr  12 Lindsey Panther  9 Emilda Gomez  9 Erick Galvez  9 Daniel Perez  9 Imara Meepe  9 Susan Lei  9 Berhan Mandefro  13 Hannah Trost  13 Louis Pinedo  9 Maria G Banuelos  13 Chunyan Liu  9 Ruby Moran  9 Veronica Garcia  13 Michael Workman  13 Richie Ho  13 Stacia Wyman  5 Jennifer Roggenbuck  14 Matthew B Harms  15 Jennifer Stocksdale  16 Ricardo Miramontes  6 Keona Wang  16 Vidya Venkatraman  8 Ronald Holewenski  8 Niveda Sundararaman  8 Rakhi Pandey  8 Danica-Mae Manalo  8 Aneesh Donde  4 Nhan Huynh  4 Miriam Adam  4 Brook T Wassie  4 Edward Vertudes  5 Naufa Amirani  5 Krishna Raja  5 Reuben Thomas  5 Lindsey Hayes  2 Alex Lenail  4 Aianna Cerezo  2 Sarah Luppino  11 Alanna Farrar  11 Lindsay Pothier  11 Carolyn Prina  15 Todd Morgan  17 Arish Jamil  18 Sarah Heintzman  15 Jennifer Jockel-Balsarotti  19 Elizabeth Karanja  19 Jesse Markway  19 Molly McCallum  19 Ben Joslin  20 Deniz Alibazoglu  20 Stephen Kolb  15 Senda Ajroud-Driss  20 Robert Baloh  13 Daragh Heitzman  17 Tim Miller  19 Jonathan D Glass  18 Natasha Leanna Patel-Murray  4 Hong Yu  11 Ervin Sinani  11 Prasha Vigneswaran  11 Alexander V Sherman  11 Omar Ahmad  2 Promit Roy  2 Jay C Beavers  21 Steven Zeiler  2 John W Krakauer  2 Carla Agurto  10 Guillermo Cecchi  10 Mary Bellard  22 Yogindra Raghav  4 Karen Sachs  4 Tobias Ehrenberger  4 Elizabeth Bruce  22 Merit E Cudkowicz  11 Nicholas Maragakis  2 Raquel Norel  10 Jennifer E Van Eyk  8 Steven Finkbeiner  5 James Berry  11 Dhruv Sareen  9   13 Leslie M Thompson  6   7   16   23 Ernest Fraenkel  4 Clive N Svendsen  9   13 Jeffrey D Rothstein  24   25
Affiliations

Answer ALS, a large-scale resource for sporadic and familial ALS combining clinical and multi-omics data from induced pluripotent cell lines

Emily G Baxi et al. Nat Neurosci. 2022 Feb.

Abstract

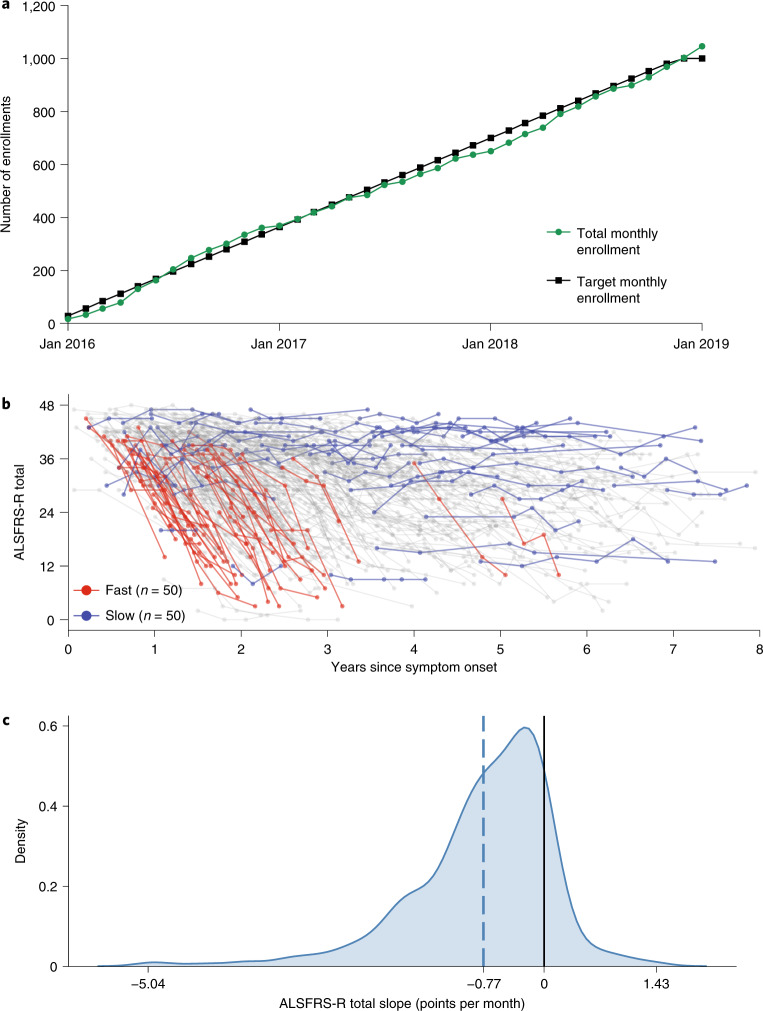
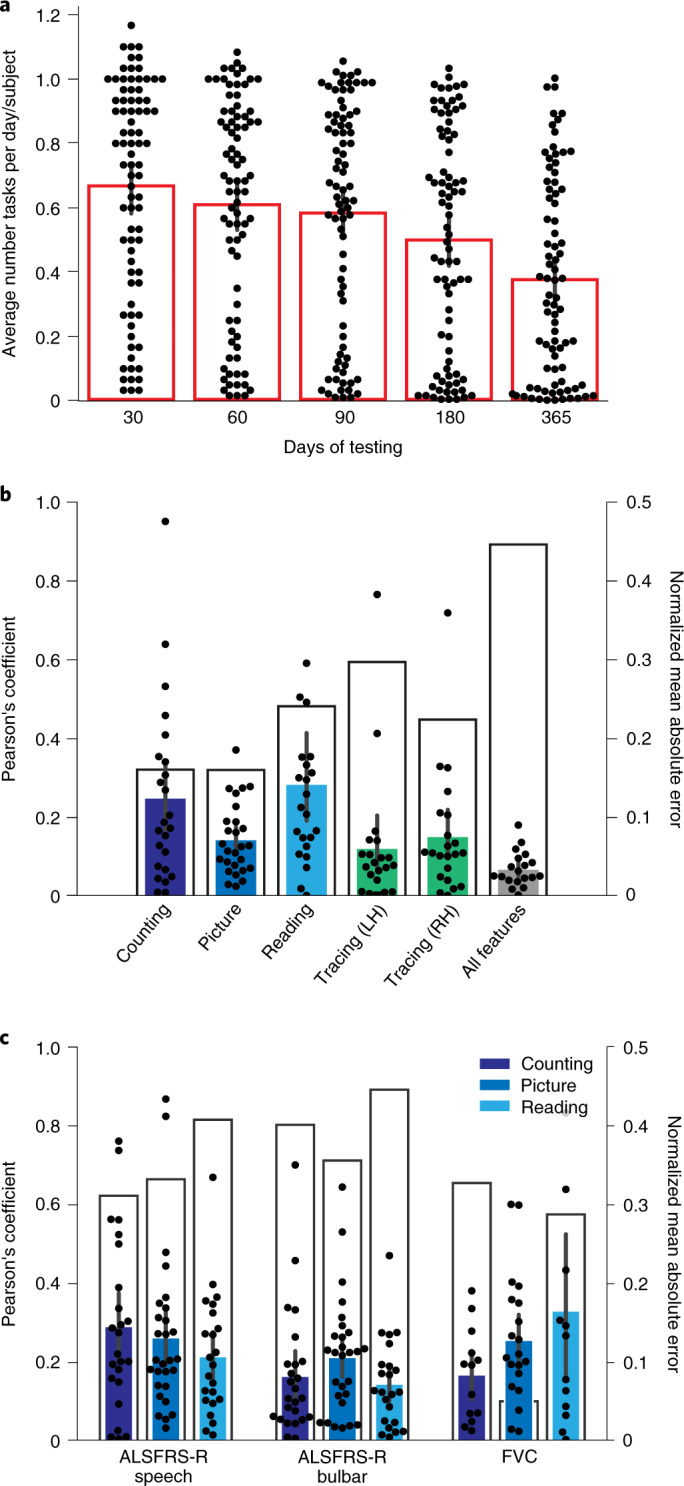
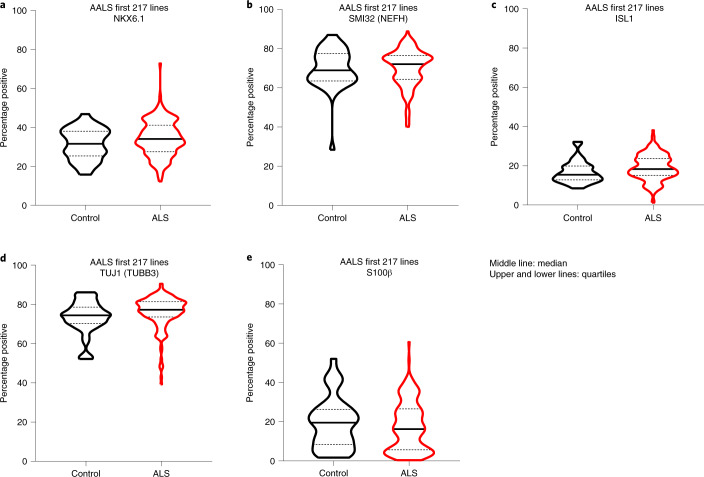
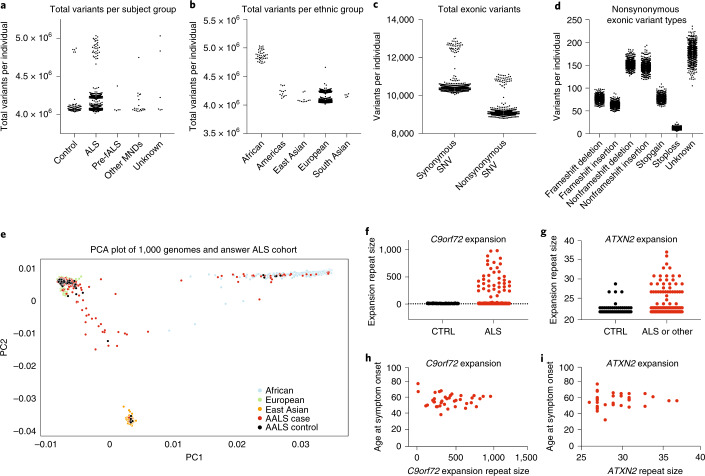
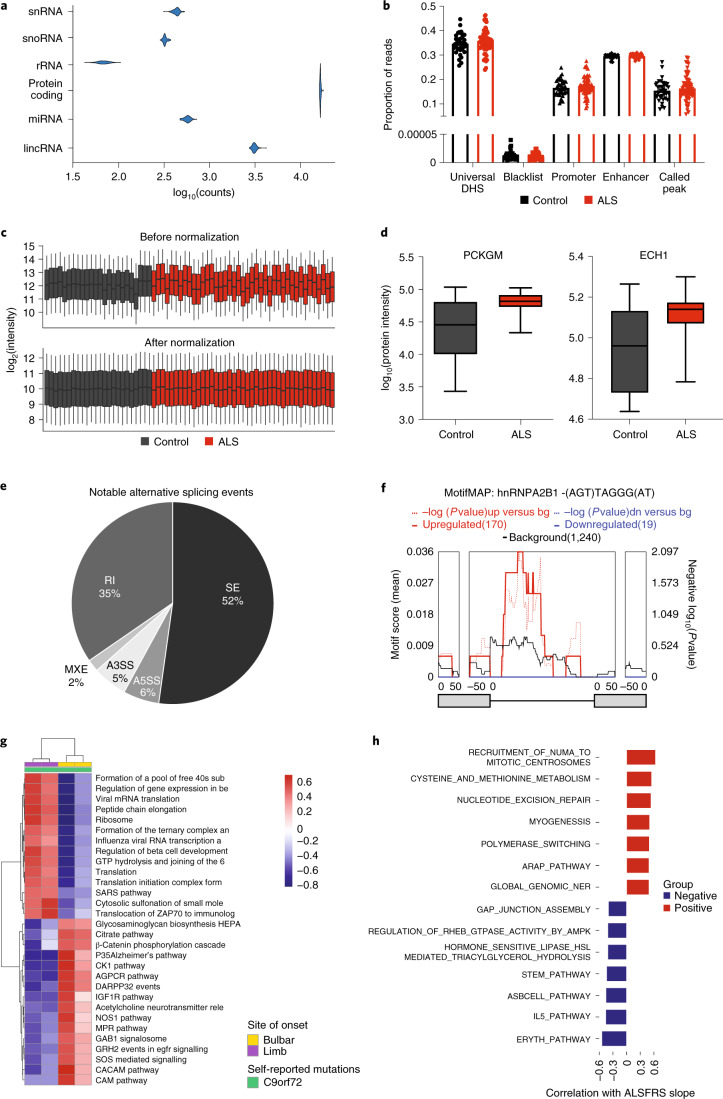
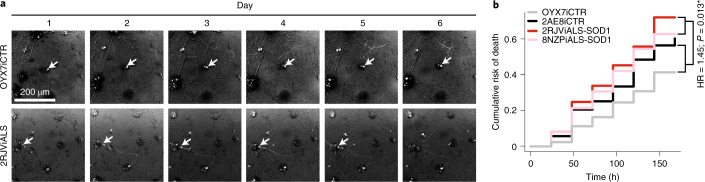
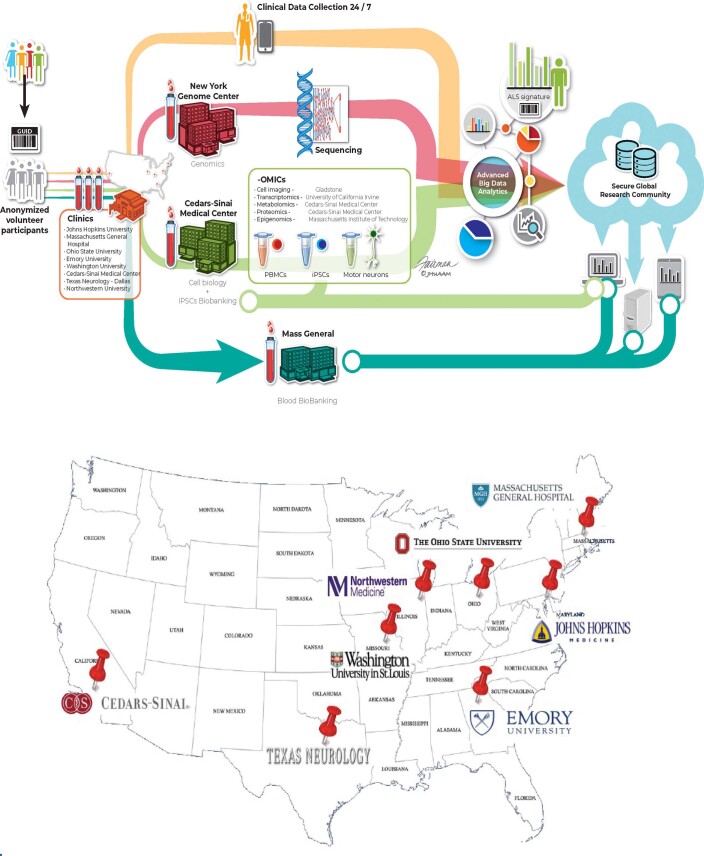
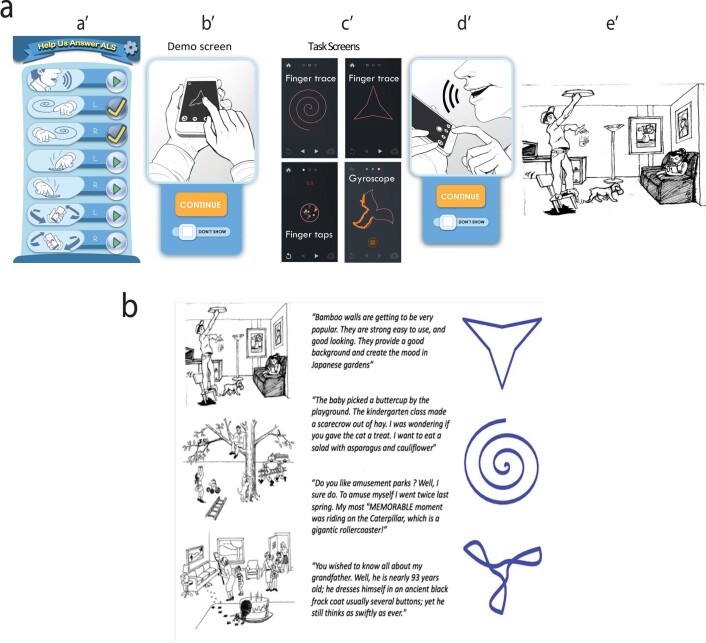
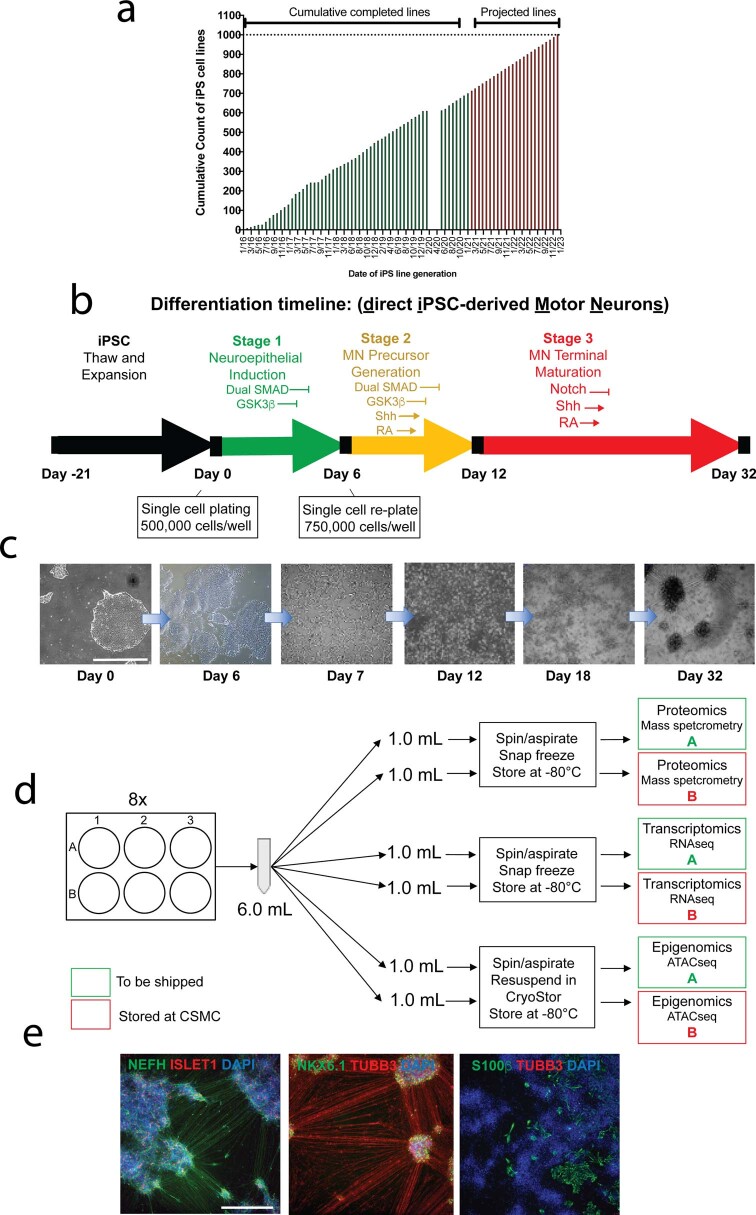
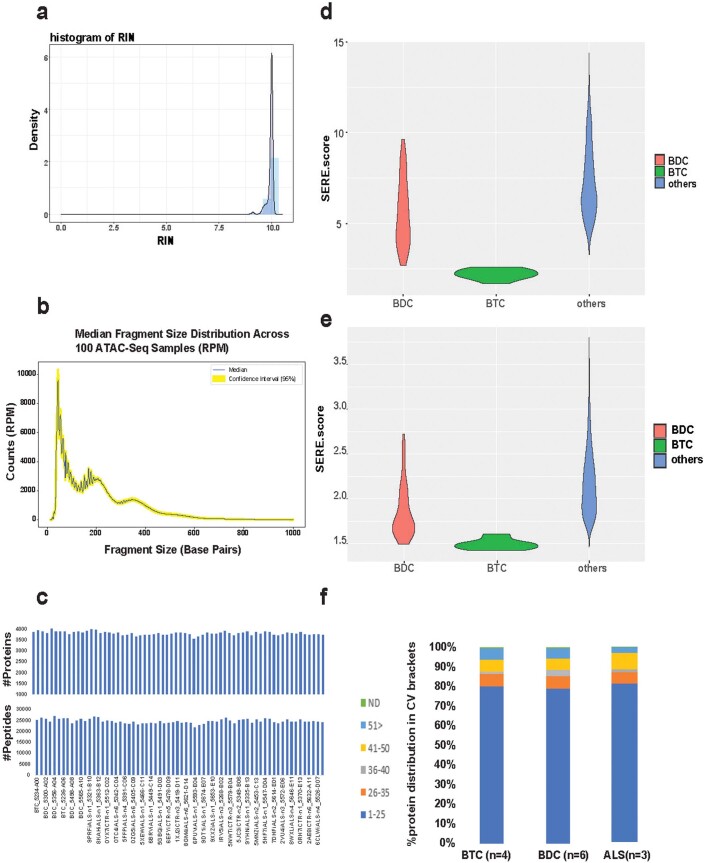
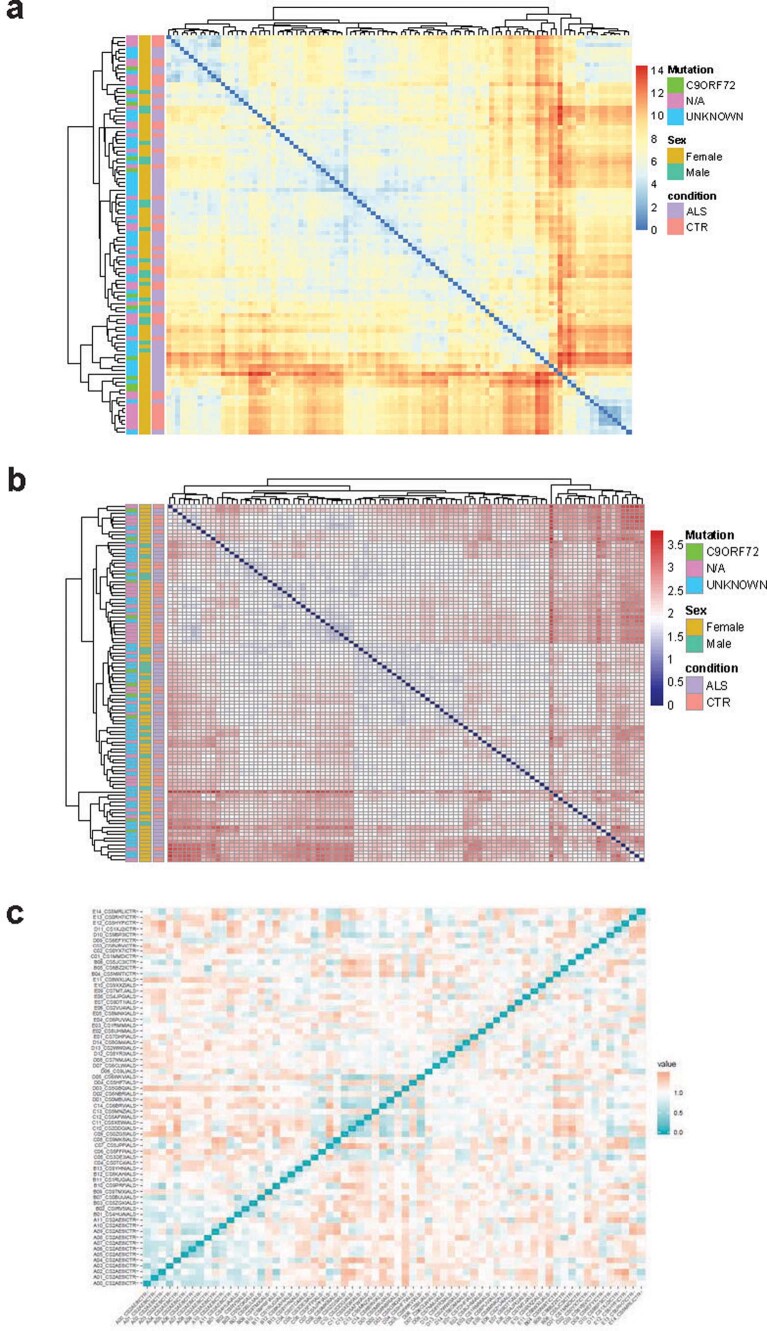
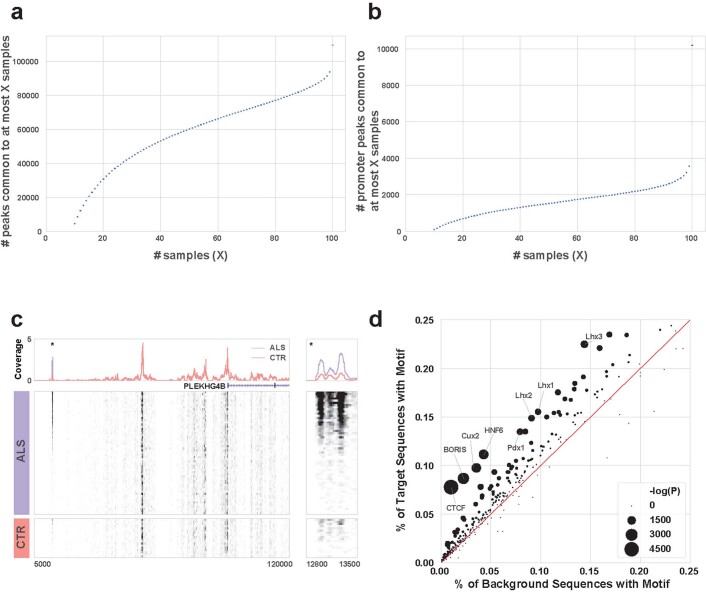
Answer ALS is a biological and clinical resource of patient-derived, induced pluripotent stem (iPS) cell lines, multi-omic data derived from iPS neurons and longitudinal clinical and smartphone data from over 1,000 patients with ALS. This resource provides population-level biological and clinical data that may be employed to identify clinical-molecular-biochemical subtypes of amyotrophic lateral sclerosis (ALS). A unique smartphone-based system was employed to collect deep clinical data, including fine motor activity, speech, breathing and linguistics/cognition. The iPS spinal neurons were blood derived from each patient and these cells underwent multi-omic analytics including whole-genome sequencing, RNA transcriptomics, ATAC-sequencing and proteomics. The intent of these data is for the generation of integrated clinical and biological signatures using bioinformatics, statistics and computational biology to establish patterns that may lead to a better understanding of the underlying mechanisms of disease, including subgroup identification. A web portal for open-source sharing of all data was developed for widespread community-based data analytics.


Conflict of interest statement

The authors declare that the research was conducted in the absence of any commercial or financial relationships that could be construed as a potential conflict of interest. R.N., C.A. and G.A.C. disclose that their employer, IBM Research, is the research branch of IBM Corporation. R.N, C.A. and G.A.C. own stock in IBM Corporation.

Figures

Fig. 1
Fig. 1. Clinical enrollment and characteristics: ALSFRS-R progression curves for all AALS clinic-enrolled subjects over a 40-month period.
a, Patients with AALS and control subject enrollment. b, ALSFRS-R total slope distribution. Kernel density estimation with Gaussian kernels was used to estimate the probability density function of the ALSFRS-R slope. The dashed line indicates the mean ALSFRS-R slope. c, Longitudinal ALSFRS-R measurements with fast and slow progressors. Participants with three or more visits and a maximum visit dates within 8 years of symptom onset were included. The number of participants in fast and slow progressing groups, sorted by ALSFRS-R slope, is indicated by n.
Fig. 2
Fig. 2. Smartphone use and analytics (n = 80 biologically independent samples).
a, Smartphone app compliance mean and 95% confidence interval (CI). Compliance was calculated using the average number of tasks done per day and per subject. b, Results of inferring ALSFRS-R total. Pearson’s values are shown in black contoured bars (left, y axis) and mean absolute errors of the prediction are shown in color bars with 95% CI (right, y axis). Performance values were obtained using each individual task as well as the combination of all the tasks. The highest performance was obtained using all tasks (R = 0.89, P < 1 × 10−5). LH, left hand; RH, right hand. c, Results of inferring ALSFRS-R scores using only speech-related tasks. Pearson’s values are shown in black contoured bars (left, y axis) and the mean absolute errors of the prediction are shown in color bars with 95% CI (right, y axis). Performance values were calculated independently for each of the three speech tasks to infer FVC and ALSFRS-R speech and bulbar subscores. Highest performance was obtained using information from the reading task for both ALSFRS-R subscores, obtaining up to R = 0.89 (P < 1 × 10−5) or ALSFRS-R bulbar subscore. On the other hand, counting task information produced the best result when inferring the FVC score (R = 0.65, P = 2 × 10−2).
Fig. 3
Fig. 3. Uniformity in the generation of large sets of ALS and control iPS cell lines.
Violin plots of immunofluorescent immunocytochemistry-stained diMNs cultures quantified using Image Express Micro. The iPS cells from both control and patients with ALS differentiated for 32 d after the Cedars-Sinai Biomanufacturing Center-directed diMN protocol, then fixed, immunostained and analyzed for the number of cells that stain positively for neuronal (a: NKX6.1, b: SMI32 (NEFH), c: ISL1, d: TUJ1 (TUBB3)) and non-neuronal marker proteins (e: s100β). Data are presented as a positive percentage of total DAPI-labeled nuclei; 217 different subject iPS cell lines were analyzed. There were no significant differences between ALS and control for any of the assessments.
Fig. 4
Fig. 4. Summary of variants for the AALS cohort of 830 sequences.
a, Total number of variants per participant. b, Total variants per participant based on ethnic origin. DHS, DNase 1-hypersensitive site. c, Total exonic variants. d, Nonsynonymous variant types. Each dot represents a participant. e, PCA plot revealing how the AALS samples cluster among various ancestry groups of the 1000 Genomes Project dataset. PC1 showed that African samples (green) clustered apart from the other populations and PC2 that Asian samples (red/brown) were distinct from European samples (purple), with admixed American located in between. Most of the AALS samples were clustered with the European samples, although some were closer to the African group and a few clustered with the Asian group, corroborating the NYGC ancestry results (b). f,g, Size of the repeat expansion in C9orf72 (f) and ATXN2 (g) for the AALS cohort. The graphs are based on Expansion Hunter reads for 601 sequences out of the AALS 830 samples. Top: 41 ALS cases and 4 individuals who are pre-fALS have expansions >26 repeats. Bottom: 35 ALS cases have ATXN2 expansions, whereas 4 normal controls and 1 uncharacterized individual have ATXN2 expansions >26 repeats. CTRL, controls. h,i, The relationship between repeat size in C9orf72 (h) or ATXN2 (i) and age of ALS onset (n = 830 biologically independent samples). Data are presented as mean values ± s.e.m.
Fig. 5
Fig. 5. Omics exploratory analysis of results.
a, Violin plot showing counts of RNA species identified in the current AALS samples. As expected, protein-coding and lincRNAs represent the largest proportions whereas rRNAs, which have been depleted, are the lowest. Minimal variability has been observed among samples. Types represented are: protein coding, lincRNA, miRNA, small nuclear RNA, small nucleolar RNA and rRNA in green, red, gold, purple, blue and teal, respectively (n = 102 biologically independent samples). b, Peak functional annotations. Analysis of read distribution across all ATAC-seq samples shows an enrichment in known open chromatin regions, such as DNase 1-hypersensitive sites and previously annotated enhancers and promoters (n = 100 biologically independent samples). c, The log2(protein intensity distribution) unnormalized (top) and normalized (bottom). d, The log10(protein intensity) comparison of selected proteins (PCKGM, ECH1) showing differential expression between ALS and controls. Box plots in c and d indicate median, quartiles and range (n = 66 biologically independent samples). e, Pie chart of proportions of rMATS analysis of differentially alternative splicing identified events comparing male C9orf72 ALS samples versus male controls. An FDR cutoff of 0.05 was used to define statistical significance. SE has the highest number of events (n = 617, 52%), followed by RIs (n = 409, 35%). f, The rMAPS2-based motif enrichment analysis of alternatively RIs (409 RI events) shows that the RBP-binding motif HNRNPA2B1 is significantly enriched in the male control samples versus male C9orf72 ALS samples near the RI sites. Wilcoxon’s rank-sum test (one sided) was used to get the P values for comparing up- and downregulated exons (RI) versus control/background exons. Motif scores are plotted in solid lines and P values are in dotted lines. Red designates control samples and blue the ALS. g, Heatmap of pathway activity scores defined by GSVA against MsigDB’s C2 canonical pathways from KEGG and Biocarta. The top 30 pathways are shown from comparing samples with bulbar versus limb ALS disease onset (FDR < 0.05). h, The top 14 pathways that have high Pearson’s correlation between GSVA enrichment scores and ALSFRS clinical progression slope.
Fig. 6
Fig. 6. Progressive degeneration of spinal neurons derived from patients with mutant SOD1 (diMNs) was detected by longitudinal robotic microscopy.
a, Example images of iPS diMNs over time. Control (top OYX7iCTR) and SOD1-ALS (2RJViALS) lines were transduced with the fluorescent reporter Synapsin::EGFP and differentiated for ~24 d. Cells were imaged every 24 h starting at day 24 (day 1) using robotic microscopy. Although some of the diMNs are clumped in cell clusters, sparse transfection and robotic microscopy enable them to be tracked over time (soma indicated by white arrowheads). Control neurons survive the duration of the experiment; SOD1-ALS neurons degenerate at the last time point. b, Longitudinal robotic imaging of mutant SOD1 iPS spinal neurons (2RJViALS-SOD1; 8NZiALS-SOD1) compared with two control iPS spinal neuron lines (OXY7iCTR; 2AE8iCTR) revealing time-dependent in vitro neurodegeneration. The diMNs were subjected to robotic microscopy for 7 d starting on differentiation day ~20. The rate of cell death was tracked over time and compared across lines using Cox’s proportional hazards. The diMNs from patients with ALS that harbor SOD1 mutations (2RJViALS: n = 3 and 391 neurons; 8NZPiALS: n = 2 and 221 neurons) die faster than controls (2AE8iCTR: n = 2 and 192 neurons; OYX7iCTR: n = 3 and 291 neurons). HR (hazard ratio) = 1.45; P = 0.013. Future studies of sporadic lines will be incorporated into the AALS data portal.
Extended Data Fig. 1
Extended Data Fig. 1. Answer ALS Operations.
Top. Answer ALS Research Program. Graphic illustration of overall program flow. Bottom. Clinical Sites. Participating clinics were districted nationally at 8 academic or private neurology clinics specializing in ALS clinical care and research.
Extended Data Fig. 2
Extended Data Fig. 2. Smartphone App.
a. Smartphone App. Illustrations from app of various activities. a’. Main Menu, b’. Upper limb motor tests, c’. Bulbar activities, including single breath counting, speech and cognition, d’. Example of cartoon used for speech/cognition analytics. b. Examples of speech and fine motor tasks performed by the smartphone app study participants. Data are collected with an app called “Help us Answer ALS”. Each week, the app asks the participant to perform different tasks. The tasks involve motor control in the upper body, speech and cognition. Each task is performed once per week. The speech tasks include describing a picture (a,b,c), reading a passage (d,e,f), and counting until the subject runs out of breath (not represented). Describing a picture also serves as a cognition task. The motor task involves tracing 3 different contours in sequential order (h,i,j), alternating hand each day of the week.
Extended Data Fig. 3
Extended Data Fig. 3. Production of ALS and control iPS cell spinal motor neurons.
a. Example of IPS Generation Schedule. b. Method of generating iPS cell-derived motor neuron cell lines using the diMNs protocol. c. Brightfield images show the morphology of the cells during differentiation from iPS cell stage to the generation of motor neurons over a period of 32 days. d. Production flow and harvesting schematic of diMNs for multi-omics analyses. e. Quality control of the diMNs produced from iPS cells is performed by imaging of representative wells for immunohistochemical staining with neuronal, motor neuron and glial markers after 32 days of differentiation. Scale bar=400μm. Images representative of over 600 patient cell lines.
Extended Data Fig. 4
Extended Data Fig. 4. Omics Quality Control metrics.
a. Histogram of RNA integrity numbers for current AALS samples. Density plot and histogram of RIN values for all current AALS samples with RNAseq data. Plot shows all processed samples have RIN > 8. b. fragment size distribution Size distribution of ATAC seq data, with peaks representing different n-nucleosomal fragments and clear nucleosome-free regions separated by ~147 bp, the size of a nucleosome. c. Number of Proteins and peptide identification consistency in the data generation batches of AALS samples. d. Violin plot of SERE values for RNAseq data for current AALS samples. Violin plot showing variance of SERE values in BTC (green) and BDC (red) control samples relative to all other (blue) current AALS samples. BTC shows lowest score with the least amount of variance indicating that samples are true technical replicates, while BDC and other samples show increase variance. e. Violin plot of SERE values for ATACseq data for current AALS samples. Similar to RNA data the BTC (green) show lowest variability indicating low technical confounds. f. Coefficient of Variation (CV) for Batch Technical Control (BTC) and Batch differentiation control (BDC) replicates showing 80% proteins to be under a CV of 25%.
Extended Data Fig. 5
Extended Data Fig. 5. Heatmap and hierarchical clustering of current AALS samples.
a&b. Heatmap and hierarchical clustering of SERE values using RNA/ATACseq data. Heatmap and clustering of current AALS samples using SERE values from the (a) RNAseq and (b) ATACseq data. Samples are annotated with gender, genotype, and C9orf72 mutation. No distinct clustering separates samples by these categories, but BTC sample cluster together. c. Spearman correlation matrix plot for the AALS proteomics data.
Extended Data Fig. 6
Extended Data Fig. 6. ATACSeq data.
a and b. CDFs. The number of all peaks (a) and promoter peaks (b) that are common to different numbers of samples. (c) PLEKHG4B locus. (Left) ATAC-seq read density upstream of the PLEKHG4B gene for ALS (middle) and CTR (bottom) samples. Average coverage for each group is shown at the top. (Right) Zoomed in region around the starred peak. d. Motifs. The most overrepresented genomic motifs corresponding to known transcription factors as determined by the HOMER discovery algorithm for ATAC-seq. Motifs for transcription factors implicated in neuronal identity, such as Pdx1, Cux2, and the Lhx family, are significantly enriched.

Similar articles

Cited by

  • Effects of PB-TURSO on the transcriptional and metabolic landscape of sporadic ALS fibroblasts.
    Fels JA, Dash J, Leslie K, Manfredi G, Kawamata H. Fels JA, et al. Ann Clin Transl Neurol. 2022 Oct;9(10):1551-1564. doi: 10.1002/acn3.51648. Epub 2022 Sep 9. Ann Clin Transl Neurol. 2022. PMID: 36083004 Free PMC article.
  • Targeting low levels of MIF expression as a potential therapeutic strategy for ALS.
    Alfahel L, Gschwendtberger T, Kozareva V, Dumas L, Gibbs R, Kertser A, Baruch K, Zaccai S, Kahn J, Thau-Habermann N, Eggenschwiler R, Sterneckert J, Hermann A, Sundararaman N, Vaibhav V, Van Eyk JE, Rafuse VF, Fraenkel E, Cantz T, Petri S, Israelson A. Alfahel L, et al. Cell Rep Med. 2024 May 21;5(5):101546. doi: 10.1016/j.xcrm.2024.101546. Epub 2024 May 3. Cell Rep Med. 2024. PMID: 38703766 Free PMC article.
  • Aberrant gene expression prediction across human tissues.
    Hölzlwimmer FR, Lindner J, Tsitsiridis G, Wagner N, Casale FP, Yépez VA, Gagneur J. Hölzlwimmer FR, et al. Nat Commun. 2025 Mar 29;16(1):3061. doi: 10.1038/s41467-025-58210-w. Nat Commun. 2025. PMID: 40157914 Free PMC article.
  • Large-scale differentiation of iPSC-derived motor neurons from ALS and control subjects.
    Workman MJ, Lim RG, Wu J, Frank A, Ornelas L, Panther L, Galvez E, Perez D, Meepe I, Lei S, Valencia V, Gomez E, Liu C, Moran R, Pinedo L, Tsitkov S, Ho R, Kaye JA; Answer ALS Consortium; Thompson T, Rothstein JD, Finkbeiner S, Fraenkel E, Sareen D, Thompson LM, Svendsen CN. Workman MJ, et al. Neuron. 2023 Apr 19;111(8):1191-1204.e5. doi: 10.1016/j.neuron.2023.01.010. Epub 2023 Feb 9. Neuron. 2023. PMID: 36764301 Free PMC article.
  • Poly(ADP-ribose) promotes toxicity of C9ORF72 arginine-rich dipeptide repeat proteins.
    Gao J, Mewborne QT, Girdhar A, Sheth U, Coyne AN, Punathil R, Kang BG, Dasovich M, Veire A, DeJesus Hernandez M, Liu S, Shi Z, Dafinca R, Fouquerel E, Talbot K, Kam TI, Zhang YJ, Dickson D, Petrucelli L, van Blitterswijk M, Guo L, Dawson TM, Dawson VL, Leung AKL, Lloyd TE, Gendron TF, Rothstein JD, Zhang K. Gao J, et al. Sci Transl Med. 2022 Sep 14;14(662):eabq3215. doi: 10.1126/scitranslmed.abq3215. Epub 2022 Sep 14. Sci Transl Med. 2022. PMID: 36103513 Free PMC article.

References

    1. Hovestadt V, et al. Medulloblastomics revisited: biological and clinical insights from thousands of patients. Nat. Rev. Cancer. 2020;20:42–56. doi: 10.1038/s41568-019-0223-8. - DOI - PMC - PubMed
    1. Katyal N, Govindarajan R. Shortcomings in the current amyotrophic lateral sclerosis trials and potential solutions for improvement. Front. Neurol. 2017;8:521. doi: 10.3389/fneur.2017.00521. - DOI - PMC - PubMed
    1. Philips T, Rothstein JD. Rodent models of amyotrophic lateral sclerosis. Curr. Protoc. Pharm. 2015;69:5 67 61–21. doi: 10.1002/0471141755.ph0567s69. - DOI - PMC - PubMed
    1. Donnelly CJ, et al. RNA toxicity from the ALS/FTD C9ORF72 expansion is mitigated by antisense intervention. Neuron. 2013;80:415–428. doi: 10.1016/j.neuron.2013.10.015. - DOI - PMC - PubMed
    1. Sareen D, et al. Targeting RNA foci in iPSC-derived motor neurons from ALS patients with a C9ORF72 repeat expansion. Sci. Transl. Med. 2013;5:208ra149. doi: 10.1126/scitranslmed.3007529. - DOI - PMC - PubMed

Publication types

MeSH terms

Supplementary concepts