. 2022 Feb;25(2):213-225.
doi: 10.1038/s41593-021-00999-y. Epub 2022 Feb 3.

Large-scale deep multi-layer analysis of Alzheimer's disease brain reveals strong proteomic disease-related changes not observed at the RNA level

Affiliations

Large-scale deep multi-layer analysis of Alzheimer's disease brain reveals strong proteomic disease-related changes not observed at the RNA level

Erik C B Johnson et al. Nat Neurosci. 2022 Feb.

Abstract

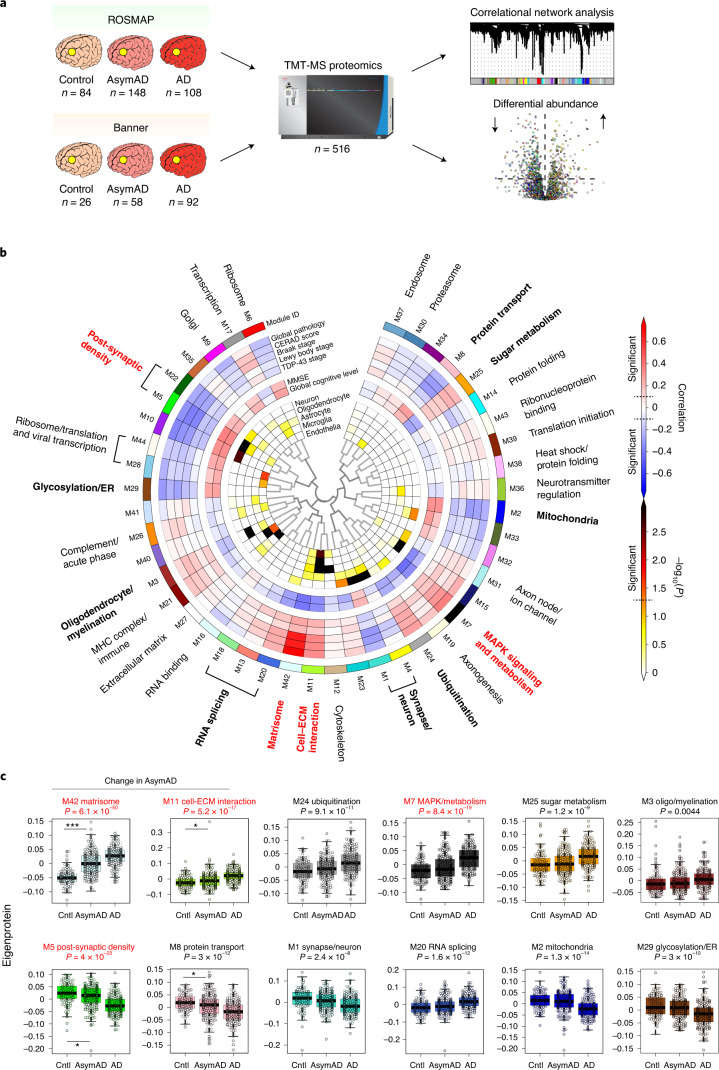
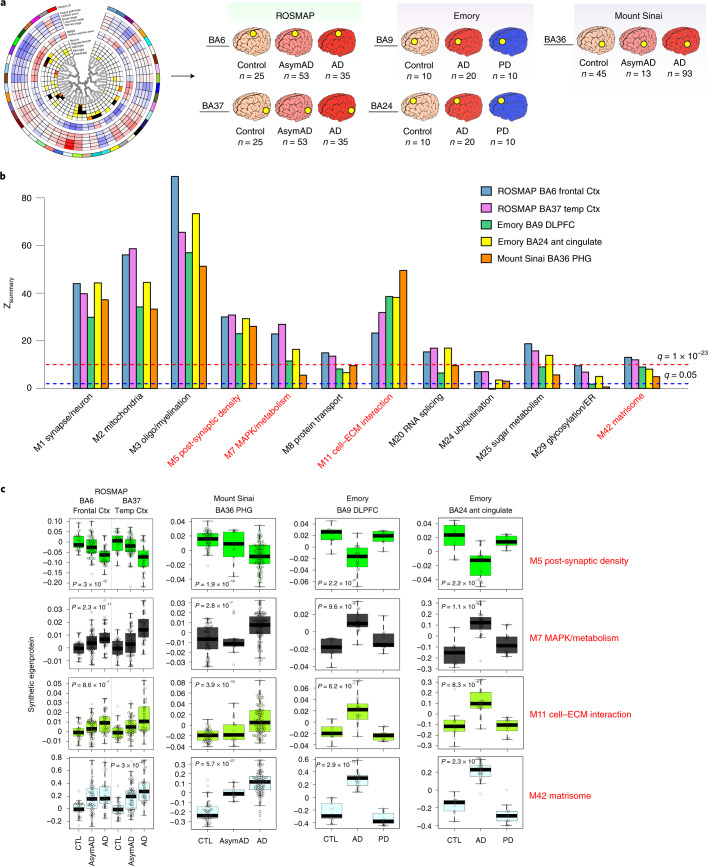
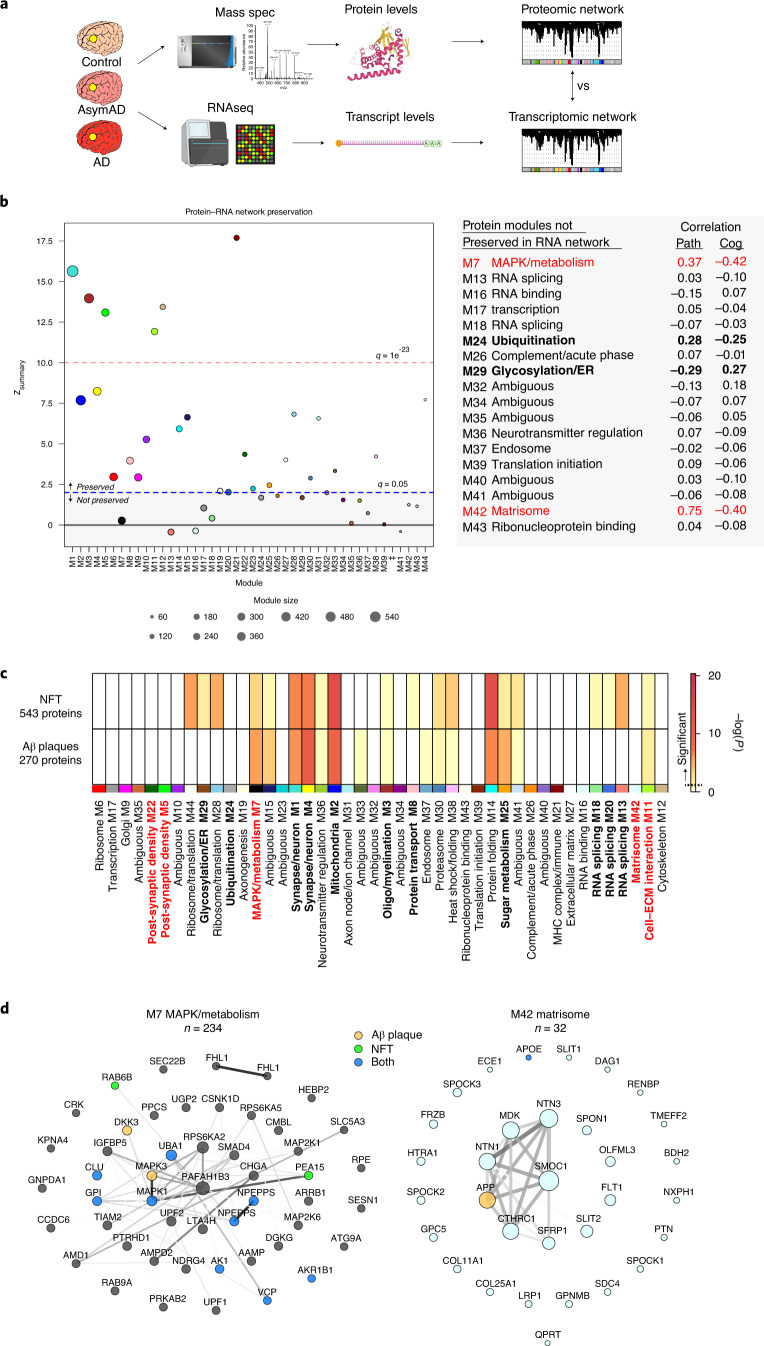
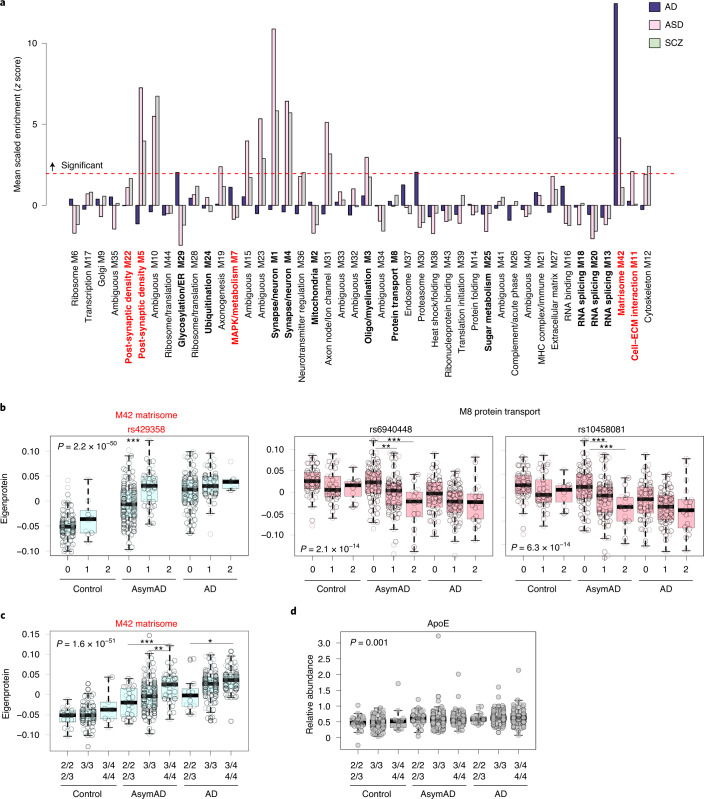
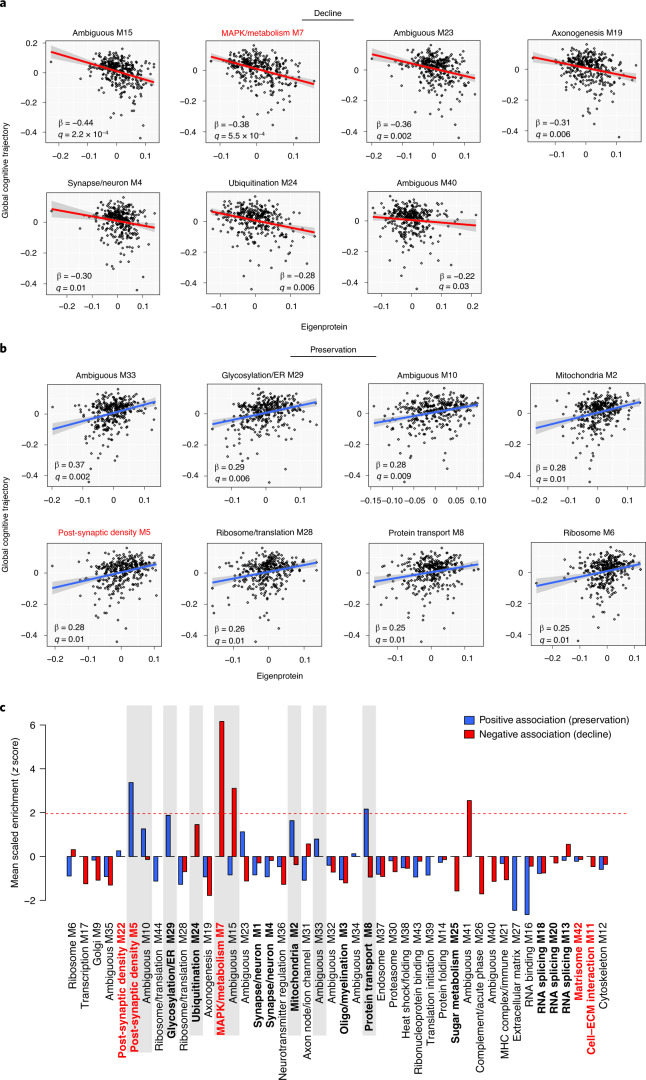
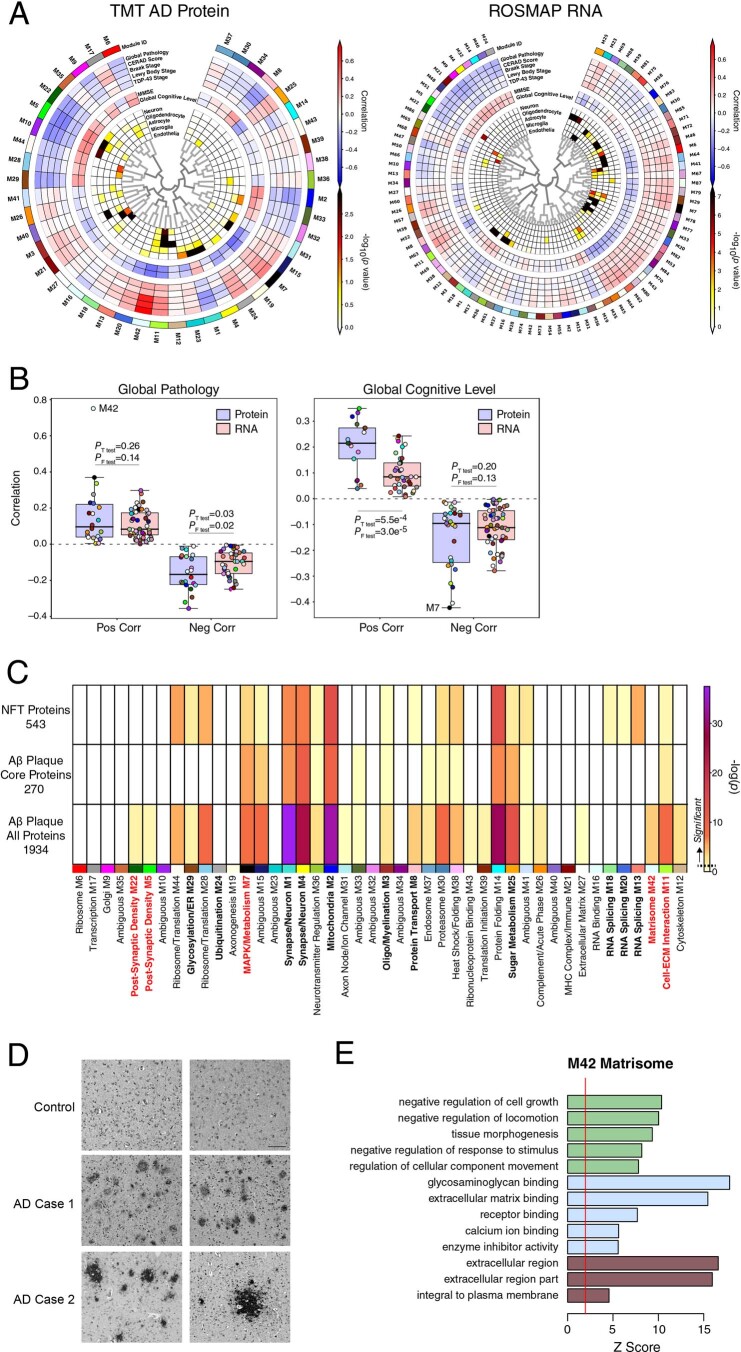
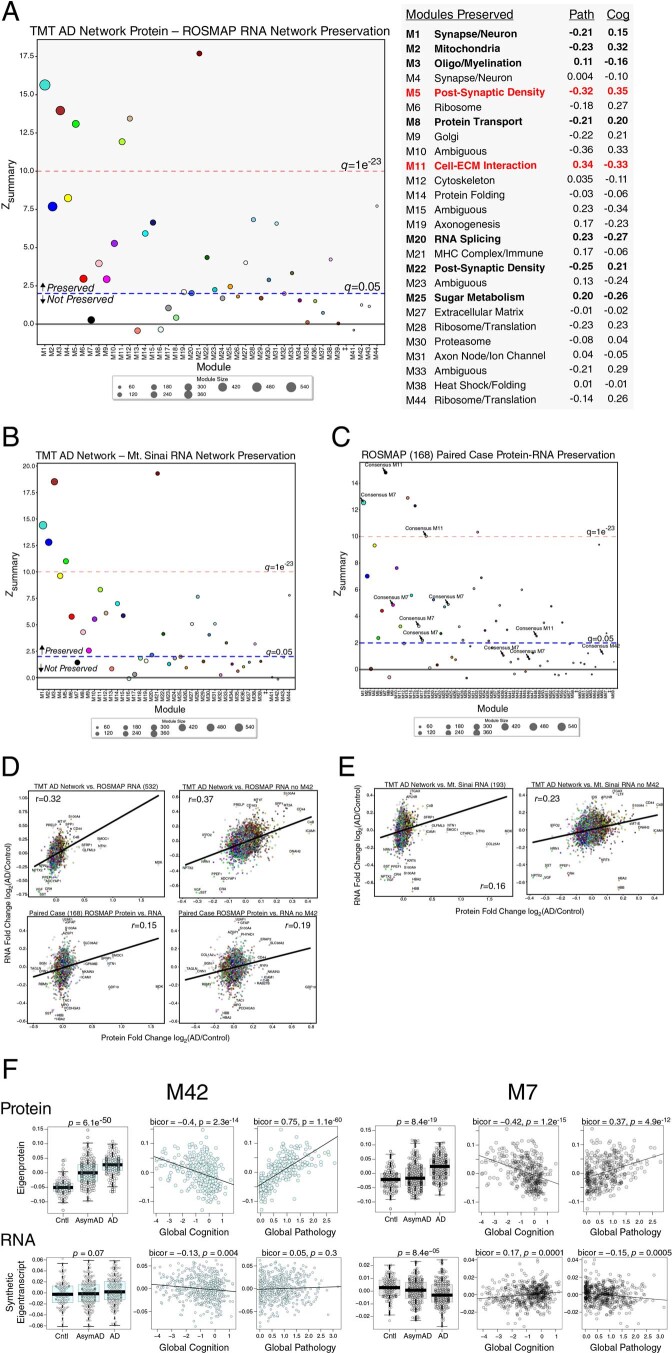
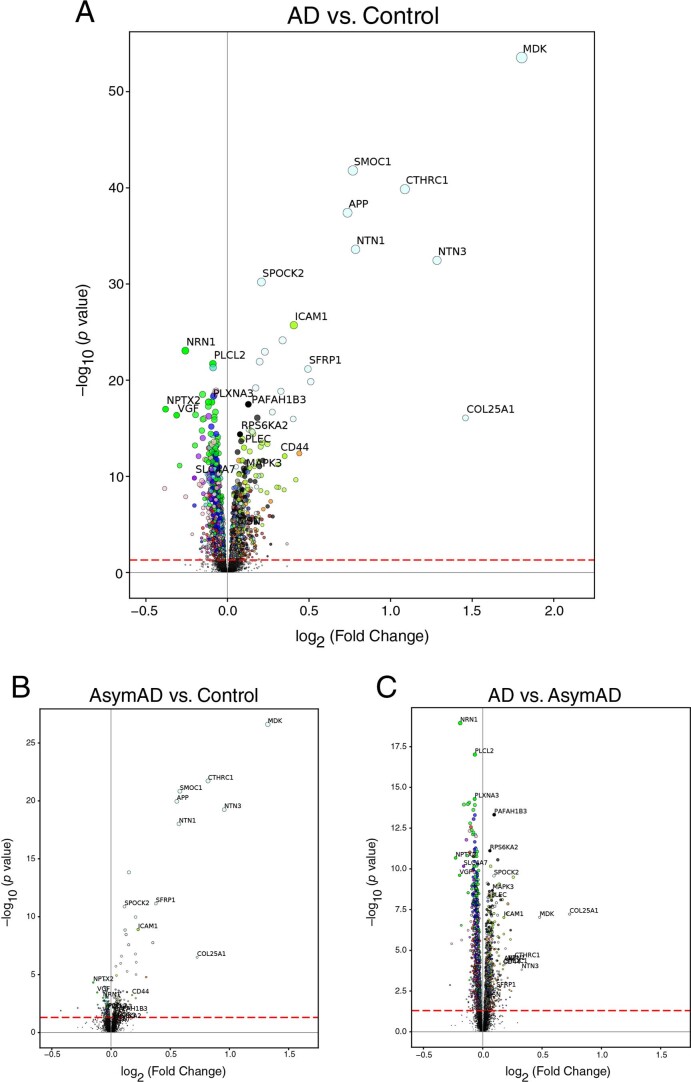
The biological processes that are disrupted in the Alzheimer's disease (AD) brain remain incompletely understood. In this study, we analyzed the proteomes of more than 1,000 brain tissues to reveal new AD-related protein co-expression modules that were highly preserved across cohorts and brain regions. Nearly half of the protein co-expression modules, including modules significantly altered in AD, were not observed in RNA networks from the same cohorts and brain regions, highlighting the proteopathic nature of AD. Two such AD-associated modules unique to the proteomic network included a module related to MAPK signaling and metabolism and a module related to the matrisome. The matrisome module was influenced by the APOE ε4 allele but was not related to the rate of cognitive decline after adjustment for neuropathology. By contrast, the MAPK/metabolism module was strongly associated with the rate of cognitive decline. Disease-associated modules unique to the proteome are sources of promising therapeutic targets and biomarkers for AD.


Conflict of interest statement

The authors declare no competing financial interests.

Figures

Fig. 1
Fig. 1. TMT AD protein co-expression network.
a–c, 516 DLPFC tissues from the ROSMAP (n = 84 control, 148 AsymAD and 108 AD) and the Banner Sun Health Brain Bank (Banner, n = 26 control, 58 AsymAD and 92 AD) were analyzed by TMT-MS-based proteomics (a). After outlier removal and data processing, a total of 8,619 proteins were quantified across 488 cases, which were analyzed by both differential expression and co-expression approaches. b, A protein co-expression network was built using WGCNA, which consisted of 44 protein co-expression modules. Module relatedness is shown in the central dendrogram. GO analysis was used to identify the principal biology represented by each module. Modules that did not have a clear ontology were not assigned an ontology term. Module eigenproteins were correlated with neuropathological and cognitive traits present in the ROSMAP and Banner cohorts (red, positive correlation; blue, negative correlation). The global pathology, Lewy body stage, TDP-43 stage and global cognitive level traits were present only in ROSMAP. Twelve of the 44 modules that were most highly correlated to neuropathological and/or cognitive traits are in bold, with the four most strongly trait-related modules highlighted in red. The cell type nature of each module was assessed by module protein overlap with cell-type-specific marker lists of neurons, oligodendrocytes, astrocytes, microglia and endothelia. c, Module eigenprotein levels by case status for the 12 most strongly trait-correlated modules bolded in b. Modules are grouped by those that change in AsymAD (n = 4, left) and those that change only in AD (n = 8, right). n = 106 control, 200 AsymAD and 182 AD. Differences in module eigenprotein by case status were assessed by one-way ANOVA with Tukey test. *P < 0.05 and ***P < 0.001. Box plots represent the median and 25th and 75th percentiles, and box hinges represent the interquartile range of the two middle quartiles within a group. Data points up to 1.5 times the interquartile range from the box hinge define the extent of whiskers (error bars). Cntl, control; MHC, major histocompatibility complex.
Fig. 2
Fig. 2. Preservation of the TMT AD network across different cohorts, centers, methods and brain regions.
ac, Module preservation and synthetic eigenprotein analysis of the TMT AD network generated from DLPFC BA9 tissues was performed in ROSMAP BA6 (frontal cortex) and BA37 (temporal cortex), Emory BA9 (DLPFC) and BA24 (anterior cingulate) and Mount Sinai Brain Bank BA36 PHG tissues (a). The Emory tissues included PD cases and were analyzed using a different TMT quantification approach (SPS-MS3). The Mount Sinai tissues were processed and analyzed by MS2-based TMT-MS at a different center. b, Module preservation of the 12 trait-correlated modules highlighted in Fig. 1b,c. Modules that had a Zsummary score greater than or equal to 1.96 (or q = 0.05, blue dotted line) were considered to be preserved, whereas modules that had a Zsummary score greater than or equal to 10 (or q = 1 × 10⁻²³, red dotted line) were considered to be highly preserved. Preservation statistics for all TMT AD network modules are provided in Extended Data Fig. 3. c, Module eigenprotein level by case status was assessed in the different cohorts and brain regions shown in a by measuring a TMT AD network synthetic eigenprotein, representing the top 20% of module proteins by module kME, in each cohort and region. Synthetic eigenprotein levels are shown for the four most highly trait-correlated TMT AD network modules. Differences and statistics for all modules are provided in Supplementary Table 17. ROSMAP BA6 n = 25 control, 53 AsymAD, 35 AD; ROSMAP BA37 n = 25 control, 53 AsymAD, 35 AD; Emory BA9 n = 10 control, 20 AD, 10 PD; Emory BA24 n = 10 control, 20 AD, 10 PD; Mount Sinai BA36 n = 45 control, 13 AsymAD, 93 AD. Differences in synthetic eigenprotein levels were assessed by one-way ANOVA. Box plots represent the median and 25th and 75th percentiles, and box hinges represent the interquartile range of the two middle quartiles within a group. Data points up to 1.5 times the interquartile range from the box hinge define the extent of whiskers (error bars). ant, anterior; CTL, control; Ctx, cortex, temp, temporal.
Fig. 3
Fig. 3. The TMT AD protein network contains modules associated with AD that are not present in the transcriptome.
ad, Control, AsymAD and AD frontal cortex tissues from both the ROSMAP cohort (BA9; control = 125, AsymAD = 204, AD = 203; 168 overlapping cases with proteomic analysis) and the Mount Sinai Brain Bank (BA10; control = 54, AsymAD = 19, AD = 120) were analyzed by RNA-seq-based transcriptomics and co-expression networks generated by WGCNA in similar fashion to the TMT AD protein network (a). b, Module preservation of the TMT AD protein network into the ROSMAP RNA network. Modules that had a preservation Zsummary score less than 1.96 (q > 0.05) were not considered to be preserved. Modules that had a Zsummary score greater than or equal to 1.96 (or q = 0.05, blue dotted line) were considered to be preserved, whereas modules that had a Zsummary score greater than or equal to 10 (or q = 1 × 10⁻²³, red dotted line) were considered to be highly preserved. TMT AD network modules that were not preserved in the RNA network, along with their correlation to global pathology and global cognition traits in ROSMAP, are listed on the right. Additional information on modules preserved in ROSMAP, as well as preservation analysis with the Mount Sinai cohort, are provided in Extended Data Fig. 5a,b. c, TMT AD network module protein overlap with proteins identified as co-localized with NFTs (n = 543) and Aβ plaques (n = 270) as described by Drummond et al.,. Overlap as shown with a dark yellow hue or darker is considered significant. Overlap with a less stringent set of Aβ plaque-associated proteins is provided in Extended Data Fig. 4c. d, The top 50 proteins by module kME for the M7 MAPK/metabolism (left, n = 234 total proteins) and M42 matrisome (right, n = 32 total proteins) modules. Module proteins that were found to be co-localized with NFTs (green), Aβ plaques (orange) or both (blue) are highlighted. Lines between proteins represent correlation matrix adjacency weights. Graphs for all TMT AD network modules are provided in Supplementary Data. Cog, cognition; Path, pathology.
Fig. 4
Fig. 4. The M42 matrisome module is enriched in AD genetic risk and is increased by APOE ε4.
a, b, Enrichment of AD genetic risk factor proteins as identified by GWAS in TMT AD network modules (a). The dashed red line indicates a Z score of 1.96 (P = 0.05), above which enrichment was considered significant. Enrichment in M42 is driven by ApoE. Modules are ordered by relatedness as illustrated in Fig. 1b. b, Module eigenprotein levels by allele dose (0, 1, 2) for the three SNPs identified as proximal mod-QTLs, separated by case status. M42 rs429358 AsymAD (0, 1) P = 6.9 × 10–07; M8 rs6940448 AsymAD (0,1) P = 0.003, AsymAD (0, 2) P = 5.5 × 10⁻⁶; M8 rs10458081 AsymAD (0, 1) P = 0.0007, AsymAD (0, 2) P = 6.7 × 10⁻⁵. M42 rs429358 n = 93 control (0), 10 control (1), 138 AsymAD (0), 43 AsymAD (1), 95 AD (0), 51 AD (1), 5 AD (2). M8 rs6940448 n = 52 control (0), 40 control (1), 11 control (2), 80 AsymAD (0), 81 AsymAD (1), 20 AsymAD (2), 60 AD (0), 70 AD (1), 21 AD (2). M8 rs10458081 n = 52 control (0), 40 control (1), 11 control (2), 77 AsymAD (0), 85 AsymAD (1), 19 AsymAD (2), 61 AD (0), 70 AD (1), 20 AD (2). c, M42 matrisome module eigenprotein levels by APOE genotype, separated by case status. AsymAD 2/2 or 2/3 to 3/4 or 4/4 P = 0.0002; AsymAD 3/3 to 3/4 or 4/4 P = 0.005; AD 2/3 to 3/4 or 4/4 P = 0.01. Control n = 20 (2/2 or 2/3), 75 (3/3), 10 (3/4 or 4/4); AsymAD n = 26 (2/2 or 2/3), 122 (3/3), 45 (3/4 or 4/4); AD n = 15 (2/3), 97 (3/3), 66 (3/4 or 4/4). d, ApoE levels by APOE genotype, separated by case status. ApoE is increased in AsymAD and AD, but APOE genotype does not affect ApoE levels. Control n = 20 (2/2 or 2/3), 75 (3/3), 10 (3/4 or 4/4); AsymAD n = 26 (2/2 or 2/3), 122 (3/3), 45 (3/4 or 4/4); AD n = 15 (2/3), 97 (3/3), 66 (3/4 or 4/4). Full statistics are provided in Supplementary Table 26. Differences in eigenprotein levels were assessed by one-way ANOVA with Tukey test. Only significant differences within case status group are shown. *P < 0.05, **P < 0.01 and ***P < 0.001. Box plots represent the median and 25th and 75th percentiles, and box hinges represent the interquartile range of the two middle quartiles within a group. Data points up to 1.5 times the interquartile range from the box hinge define the extent of whiskers (error bars). MHC, major histocompatibility complex.
Fig. 5
Fig. 5. The M7 MAPK/metabolism module is associated with cognitive decline.
ac, TMT AD network modules associated with cognitive decline (a) or cognitive preservation (b) after adjustment for ten neuropathologies in ROSMAP. Eigenprotein values are plotted against the rate of cognitive change during life for each participant in ROSMAP (n = 328). Decline is highlighted in red; preservation is highlighted in blue. β is the effect size of module eigenprotein on cognitive trajectory after adjustment for neuropathology; q is the FDR significance level of this effect. Shaded areas represent 95% confidence intervals for β values. Information on the association between all TMT AD network module eigenproteins and cognitive trajectory before and after adjustment for neuropathology is provided in Supplementary Table 27. c, TMT AD network module enrichment of proteins positively associated with cognitive resilience (that is, preservation) or negatively associated with cognitive resilience (that is, decline) identified in a previous PWAS of cognitive resilience in the ROSMAP cohort. The dashed red line indicates a Z score of 1.96 (P = 0.05), above which enrichment was considered significant. Modules that are shaded are consistent with results in a and b. Modules are ordered by relatedness as illustrated in Fig. 1b. MHC, major histocompatibility complex.
Extended Data Fig. 1
Extended Data Fig. 1. Percent Protein Coverage by TMT-MS and TMT-MS Batch Correction.
(a) Percent protein coverage for all proteins measured (n = 13,541) and those measured in at least 50% of cases (n = 8,619), which was the threshold for inclusion in the co-expression network. The vertical dashed lines represent median percent coverage for each distribution. (b–d) TMT-MS batch correction as illustrated by multidimensional scaling (MDS). Starting log2 abundance, log2 abundance divided by the global internal standard (GIS), and additional batch correction by the TAMPOR algorithm in the ROSMAP cohort (b) and the Banner cohort (c) separately, followed by final cohort correction (d). Each batch is designated an arbitrary color in the first two panels in (b) and (c). dim, dimension; logFC, log fold change.
Extended Data Fig. 2
Extended Data Fig. 2. LFQ and TMT AD Network Comparison.
(a–d) LFQ AD network module preservation in the TMT AD network (a). Modules that had a Zsummary score of greater than or equal to 1.96 (or q = 0.05, blue dotted line) were considered to be preserved, while modules that had a Zsummary score greater than or equal to 10 (or q = 1e−23, red dotted line) were considered to be highly preserved. (b) Preservation of the TMT AD network built using the weighted correlational network algorithm (WGCNA) into the network built on the same matrix using the MONET M1 algorithm. (c) Module member overrepresentation analysis (ORA) of the LFQ and TMT AD networks. The dashed red box highlights modules that are unique to the TMT network. The numbers in each box represent the –log10(FDR) value for the overlap. The heatmap is thresholded at a minimum of FDR(0.1) for clarity. (d) Percent novelty of TMT network module protein members compared to LFQ network proteins for all module members (black) or the top 20% of module proteins by strength of correlation to the module eigenprotein (kME) (blue). The dashed line indicates 50% novel protein members. Bars are shaded according to P value significance. ORA and percent novelty P values were corrected by the Benjamini-Hochberg procedure. * <0.05, ** <0.01, *** <0.005.
Extended Data Fig. 3
Extended Data Fig. 3. TMT AD Network Module Preservation.
Modules that had a Zsummary score of greater than or equal to 1.96 (or q = 0.05, blue dotted line) were considered to be preserved, while modules that had a Zsummary score greater than or equal to 10 (or q = 1e−23, red dotted line) were considered to be highly preserved. AD, Alzheimer’s disease; Aβ, amyloid-β; AsymAD, asymptomatic Alzheimer’s disease; BA, Brodmann area; ECM, extracellular matrix; ER, endoplasmic reticulum; MAPK, mitogen-activated protein kinase.
Extended Data Fig. 4
Extended Data Fig. 4. Protein and RNA AD Network Trait Correlations and TMT AD Network Module Overlap with Neurofibrillary Tangle and Aβ Plaque Proteins.
(a-b) Module trait correlation analysis between protein and RNA networks. (a) WGCNA networks of TMT AD protein (left) and ROSMAP RNA (right). Protein and RNA data were obtained from the same brain region (dorsolateral prefrontal cortex, Brodmann area 9), with 168 ROSMAP cases shared between networks. Module eigenprotein to trait correlations are shown by red and blue heatmap. (b) Protein and RNA network module correlations with global pathology (left; n = 22 positive protein, 22 negative protein, 50 positive RNA, 38 negative RNA) and global cognitive level (right; n = 17 positive protein, 27 negative protein, 35 positive RNA, 53 negative RNA) as measured in ROSMAP. Differences in overall positive and negative correlations between protein and RNA modules were assessed by two-sided Welch’s t test, whereas differences in overall variation in correlation were measured by F test. P values for each test are provided. Boxplots represent the median, 25th, and 75th percentiles, and box hinges represent the interquartile range of the two middle quartiles within a group. Datapoints up to 1.5 times the interquartile range from box hinge define the extent of whiskers (error bars). (c) TMT AD network module protein overlap with proteins identified as co-localized with neurofibrillary tangles (NFTs, n = 543) and amyloid-β (Aβ) plaques as described by Drummond et al.,. Overlap with Aβ plaques was performed with a set of proteins consistently observed in Aβ plaques across multiple experiments (Aβ plaque core proteins, n = 270), as well as with a set of proteins that included proteins observed only once across multiple experiments (Aβ plaque all proteins, n = 1934). Overlap was performed with one-sided Fisher’s exact test, and corrected by the Benjamini-Hochberg procedure. (d) Immunohistochemistry of midkine (MDK), a hub protein of the M42 matrisome module, in control and AD brain. Two out of three independent experiments are shown as representative. Scale bar represents 500 µM. (E) Gene ontology analysis of the M42 matrisome module, including biological process (green), molecular function (blue), and cellular component (brown) ontologies. The red line indicates a z score of 1.96, or p = 0.05.
Extended Data Fig. 5
Extended Data Fig. 5. TMT AD Network Module Preservation in RNA Networks.
(a–f) Module preservation of the TMT AD protein network into the ROSMAP RNA network (A). Modules that had a preservation Zsummary score less than 1.96 (q > 0.05) were not considered to be preserved. Modules that had a Zsummary score of greater than or equal to 1.96 (or q = 0.05, blue dotted line) were considered to be preserved, while modules that had a Zsummary score greater than or equal to 10 (or q = 1e−23, red dotted line) were considered to be highly preserved. TMT AD network modules that were preserved in the RNA network, along with their correlation to global pathology and global cognition traits in ROSMAP, are listed on the right. (b) Module preservation of the TMT AD protein network into the Mt. Sinai RNA network. (c) Module preservation of the ROSMAP 168 protein network into the paired case RNA network. AD protein network module assignments are provided for M7, M11, and M42. Additional module assignments are provided in Supplementary Table 21. (d) Correlation of AD versus control RNA and protein levels between the TMT protein and ROSMAP RNA (n = 532 cases) networks (top), as well as between cases paired between protein and RNA in ROSMAP (n = 168), including (left) or excluding (right) M42 proteins. (E) Correlation of AD versus control RNA and protein levels between the TMT protein and Mt. Sinai RNA (n = 193 cases) networks, including (left) or excluding (right) M42 proteins. Correlations were performed using Pearson correlation. (f) Comparison of M42 matrisome (left) and M7 MAPK/metabolism (right) eigenprotein (top; n = 106 control, 200 AsymAD, 182 AD, Total=488) and synthetic eigentranscript (bottom; n = 125 control, 204 AsymAD, 203 AD, Total=532) in ROSMAP cases levels by case status, and correlation with global pathology (n = 328 eigenprotein, 532 eigentranscript) and global cognitive function (n = 328 eigenprotein, 529 eigentranscript) in ROSMAP. Differences were assessed by one-way ANOVA. Correlations were performed using bicor. Boxplots represent the median, 25th, and 75th percentiles, and box hinges represent the interquartile range of the two middle quartiles within a group. Datapoints up to 1.5 times the interquartile range from box hinge define the extent of whiskers (error bars).
Extended Data Fig. 6
Extended Data Fig. 6. TMT AD Network Protein Differential Expression.
(a–c) Differential expression between AD versus control (a), AsymAD versus control (B), and AsymAD versus AD (c). The dashed red line indicates a P value of 0.05, above which proteins are considered significantly differentially expressed. Proteins are colored by the network module in which they reside, according to the module color scheme provided in Fig. 1b. Proteins in the M42 matrisome module are colored lightcyan. One-way ANOVA followed by two-tailed pairwise test was used to calculate P values. Significance was adjusted by the Holm procedure. Fold change and statistics for all proteins are provided in Supplementary Table 2.

Comment in

References

    1. Karch CM, Goate AM. Alzheimer’s disease risk genes and mechanisms of disease pathogenesis. Biol. Psychiatry. 2015;77:43–51. - PMC - PubMed
    1. Yang HS, et al. Genetics of gene expression in the aging human brain reveal TDP-43 proteinopathy pathophysiology. Neuron. 2020;107:496–508. - PMC - PubMed
    1. Ting L, Rad R, Gygi SP, Haas W. MS3 eliminates ratio distortion in isobaric multiplexed quantitative proteomics. Nat. Methods. 2011;8:937–940. - PMC - PubMed
    1. Rauniyar N, Yates JR., 3rd Isobaric labeling-based relative quantification in shotgun proteomics. J. Proteome Res. 2014;13:5293–5309. - PMC - PubMed
    1. Ping L, et al. Global quantitative analysis of the human brain proteome and phosphoproteome in Alzheimer’s disease. Sci. Data. 2020;7:315. - PMC - PubMed

Publication types