

Modelling COVID-19 Scenarios for the States and Federal Territories of Malaysia
- PMID: 35115883
- PMCID: PMC8793970
- DOI: 10.21315/mjms2021.28.5.1
Modelling COVID-19 Scenarios for the States and Federal Territories of Malaysia
Abstract
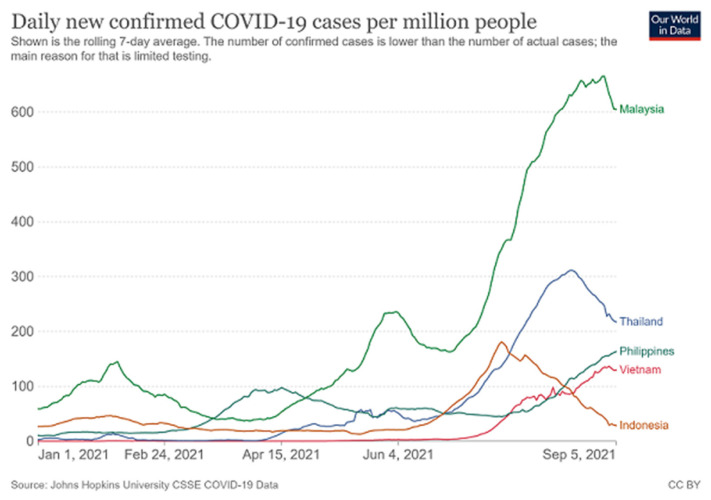
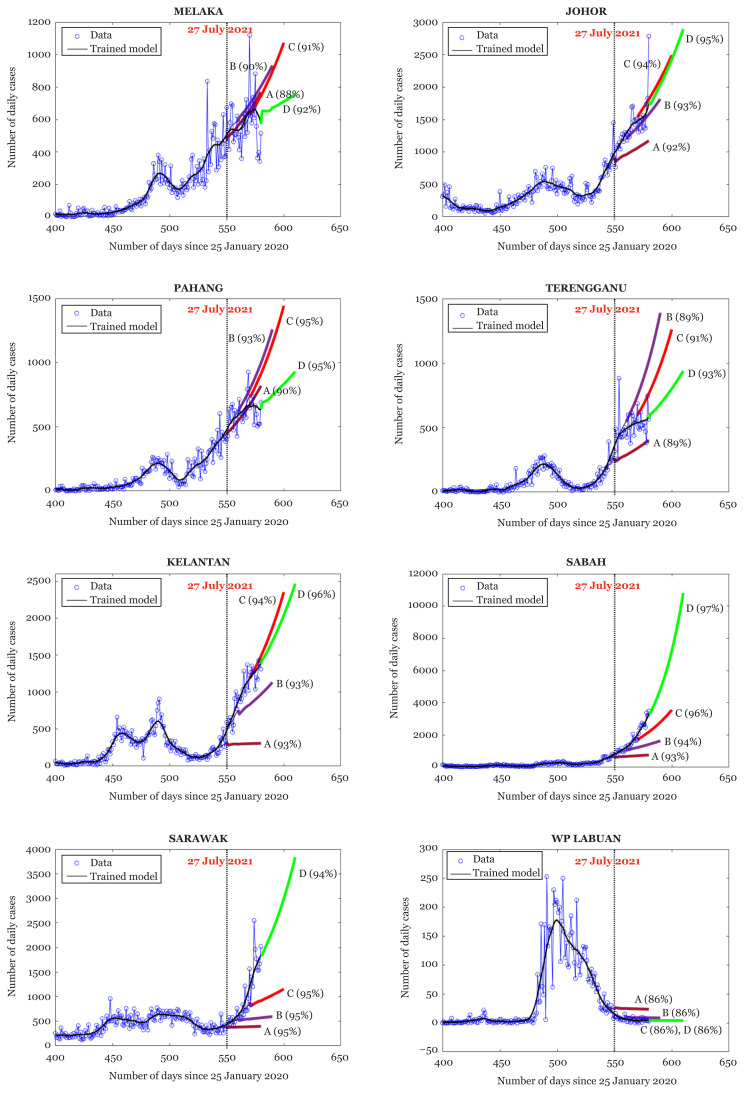
Severe acute respiratory syndrome coronavirus 2 (SARS-CoV-2) causes COVID-19 disease, which has become pandemic since December 2019. In the recent months, among five countries in the Southeast Asia, Malaysia has the highest per-capita daily new cases and daily new deaths. A mathematical modelling approach using a Singular Spectrum Analysis (SSA) technique was used to generate data-driven 30-days ahead forecasts for the number of daily cases in the states and federal territories in Malaysia at four consecutive time points between 27 July 2021 and 26 August 2021. Each forecast was produced using SSA prediction model of the current major trend at each time point. The objective is to understand the transition dynamics of COVID-19 in each state by analysing the direction of change of the major trends during the period of study. The states and federal territories in Malaysia were grouped in four categories based on the nature of the transition. Overall, it was found that the COVID-19 spread has progressed unevenly across states and federal territories. Major regions like Selangor, Kuala Lumpur, Putrajaya and Negeri Sembilan were in Group 3 (fast decrease in infectivity) and Labuan was in Group 4 (possible eradication of infectivity). Other states e.g. Pulau Pinang, Sabah, Sarawak, Kelantan and Johor were categorised in Group 1 (very high infectivity levels) with Perak, Kedah, Pahang, Terengganu and Melaka were classified in Group 2 (high infectivity levels). It is also cautioned that SSA provides a promising avenue for forecasting the transition dynamics of COVID-19; however, the reliability of this technique depends on the availability of good quality data.
Keywords: COVID-19 forecast; data-driven approach; singular spectrum analysis; transition dynamics.
© Penerbit Universiti Sains Malaysia, 2021.
Conflict of interest statement
Conflict of Interest None.
Figures


References
-
- World Health Organization (WHO) Novel Coronavirus (2019-nCoV) situation report. World Health Organization; 2020. https://www.who.int/docs/default-source/coronaviruse/situation-reports/2... .
-
- Worldometers. COVID-19 coronavirus pandemic cases [Internet] 2020. [Retrieved 2021 Aug 16]. Available at: https://www.worldometers.info/coronavirus/
Publication types
LinkOut - more resources
Full Text Sources
Research Materials
Miscellaneous