. 2021 Feb;10(2):899-913.
doi: 10.21037/tcr-20-2738.

Combinatorial sympathetic and cytotoxic T-lymphocyte-associated protein 4 (CTLA-4) blockades inhibit the murine melanoma growth by targeting infiltrating T cells

Affiliations

Combinatorial sympathetic and cytotoxic T-lymphocyte-associated protein 4 (CTLA-4) blockades inhibit the murine melanoma growth by targeting infiltrating T cells

Bin Wang et al. Transl Cancer Res. 2021 Feb.

Abstract

Background: Failure of the proliferation and infiltration of tumor-specific T cells in tumor site has been considered as one of important reasons induce the inefficiencies of immune checkpoint therapies in advanced cancers. Therefore, we aimed to demonstrate how combinatorial sympathetic and cytotoxic T-lymphocyte-associated protein 4 (CTLA-4) blockade affects the tumor growth of melanoma-bearing mice and potential mechanisms.

Methods: Tumor growth was measured and the infiltrating immune cell populations were observed with flow cytometry in B16-F10 melanoma-bearing mice treated with combined sympathetic and immune checkpoint blockade, using anti-CTLA-4 antibodies. The expression of adrenergic receptors was investigated in human peripheral blood mononuclear cells and their subpopulations, and the proliferation of T cell subsets was detected when stimulated by norepinephrine and its antagonists.

Results: B16-F10 tumor growth was associated with infiltrating CD8+ T cells. Combinatorial sympathetic and CTLA-4 blockade inhibited tumor growth and enhanced CD8+ infiltration. Meanwhile, all β1, β2 and β3 adrenergic receptors were found to be expressed in human peripheral blood mononuclear cells, activated T cells, monocytes, and monocyte-induced dendritic cells. β2-adrenergic receptors were expressed in most CD4+ T cells with increased expression in activated CD8+ T cells. Moreover, norepinephrine was able to prevent CD4+ T cell proliferation and β2-adrenergic receptor antagonists could reverse the inhibition of CD4+, but not CD8+ cell proliferation.

Conclusions: We conclude that the combination of sympathetic and CTLA-4 inhibitors is more effective for inhibiting melanoma progression than a single treatment and might enhance the infiltration of T cells in the tumor site, offering a novel therapeutic approach for immune checkpoint targeting.

Keywords: Sympathetic nerve system; T cells; cytotoxic T-lymphocyte-associated protein 4 inhibitor (CTLA-4 inhibitor); melanoma; β2-adrenergic receptor.


Conflict of interest statement

Conflicts of Interest: All authors have completed the ICMJE uniform disclosure form (available at http://dx.doi.org/10.21037/tcr-20-2738). Dr. MJ reports personal fees from Astrazeneca Japan, outside the submitted work. The other authors have no conflicts of interest to declare.

Figures

Figure 1
Figure 1
The effect of anti-PD-1 and anti-CTLA-4 antibodies on the tumor growth in B16-F10-bearing mice. (A) A schematic diagram illustrating the chronological events of experiments (n=8). (B) Tumor growth kinetics in anti-PD-1 day 1-4-7, anti-PD-1 day 11-14-17 or anti-CTLA-4 day 1-4-7 treated B16-F10-bearing mice, compared with vehicle (n=2). Data are mean ± SEM. (C,D,E,F,G,H) The correlation of tumor size and tumor-infiltrating and splenic immune cell population infiltrating CD45+CD3+ (C), CD45+CD3+CD8+ T cells (D), CD45+CD3+CD4+ T cells (E) and CD45+CD11b+ myeloid cells (F), splenic CD45+CD3+CD8+ (G) and CD45+CD3+CD4+ T cells (H). VE, vehicle; PD1, anti-PD-1 day 1-4-7; PD11, anti-PD-1 day 11-14-17; CT, anti-CTLA-4 day 1-4-7; PD-1, programmed cell death-1; CTLA-4, cytotoxic T-lymphocyte-associated protein 4.
Figure 2
Figure 2
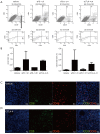
The effect of anti-PD-1 and anti-CTLA-4 antibodies on the infiltrating T cell population in B16-F10-bearing mice. (A) Dot plots depicting live cell-gated CD45+CD3+CD8+ and CD45+CD3+CD4+ T cell proportions in the tumor of B16-F10-bearing mice (n=8) in indicated treatments. (B) Quantification of CD45+CD3+ and CD45+CD3+CD8+ T cell proportions in the tumor site of B16-F10-bearing mice in indicated treatment groups (n=2), data are mean ± SEM. (C,D) Representative images of multiple staining with PE-labeled anti-CD45, FITC-labeled anti-CD8 and DAPI in the tumor center region of vehicle (C) or anti-CTLA-4 mice (D). Scale bars, 20 µm. CTLA-4, cytotoxic T-lymphocyte-associated protein 4; SEM, standard error of the mean; FITC, fluorescein isothiocyanate.
Figure 3
Figure 3
The combinatorial sympathetic and CTLA-4 blockade attenuate B16-F10 tumor growth and enhance T cells infiltration. (A) A schematic diagram illustrating the chronological events of experiments (n=12). (B,C) Representative IF images of NF-200 or TH staining on two continuous splenic sections in vehicle (B) or 6OHDA treated mice (C). Scale bars, 20 µm. (D) Tumor growth kinetics in 6OHDA and combinatorial therapy (6OHDA + anti-CTLA-4 antibodies) treated B16-F10-bearing mice, compared with vehicle (n=4). Data are mean ± SEM. , P<0.05; ★★, P<0.01 vs. vehicle. (E,F,G) Images of multiple staining with PE-labeled anti-CD45, FITC-labeled anti-CD8 and DAPI in the tumor center region of vehicle (E), 6OHDA (F) or 6OHDA + anti-CTLA-4 treated mice (G). Scale bars, 20 µm. (H) Quantification of CD45+CD3+ and CD45+CD3+CD8+ T cell proportions in the tumor site of B16-F10-bearing mice in indicated treatment groups (n=4). Data are mean ± SEM, , P<0.05 vs. vehicle; , P<0.05 vs. 6OHDA. 6OHDA, 6-hydroxydopamine; CTLA-4, cytotoxic T-lymphocyte-associated protein 4; IF, immunofluorescent; NF-200, neurofilament 200; TH, tyrosine hydroxylase; SEM, standard error of the mean; PE, phycoerythrin; FITC, fluorescein isothiocyanate.
Figure 4
Figure 4
The expression of β adrenergic receptors (ARs) in immune cell sup-populations. (A) Expression of genes encoding β1-, β2- and β3-ARs in fresh human PBMC, CD3-stimulated PBMC, CD14+ peripheral monocyte, CD14+ monocyte-derived dendritic cells. RT-free indicates no reverse transcriptase (negative control). (B) Dot plots depicting live cell-gated CD8+ or CD4+ (the second panel) or CD8+β2-AR+ (the third panel) or CD4+β2-AR+ (the fourth panel) cell proportions in fresh PBMC. (C,D) Quantification of CD8+ or CD4+ cell proportions (C) before, 3 or 7 days after CD3 and IL-2 stimulation (n=2). Data are mean ± SEM. PBMC, peripheral blood mononuclear cell; SEM, standard error of the mean.
Figure 5
Figure 5
The effect of β2-AR signaling on the proliferation of activated T cells. (A) The dot plots depicting the proliferation of cell-gated CD4+ (A) or CD8+ proportions (C) by CSFE assay (n=2). (B,D) Quantification of proliferation CD4+ (B) or CD8+ (D) proportions by CSFE assay proportions. (E,F) The total proliferative percentage of CD4+ (E) or CD8+ (F) proportions in PBMC after 7-day stimulation with NE (final concentration 10−9 and 10−8 M) and/or timolol maleate (final concentration 2×10⁻⁹ and 2×10⁻⁸ M) in the presence of CD3 and IL-2 in the medium (n=3). Data are expressed as mean ± SEM. , P<0.05. AR, adrenergic receptor; PBMC, peripheral blood mononuclear cell; NE, norepinephrine; SEM, standard error of the mean.
Figure 6
Figure 6
The distribution of CD45+ immune cells and nerve fibers in the tumor site. (A,B,C) Representative IF images labeled with anti-NF-200 (green) and anti-CD45 (red) in the outer perimeter of tumor island (A), the region in close association with the vasculature (B) and the center region of tumor parenchyma (C). (D,E) Representative 3-dimensional IF images labeled with anti-NF-200 (green) and anti-CD45 (red) in the central region of the tumor parenchyma. Scale bars, 20 µm. NF-200, neurofilament 200; IF, immunofluorescent.

References

    1. Jemal A, Bray F, Center MM, et al. Global cancer statistics. CA Cancer J Clin 2011;61:69-90. 10.3322/caac.20107 - DOI - PubMed
    1. Lillberg K, Verkasalo PK, Kaprio J, et al. Stressful life events and risk of breast cancer in 10,808 women: a cohort study. Am J Epidemiol 2003;157:415-23. 10.1093/aje/kwg002 - DOI - PubMed
    1. Reiche EM, Nunes SO, Morimoto HK. Stress, depression, the immune system, and cancer. Lancet Oncol 2004;5:617-25. 10.1016/S1470-2045(04)01597-9 - DOI - PubMed
    1. Cole SW, Nagaraja AS, Lutgendorf SK, et al. Sympathetic nervous system regulation of the tumour microenvi-ronment. Nat Rev Cancer 2015;15:563-72. 10.1038/nrc3978 - DOI - PMC - PubMed
    1. Hanoun M, Maryanovich M, Arnal-Estapé A, et al. Neural regulation of hematopoiesis, inflammation, and cancer. Neuron 2015;86:360-73. 10.1016/j.neuron.2015.01.026 - DOI - PMC - PubMed