. 2022 Jan 18:11:784762.
doi: 10.3389/fcimb.2021.784762. eCollection 2021.

Single-Cell Monitoring of Activated Innate Immune Signaling by a d2eGFP-Based Reporter Mimicking Time-Restricted Activation of IFNB1 Expression

Affiliations

Single-Cell Monitoring of Activated Innate Immune Signaling by a d2eGFP-Based Reporter Mimicking Time-Restricted Activation of IFNB1 Expression

Emil Aagaard Thomsen et al. Front Cell Infect Microbiol. .

Abstract

The innate immune system represents a balanced first line of defense against infection. Type I interferons (IFNs) are key regulators of the response to viral infections with an essential early wave of IFN-β expression, which is conditional, time-restricted, and stochastic in its nature. The possibility to precisely monitor individual cells with active IFNB1 transcription during innate signaling requires a robust reporter system that mimics the endogenous IFN-β signal. Here, we present a reporter system based on expression of a destabilized version of eGFP (d2eGFP) from a stably integrated reporter cassette containing the IFNB1 promoter and 3'-untranslated region, enabling both spatial and temporal detection of regulated IFNB1 expression. Specifically, this reporter permits detection, quantification, and isolation of cells actively producing d2eGFP in a manner that fully mimics IFN-β production allowing tracking of IFNB1 gene activation and repression in monocytic cells and keratinocytes. Using induced d2eGFP expression as a readout for activated immune signaling at the single-cell level, we demonstrate the application of the reporter for FACS-based selection of cells with genotypes supporting cGAS-STING signaling. Our studies provide a novel approach for monitoring on/off-switching of innate immune signaling and form the basis for investigating genotypes affecting immune regulation at the single-cell level.

Keywords: IFNB1 reporter; IFNB1 transcription; flow cytometry; innate immunity; single-cell.


Conflict of interest statement

The authors declare that the research was conducted in the absence of any commercial or financial relationships that could be construed as a potential conflict of interest.

Figures
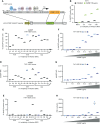
Figure 1
Figure 1
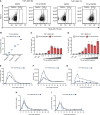
Generation of stable monogenic IFN-β reporter (IBER) clones. (A) Schematic representation of the IFNB1 locus and the genomic regions of this locus incorporated into pCCL/IFNB1-d2eGFP-3’UTR. (B) Initial validation of successful transduction with LV/IFNB1-d2eGFP-3’UTR by treatment with cGAMP (125 µg/mL) for 12 hours d2eGFP-positive cells were measured by flow cytometry. (C) Screening of 14 different THP1-IBER clones with cGAMP (62.5 µg/mL) for 12 hours and subsequent detection of the percentage d2eGFP-positive cells by flow cytometry. (D) Percentage of d2eGFP-positive cells in untreated THP1-IBER clones. (E) Quantification of d2eGFP MFI of each THP1-IBER clone following cGAMP treatment. (F) Percentage d2eGFP-positive cells after treatment of the two THP1-IBER clones B6 and C3 with different dosages of cGAMP (0-125 µg/mL) for 12 hours. (G) d2eGFP MFI of clones B6 and C3 after cGAMP treatment. (H) Medium from the same cells was collected before flow cytometry, and the concentration of IFN-β (units/mL) was quantified by HEK-Blue™ IFN-α/β. Experiments were performed in biological triplicates (individual wells); each panel represents one experiment.
Figure 2
Figure 2
Characterization of the IFNB1 d2eGFP reporter. (A) Treatment of THP1-IBER clone B6 and C3 with lipofectamine (4 µL/mL), dsDNA (4µg/mL), Poly I:C (4µg/mL) or cGAMP (125 µg/mL) and subsequent detection of percentage d2eGFP-positive cells 12 hours after treatment measured by flow cytometry. (B) Medium harvested prior to flow cytometry, and the IFN-β (units/mL) was detected by HEK-Blue™ IFN-α/β. (C) Treatment of PMA differentiated THP1-IBER clones with HSV-1[KOS] at different MOI (1 or 3). (D) Quantification of IFN-β secreted to the media following treatment with HSV-1[KOS]. (E) Treatment of PMA-differentiated naïve THP-1 cells or THP1-IBER clone B6 and C3 with lipofectamine (4 µL/mL), dsDNA (4µg/mL), Poly I:C (4µg/mL) or cGAMP (125 µg/mL). The fraction of d2eGFP positive cells was determined by flow cytometry 12 hours after treatment. (F) In medium harvested prior to flow cytometry, the level of IFN-β (units/mL) was quantified by HEK-Blue™ IFN-α/β. Experiments were performed in biological triplicates (individual wells); each panel represents one experiment.
Figure 3
Figure 3
IFNB1 d2eGFP reporter in HaCaT cells. (A) HaCaT-IBER clones D1 and D3 were treated with lipofectamine (4 µL/mL), dsDNA (4µg/mL), Poly I:C (4µg/mL) or cGAMP (125 µg/mL), and the fraction of d2eGFP positive cells was determined by flow cytometry 12 hours after treatment. (B) Quantification of IFN-β (units/mL) in the medium by HEK-Blue™ IFN-α/β. (C) RNA was extracted from cells and mRNA levels of IFNB1 and ACTB were quantified by qPCR. Experiments were performed in biological triplicates (individual wells); each panel represents one experiment. For qPCR, each biological replicate was analyzed in technical duplicates.
Figure 4
Figure 4
Stochastic behaviour of the IFNB1 d2eGFP reporter and temporal monitoring. (A) Treatment of THP1-IBER clones B6 and C3 with 4 (µg/mL) dsDNA or TX-dsDNA. The fraction Texas-red positive cells was determined by flow cytometry 12 hours after treatment. (B) The fraction of d2eGFP-positive cells from each on the Texas-red signal resulting in gates: Negative, Positive +, and Positive ++. (C) TX-dsDNA dose response with 0 to 6 µg/mL. The fractions of d2eGFP-positive cells and Texas-red positive cells were determined by flow cytometry 12 hours after treatment in THP1-IBER clone B6 and (D) clone C3. (E) THP1-IBER clones B6 and C3 were treated with cGAMP (31.25 µg/mL), and flow cytometry was used to quantify the fraction of d2eGFP-positive cells over time, from 0-56 hours. (F) The magnitude of the response as reflected by the d2eGFP MFI. (G) Medium was used to quantify secreted IFN-β (units/mL) at the different time points by HEK-Blue™ IFN-α/β. (H) RNA was extracted from cell pellets harvested at each time point, and mRNA levels of IFNB1 and ACTB were quantified by qPCR. (I) Quantification of d2eGFP and ACTB mRNA levels by qPCR. 5x10⁵ cells/mL were seeded in 500 µL total in 12-well plates. Experiments were performed in biological triplicates (individual wells); each panel represents one experiment. For qPCR, each biological replicate was analyzed in technical duplicates.
Figure 5
Figure 5
STING-pathway dependency and spatial resolved detection of d2eGFP. (A) Indel frequency determined by sanger sequencing and ICE-analysis following nucleofection with Cas9/sgRNA complexes. (B) Treatment with cGAMP in naïve, mock-nucleofected cells and TMEM173 KO cells followed by detection of d2eGFP-positive cells 12 hours after treatment by THP1-IBER clone B6 and (C) clone C3 by flow cytometry. (D) Histograms of different cGAMP-treated samples before and after FACS. (E) Mixed populations of mock and TMEM173 KO populations in both clones, treated with cGAMP for 12 hours and subjected to FACS. (F) Detection of d2eGFP-signal in different populations from both THP1-IBER clones before and after FACS. (G) Detection of indel frequencies in different populations from both THP1-IBER clones before and after FACS. Experiments (B, C) were performed in biological triplicates (individual wells); each of the panels represents one experiment. FACS was performed on a single sample.

References

    1. Agalioti T., Lomvardas S., Parekh B., Yie J., Maniatis T., Thanos D. (2000). Ordered Recruitment of Chromatin Modifying and General Transcription Factors to the IFN-Beta Promoter. Cell 103, 667–678. doi: 10.1016/S0092-8674(00)00169-0 - DOI - PubMed
    1. Agarwal S., Vierbuchen T., Ghosh S., Chan J., Jiang Z., Kandasamy R. K., et al. . (2020). The Long non-Coding RNA LUCAT1 is a Negative Feedback Regulator of Interferon Responses in Humans. Nat. Commun. 11, 6348. doi: 10.1038/s41467-020-20165-5 - DOI - PMC - PubMed
    1. Andersen L. L., Mork N., Reinert L. S., Kofod-Olsen E., Narita R., Jorgensen S. E., et al. . (2015). Functional IRF3 Deficiency in a Patient With Herpes Simplex Encephalitis. J. Exp. Med. 212, 1371–1379. doi: 10.1084/jem.20142274 - DOI - PMC - PubMed
    1. Bodda C., Reinert L. S., Fruhwurth S., Richardo T., Sun C., Zhang B. C., et al. . (2020). HSV1 VP1-2 Deubiquitinates STING to Block Type I Interferon Expression and Promote Brain Infection. J. Exp. Med. 217 (7). doi: 10.1084/jem.20191422 - DOI - PMC - PubMed
    1. Enoch T., Zinn K., Maniatis T. (1986). Activation of the Human Beta-Interferon Gene Requires an Interferon-Inducible Factor. Mol. Cell Biol. 6, 801–810. doi: 10.1128/mcb.6.3.801-810.1986 - DOI - PMC - PubMed

Publication types

MeSH terms