

Epidemiological Characteristics and Transmissibility for SARS-CoV-2 of Population Level and Cluster Level in a Chinese City
- PMID: 35118044
- PMCID: PMC8805998
- DOI: 10.3389/fpubh.2021.799536
Epidemiological Characteristics and Transmissibility for SARS-CoV-2 of Population Level and Cluster Level in a Chinese City
Abstract
Background: To date, there is a lack of sufficient evidence on the type of clusters in which severe acute respiratory syndrome coronavirus 2 (SARS-CoV-2) is most likely to spread. Notably, the differences between cluster-level and population-level outbreaks in epidemiological characteristics and transmissibility remain unclear. Identifying the characteristics of these two levels, including epidemiology and transmission dynamics, allows us to develop better surveillance and control strategies following the current removal of suppression measures in China.
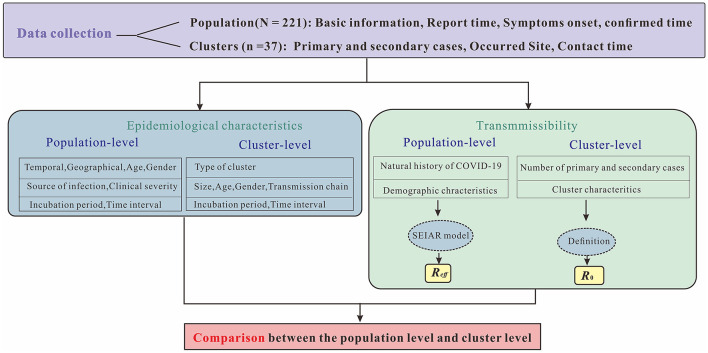
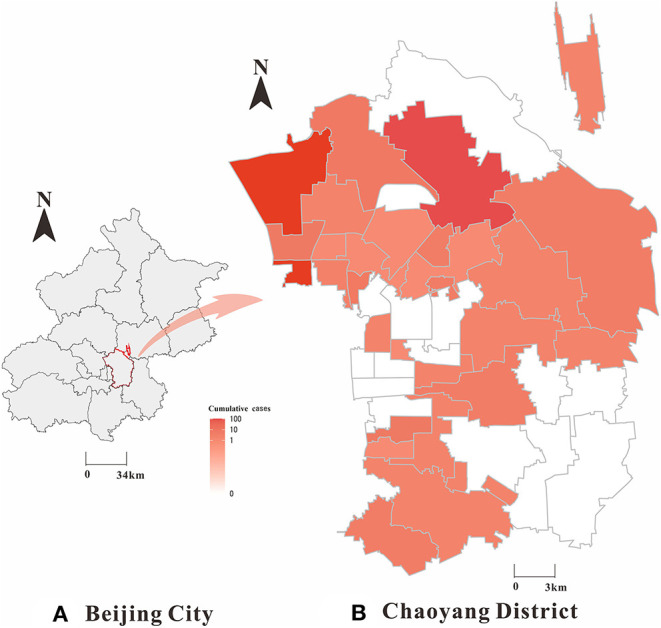
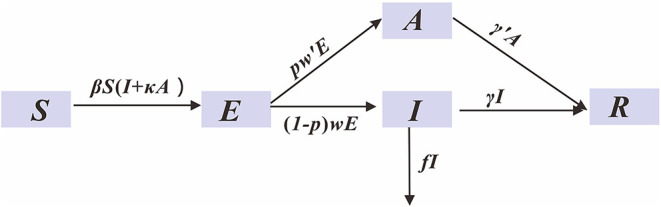
Methods: We described the epidemiological characteristics of SARS-CoV-2 and calculated its transmissibility by taking a Chinese city as an example. We used descriptive analysis to characterize epidemiological features for coronavirus disease 2019 (COVID-19) incidence database from 1 Jan 2020 to 2 March 2020 in Chaoyang District, Beijing City, China. The susceptible-exposed-infected-asymptomatic-recovered (SEIAR) model was fitted with the dataset, and the effective reproduction number (Reff ) was calculated as the transmissibility of a single population. Also, the basic reproduction number (R0) was calculated by definition for three clusters, such as household, factory and community, as the transmissibility of subgroups.
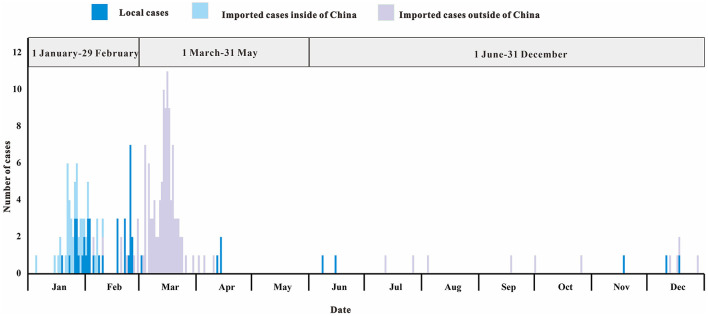
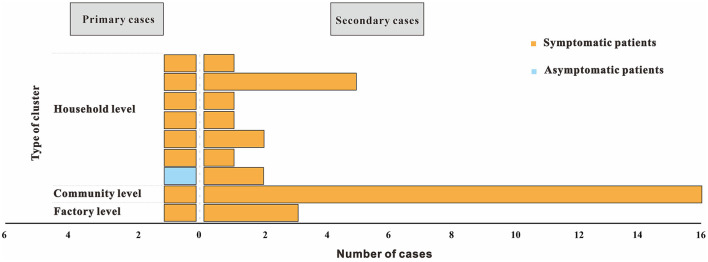
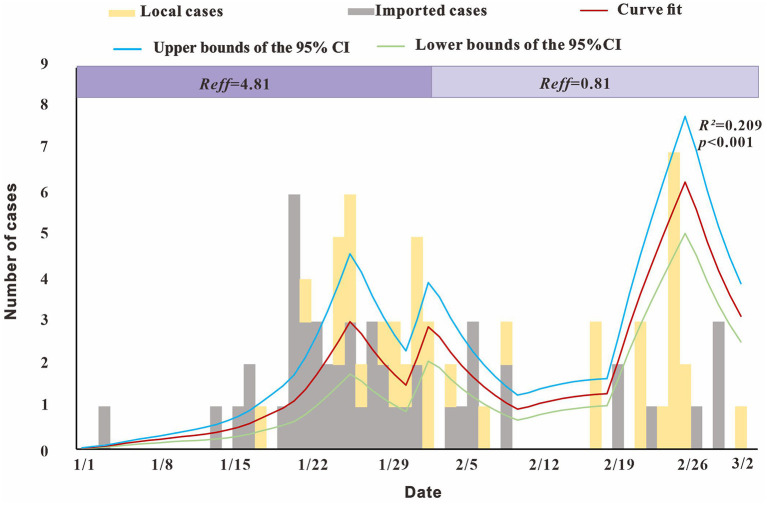
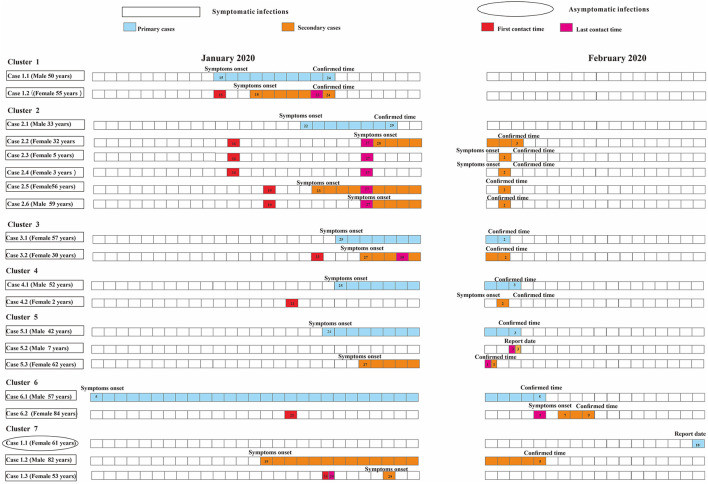
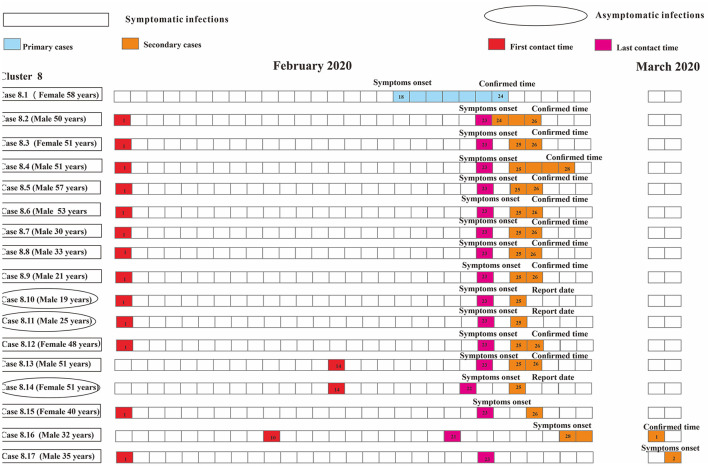
Results: The epidemic curve in Chaoyang District was divided into three stages. We included nine clusters (subgroups), which comprised of seven household-level and one factory-level and one community-level cluster, with sizes ranging from 2 to 17 cases. For the nine clusters, the median incubation period was 17.0 days [Interquartile range (IQR): 8.4-24.0 days (d)], and the average interval between date of onset (report date) and diagnosis date was 1.9 d (IQR: 1.7 to 6.4 d). At the population level, the transmissibility of the virus was high in the early stage of the epidemic (Reff = 4.81). The transmissibility was higher in factory-level clusters (R0 = 16) than in community-level clusters (R0 = 3), and household-level clusters (R0 = 1).
Conclusions: In Chaoyang District, the epidemiological features of SARS-CoV-2 showed multi-stage pattern. Many clusters were reported to occur indoors, mostly from households and factories, and few from the community. The risk of transmission varies by setting, with indoor settings being more severe than outdoor settings. Reported household clusters were the predominant type, but the population size of the different types of clusters limited transmission. The transmissibility of SARS-CoV-2 was different between a single population and its subgroups, with cluster-level transmissibility higher than population-level transmissibility.
Keywords: COVID-19; cluster-level; mathematical model; population-level; transmissibility.
Copyright © 2022 Yu, Cui, Rui, Zhao, Deng, Liu, Li, Wang, Yang, Li, Chen and Wang.
Conflict of interest statement
The authors declare that the research was conducted in the absence of any commercial or financial relationships that could be construed as a potential conflict of interest.
Figures
Similar articles
-
Assessment of transmissibility and measures effectiveness of SARS in 8 regions, China, 2002-2003.Front Cell Infect Microbiol. 2023 Aug 10;13:1212473. doi: 10.3389/fcimb.2023.1212473. eCollection 2023. Front Cell Infect Microbiol. 2023. PMID: 37637464 Free PMC article.
-
Comparison of epidemiological characteristics and transmissibility of different strains of COVID-19 based on the incidence data of all local outbreaks in China as of March 1, 2022.Front Public Health. 2022 Sep 15;10:949594. doi: 10.3389/fpubh.2022.949594. eCollection 2022. Front Public Health. 2022. PMID: 36187650 Free PMC article.
-
The epidemiological characteristics and effectiveness of countermeasures to contain coronavirus disease 2019 in Ningbo City, Zhejiang Province, China.Sci Rep. 2021 May 5;11(1):9545. doi: 10.1038/s41598-021-88473-4. Sci Rep. 2021. PMID: 33953243 Free PMC article.
-
The reproduction rate of severe acute respiratory syndrome coronavirus 2 different variants recently circulated in human: a narrative review.Eur J Med Res. 2023 Feb 24;28(1):94. doi: 10.1186/s40001-023-01047-0. Eur J Med Res. 2023. PMID: 36823532 Free PMC article. Review.
-
COVID-19, SARS and MERS: are they closely related?Clin Microbiol Infect. 2020 Jun;26(6):729-734. doi: 10.1016/j.cmi.2020.03.026. Epub 2020 Mar 28. Clin Microbiol Infect. 2020. PMID: 32234451 Free PMC article. Review.
Cited by
-
Modeling COVID-19 Transmission Dynamics: A Bibliometric Review.Int J Environ Res Public Health. 2022 Oct 29;19(21):14143. doi: 10.3390/ijerph192114143. Int J Environ Res Public Health. 2022. PMID: 36361019 Free PMC article. Review.
-
Assessing changes in incubation period, serial interval, and generation time of SARS-CoV-2 variants of concern: a systematic review and meta-analysis.BMC Med. 2023 Sep 29;21(1):374. doi: 10.1186/s12916-023-03070-8. BMC Med. 2023. PMID: 37775772 Free PMC article.
-
Incubation Period of COVID-19 Caused by Unique SARS-CoV-2 Strains: A Systematic Review and Meta-analysis.JAMA Netw Open. 2022 Aug 1;5(8):e2228008. doi: 10.1001/jamanetworkopen.2022.28008. JAMA Netw Open. 2022. PMID: 35994285 Free PMC article.
References
-
- How COVID-19 Spreads. Centers for Disease Control and Prevention. Available online at: https://www.cdc.gov/coronavirus/2019-ncov/prevent-getting-sick/how-covid.... (accessed July 14, 2021).
-
- Interim Clinical Guidance for Management of Patients with Confirmed Coronavirus Disease (COVID-19) . US Centers for Disease Control and Prevention (CDC) (2020). Available online at: https://www.cdc.gov/coronavirus/2019-ncov/hcp/clinical-guidance-manageme... (accessed April 19, 2020).
Publication types
MeSH terms
LinkOut - more resources
Full Text Sources
Medical
Miscellaneous