. 2022 Jan 5;12(1):e4288.
doi: 10.21769/BioProtoc.4288.

Real-Time Analysis of Mitochondrial Electron Transport Chain Function in Toxoplasma gondii Parasites Using a Seahorse XFe96 Extracellular Flux Analyzer

Affiliations

Real-Time Analysis of Mitochondrial Electron Transport Chain Function in Toxoplasma gondii Parasites Using a Seahorse XFe96 Extracellular Flux Analyzer

Jenni A Hayward et al. Bio Protoc. .

Abstract

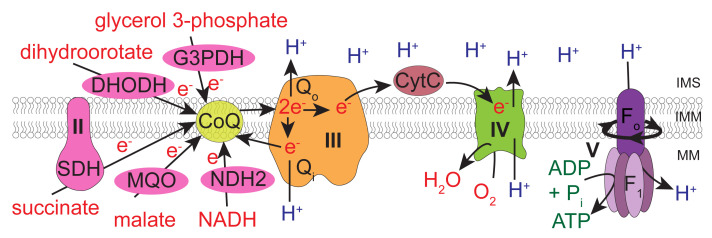
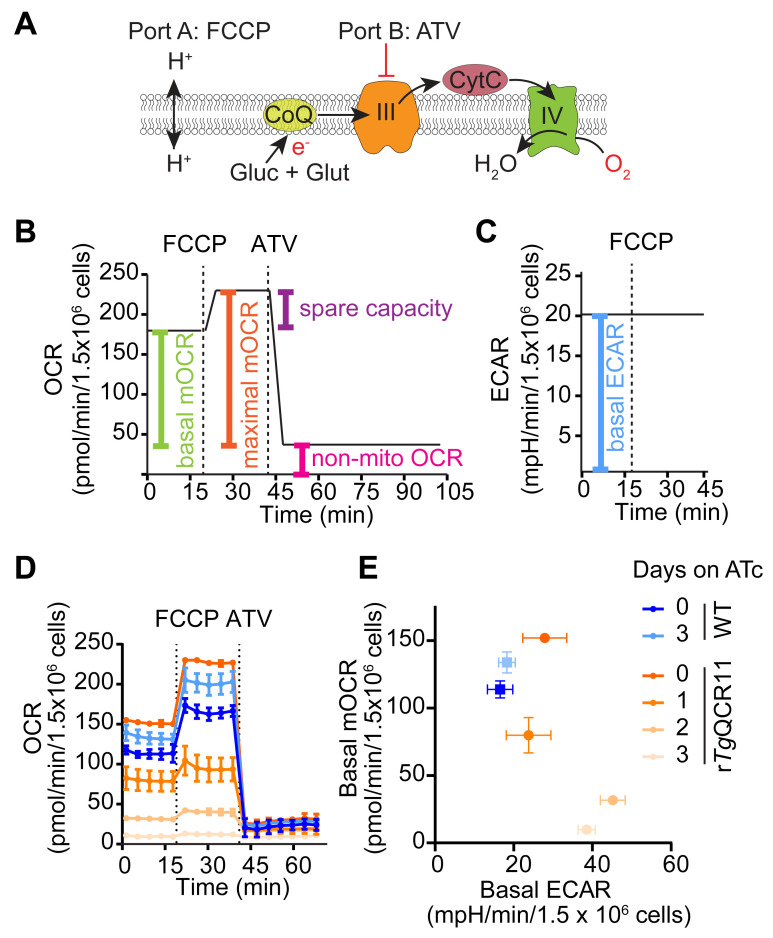
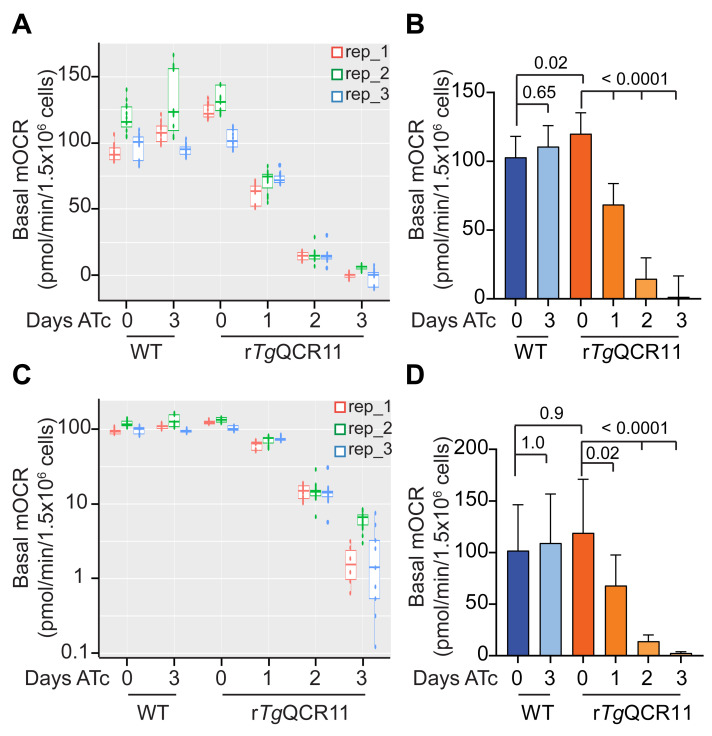
The mitochondrial electron transport chain (ETC) performs several critical biological functions, including maintaining mitochondrial membrane potential, serving as an electron sink for important metabolic pathways, and contributing to the generation of ATP via oxidative phosphorylation. The ETC is important for the survival of many eukaryotic organisms, including intracellular parasites such as the apicomplexan Toxoplasma gondii. The ETC of T. gondii and related parasites differs in several ways from the ETC of the mammalian host cells they infect, and can be targeted by anti-parasitic drugs, including the clinically used compound atovaquone. To characterize the function of novel ETC proteins found in the parasite and to identify new ETC inhibitors, a scalable assay that assesses both ETC function and non-mitochondrial parasite metabolism (e.g., glycolysis) is desirable. Here, we describe methods to measure the oxygen consumption rate (OCR) of intact T. gondii parasites and thereby assess ETC function, while simultaneously measuring the extracellular acidification rate (ECAR) as a measure of general parasite metabolism, using a Seahorse XFe96 extracellular flux analyzer. We also describe a method to pinpoint the location of ETC defects and/or the targets of inhibitors, using permeabilized T. gondii parasites. We have successfully used these methods to investigate the function of T. gondii proteins, including the apicomplexan parasite-specific protein subunit TgQCR11 of the coenzyme Q:cytochrome c oxidoreductase complex (ETC Complex III). We note that these methods are also amenable to screening compound libraries to identify candidate ETC inhibitors.

Keywords: Electron transport chain; Metabolism; Mitochondrion; Seahorse XFe96; Toxoplasma gondii.


Conflict of interest statement

Competing interestsThe authors declare that no competing interests exist.

Figures

Figure 1.
Figure 1.. The mitochondrial electron transport chain of T. gondii parasites.
Dehydrogenases (pink) of the inner mitochondrial membrane (IMM) – namely, glycerol 3-phosphate dehydrogenase (G3PDH), dihydrooratate dehydrogenase (DHODH), succinate dehydrogenase (SDH; Complex II), malate:quinone oxidoreductase (MQO) and type 2 NADH dehydrogenases (NDH2) – donate electrons to coenzyme Q (CoQ; yellow) via oxidation of their substrates. CoQ interacts with ubiquinone:cytochrome c oxidoreductase (Complex III; orange) at the Qo and Qi sites in a process called the Q cycle. These interactions transfer electrons from CoQ to a soluble protein of the intermembrane space (IMS) called cytochrome c (CytC, dark red), as well as translocating protons (H+) from the mitochondrial matrix (MM) into the IMS. CytC donates electrons to cytochrome c oxidase (Complex IV; green), which consumes oxygen as the terminal electron acceptor and also contributes to the proton gradient across the IMM. The proton motive force generated by Complexes III and IV is harnessed by adenosine triphosphate (ATP) synthase (Complex V; purple), which couples the rotation of the F0 domain (caused by movement of protons from the IMS back into the MM) to ATP synthesis at the F1 catalytic domain. Modified from Hayward and van Dooren (2019).
Figure 2.
Figure 2.. Overview of the Seahorse XFe96 assay procedure (modelled after Plitzko and Loesgen, 2018).
Figure 3.
Figure 3.. Parts of the Seahorse XFe96 sensor cartridge. (Top)
In side view, the sensor probes attached to the green sensor cartridge can be seen. The probes contain solid state optical sensors that must be hydrated overnight before use in the assay. (Bottom) In top view, the four injection ports above each of the 96 wells can be seen. The inset depicts the positions of ports A-D and the central sensor probe. Compounds are injected via ports A-D into the well below at user-defined times during the assay.
Figure 4.
Figure 4.. Measurement of OCR and ECAR of intact T. gondii parasites in a MitoStress assay.
A. Schematic of the assay. Intact T. gondii parasites are supplied glucose (Glc) and glutamine (Gln) as energy/electron sources in the Seahorse XF base medium. FCCP is injected via port A to dissipate the proton gradient across the inner mitochondrial membrane and thereby uncouple electron transport from ATP synthesis. Atovaquone (ATV) is injected via port B to inhibit ETC Complex III. B. Mock traces highlighting the typical OCR response to FCCP and ATV injection, and the calculations that can be performed on the resulting data: namely, the non-mitochondrial OCR (pink) is obtained by averaging the OCR measurements after injection of atovaquone (ATV). The non-mitochondrial OCR can then be subtracted from the measurements before injection of FCCP to calculate the basal mitochondrial OCR (basal mOCR, green). The non-mitochondrial OCR can also be subtracted from the measurements after injection of FCCP to calculate the maximal mOCR (orange). Finally, the spare capacity is the difference between the maximal and basal mOCR (purple). C. ECAR measurements before injection of FCCP represent the basal ECAR. D. Real traces depicting the OCR of WT (blue) and rTgQCR11 (orange) parasites that were cultured in the absence of ATc or in the presence of ATc for 1-3 days prior to the assay. Data represent the mean ± SD of three technical replicates and are representative of three independent experiments (derived from Hayward et al., 2021 ). E. Basal mOCR versus basal ECAR of WT (blue) and rTgQCR11 (orange) parasites that were cultured as described in (D). Data represent the mean ± SD of three technical replicates from a single experiment. Data were exported from the Wave software into GraphPad Prism to generate the graphs. Colors match the legend in (D).
Figure 5.
Figure 5.. Designing a Seahorse XFe96 experimental template for an intact MitoStress assay in the Wave software.
A. Under ‘Group Definitions’ tab, fill in the injection strategies as follows: Port A: FCCP; Port B: Atovaquone; Port C: Base medium with glucose and glutamine (BM+Glc+Gln); Port D: BM+Glc+Gln. Add ‘groups’, and ensure to name them using the conventions x day (where x is the number of days parasites were grown on ATc), the name of the parasite line being used (e.g., WT, rTgQCR11), and intact (indicates the assay is being performed on intact parasites, rather than on permeabilized parasites as described in Procedure Section C). B. Under the ‘Plate Map’ tab, configure the plate map ensuring appropriate background wells (wells without cells, blanks) are included. C. Under the ‘Protocol’ tab, specify which ports are to be injected by adding injections after the baseline reading. Specify the timing and number of mixing and measuring cycles as follows: 3 cycles (in the test data set provided we did 5 cycles); 30 s mixing; 0 s waiting; 3 min measuring. Save the template. When opened at the Seahorse XFe96 machine, open the ‘Run Assay’ tab at the top to start the assay.
Figure 6.
Figure 6.. Measurement of substrate-elicited OCR in permeabilized parasites ( Hayward et al., 2021 ).
A. Schematic of the assay. T. gondii parasites are starved for 1 hour in base media to deplete endogenous energy sources, then permeabilized with 0.002% (w/v) digitonin before being subjected to the following injections of substrates or inhibitors: Port A, FCCP plus the substrates malate (Mal) or glycerol 3-phosphate (G3P); Port B, the ETC Complex III inhibitor atovaquone (ATV); Port C, the cytochrome c (CytC) substrate TMPD (TMPD); Port D, the ETC Complex IV inhibitor sodium azide (NaN3). B. Mock trace highlighting the typical OCR response of WT parasites, and the calculations that can be performed on the resulting data: namely, the non-mitochondrial OCR (pink) is obtained by averaging the OCR measurements after injection of atovaquone (ATV) via port B. The non-mitochondrial OCR can then be subtracted from the measurements after the injection of Mal or G3P via port A to calculate the substrate-elicited mitochondrial OCR (mOCRSubstrate, green). The non-mitochondrial OCR can also be subtracted from the measurements after injection of TMPD via port C to calculate the TMPD-elicited mOCR (mOCRTMPD, orange). Finally, as a measure for how effectively TMPD stimulates OCR relative to the substrate, the ratio of mOCRTMPD/mOCRSubstrate can also be calculated. C. Real traces depicting the OCR of WT (blue), rTgQCR11 (orange), and rTgApiCox25 parasites (green) that were cultured in the absence of ATc for 3 days, or in the presence of ATc for 1-3 days prior to the assay, and were supplied Mal as a substrate via port A. Data represent the mean ± SD of three technical replicates and are representative of three independent experiments. D. Real traces depicting the OCR of WT (blue) and rTgQCR11 (orange) that were cultured as described in (C), but supplied G3P as a substrate via port A. Data represent the mean ± SD of three technical replicates and are representative of three independent experiments. Data were exported from the Wave software into GraphPad Prism to generate the graphs. Data were described previously in Hayward et al. (2021) .
Figure 7.
Figure 7.. Example of analyzed basal mOCR and basal ECAR of intact T. gondii parasites in a MitoStress assay ( Hayward et al., 2021 ).
A-B. Column graphs depicting the (A) basal mOCR and (B) basal ECAR of WT (blue) and rTgQCR11 (orange) T. gondii parasites grown in the absence of ATc or in the presence of ATc for 1-3 days. A linear mixed effects model was fitted to the data and values depict the estimated marginal means ± 95% CI of three independent experiments. Tukey’s multiple pairwise comparison’s test was performed, with adjusted p-values shown. (C) Basal mOCR versus basal ECAR of WT (blue) and rTgQCR11 (orange) T. gondii parasites grown as described above. Data depict the estimated marginal mean mOCR and ECAR values ± 95% CI of three independent experiments fitted with a linear mixed effects model. Data are from Hayward et al. (2021) .
Figure 8.
Figure 8.. Example of analyzed mOCR of permeabilized parasites supplied various substrates ( Hayward et al., 2021 ).
A-D. Column graphs depicting the (A) malate dependent mOCR (mOCRMal), (B) TMPD dependent mOCR (mOCRTMPD), (C) fold stimulation of mOCR by TMPD relative to malate (mOCRTMPD/Mal), and (D) glycerol 3-phosphate dependent mOCR (mOCRG3P), of WT (blue), rTgQCR11 (orange), and rTgApiCox25 (green) T. gondii parasites grown in the absence of ATc or in the presence of ATc for 1-3 days. A linear mixed effects model was fitted to the data and values depict the estimated marginal means ± 95% CI from three independent experiments. Tukey’s multiple pairwise comparison’s test was performed, with adjusted p-values shown. The data in this figure were derived from a previous study ( Hayward et al., 2021 ).
Figure 9.
Figure 9.. Comparison of two analysis strategies for basal mOCR data.
A, C. Boxplots depicting the basal mitochondrial oxygen consumption rate (mOCR) of WT or rTgQCR11 T. gondii parasites grown in the absence or presence of ATc for 1-3 days, presented on a (A) linear or (C) log scale. Each of the three independent biological replicates are depicted (replicate 1 in red, replicate 2 in green, and replicate 3 in blue), with technical replicates (both different wells and different time point measurements) shown as dots. B, D. Column graphs depicting the basal mOCR of WT (blue) and rTgQCR11 (orange) T. gondii parasites grown in the absence or presence of ATc for 1-3 days. A linear mixed effects model was fitted to the (B) linear or (D) log transformed basal mOCR data. Values depict the estimated marginal means ± 95% CI of three independent experiments. Tukey’s multiple comparisons test was performed, with adjusted p-values shown. (B) is the same as Figure 7A , derived from Hayward et al. (2021) , and is shown here for easy comparison to (D).

References

    1. Alday P. H. and Doggett J. S.(2017). Drugs in development for toxoplasmosis: advances, challenges, and current status. Drug Des Devel Ther 11: 273-293. - PMC - PubMed
    1. Aw Y. T. V., Seidi A., Hayward J. A., Lee J., Makota F. V., Rug M. and van Dooren G. G.(2021). A key cytosolic iron-sulfur cluster synthesis protein localizes to the mitochondrion of Toxoplasma gondii . Mol Microbiol 115(5): 968-985. - PubMed
    1. Brooks C. F., Johnsen H., van Dooren G. G., Muthalagi M., Lin S. S., Bohne W., Fischer K. and Striepen B.(2010). The toxoplasma apicoplast phosphate translocator links cytosolic and apicoplast metabolism and is essential for parasite survival. Cell Host Microbe 7(1): 62-73. - PMC - PubMed
    1. Clark L. C. Jr. Wolf R., Granger D. and Taylor Z.(1953). Continuous recording of blood oxygen tensions by polarography. J Appl Physiol 6(3): 189-193. - PubMed
    1. Divakaruni A. S., Paradyse A., Ferrick D. A., Murphy A. N. and Jastroch M.(2014). Analysis and interpretation of microplate-based oxygen consumption and pH data. Methods Enzymol 547: 309-354. - PubMed

LinkOut - more resources