. 2021 Dec 28;25(2):103678.
doi: 10.1016/j.isci.2021.103678. eCollection 2022 Feb 18.

Multiple timescales in bacterial growth homeostasis

Affiliations

Multiple timescales in bacterial growth homeostasis

Alejandro Stawsky et al. iScience. .

Abstract

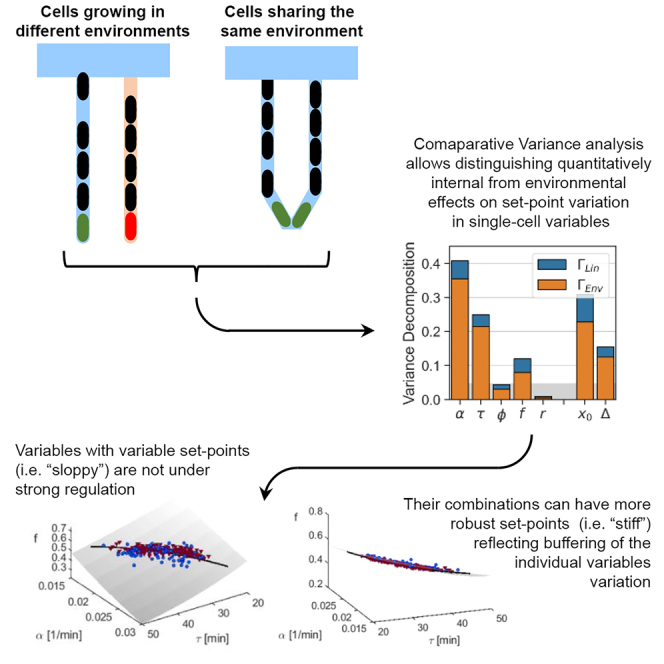
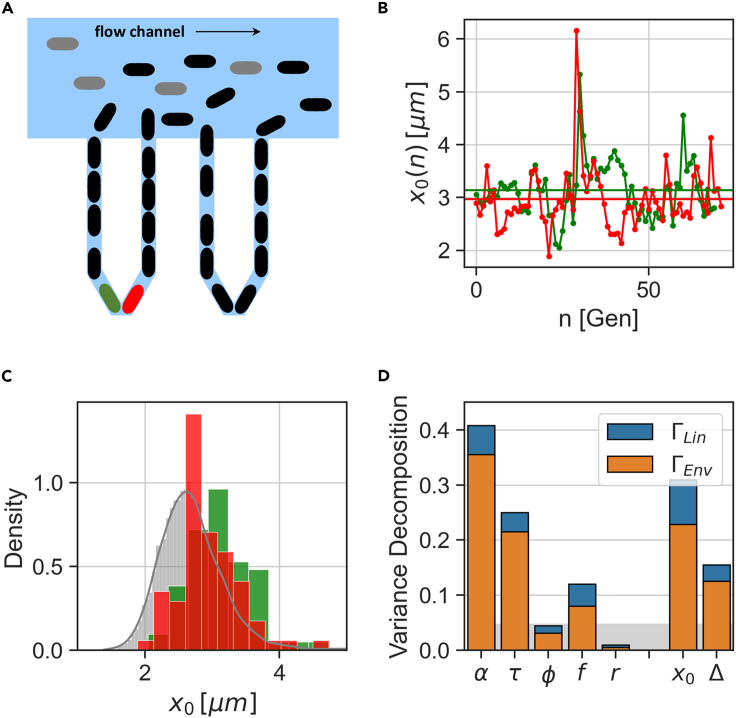
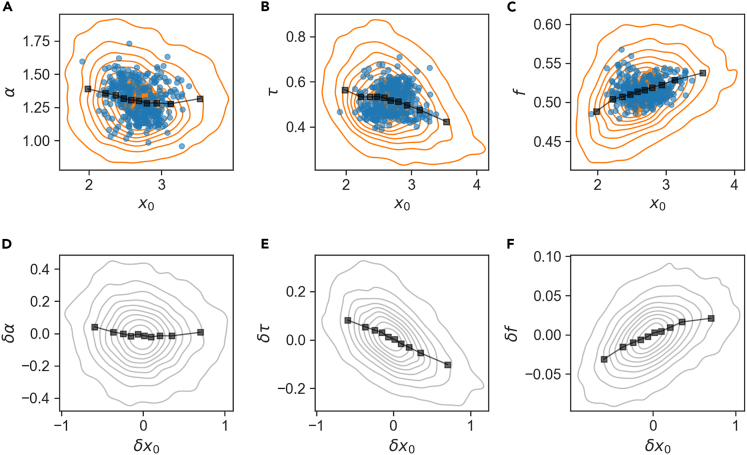
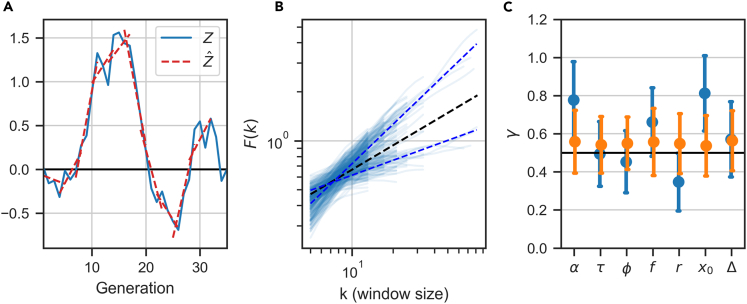
In balanced exponential growth, bacteria maintain many properties statistically stable for a long time: cell size, cell cycle time, and more. As these are strongly coupled variables, it is not a-priori obvious which are directly regulated and which are stabilized through interactions. Here, we address this problem by separating timescales in bacterial single-cell dynamics. Disentangling homeostatic set points from fluctuations around them reveals that some variables, such as growth-rate, cell size and cycle time, are "sloppy" with highly volatile set points. Quantifying the relative contribution of environmental and internal sources, we find that sloppiness is primarily driven by the environment. Other variables such as fold-change define "stiff" combinations of coupled variables with robust set points. These results are manifested geometrically as a control manifold in the space of variables: set points span a wide range of values within the manifold, whereas out-of-manifold deviations are constrained. Our work offers a generalizable data-driven approach for identifying control variables in a multidimensional system.

Keywords: Microbiology; Systems biology.


Conflict of interest statement

The authors declare no competing interests.

Figures

None
Graphical abstract
Figure 1
Figure 1
Short-term and long-term variability in single cell data (A) E. coli cells are trapped in the channels of a mother machine, and can be followed for many growth and division cycles, while medium flows through the device. (B) Images from the microfluidic device are analyzed to provide time traces of cell length in the trap vs time. Smooth accumulation and sharp divisions are clearly seen. (C) Initial size x0(n) from each cycle n vs. generation number, marked on the trace in (B). Data from two separate traps are shown in red and green. Lineages remain distinct over dozens of generations. (D) Collecting the initial sizes x0 from all generations in each of the traces in (C), gives a distribution (corresponding color). Collecting data from all traps in the same experiment, the gray distribution represents the pooled ensemble.
Figure 2
Figure 2
Quantifying the contribution of set point variability to total variance (illustration) In each panel, the pooled ensemble has zero mean and unit variance, holding fixed the sum of the two contributions to variance. However, the segregation of time traces illustrates an increasing contribution of set-point variance, corresponding to an increase in the value of Γtrap from left to right
Figure 3
Figure 3
Sloppy and stiff variables in trapped bacteria (A) Illustration of the main phenotypic variables in a cell cycle. Presented for one cycle are the initial size x0, final size at division xτ, exponential growth-rate α, interdivision time τ, and division ratio f=x0(n)xτ(n1), relating the current cycle n to the previous one n - 1. The log-fold growth is ϕ = ατ, added length Δ = xτ - x0, and size ratio r=feϕ. (B) Variance decomposition conditioned on trap: Γtrap for all variables, estimated from a set of mother machine experiments performed under identical conditions. Vertical bar heights are the fraction of variance contributed from different set points among traps, whereas the remaining fraction complementing to 1 represents the contribution of temporal fluctuations. The gray horizontal bar is the noise level (finite size sampling effect) estimated by running the same analysis on artificial lineages drawn at random from the pooled ensemble (see STAR Methods, Quantification and Statistical Analysis).
Figure 4
Figure 4
Sisters machine data separates internal from environmental contributions to variance (A) Two neighboring lineages of E. coli cells grow at the V-shaped bottom of the sisters machine trap, such that they share the same environment but have different lineage histories. (B) Initial cell size vs generation number for two neighbor cells growing in the same trap (marked red and green in (A)). (C) Collecting data along the green and red traces results in corresponding initial cell size distribution; pooling all data from the experiment results in the gray pooled ensemble distribution. (D) Variance decomposition conditioned on trap microenvironment (orange) and on lineage identity (blue), computed from a set of sisters machine experiments. The remaining fraction complementing to 1 represents the contribution of temporal fluctuations. The gray vertical bar is the noise level (finite size sampling effect) estimated by running the same analysis on artificial lineages drawn at random from the pooled ensemble (see STAR Methods).
Figure 5
Figure 5
Covariation of sloppy homeostatic set points (A and B) Sloppy variables α, τ display a range of homeostatic set points (time averages). Scatter plots for two neighboring lineages in the same microfluidic trap: (A) Exponential growth-rate α, Pearson ρ=0.74; (B) generation time τ, ρ=0.8. The set points are primarily sensitive to the environment (diagonal spread), and less so to lineage history (off-diagonal spread). Black lines are standard deviations in the two directions. (C) Within each lineage, set points strongly covary (blue circles; ρ=0.9) and lie close to the line α¯τ¯=ln2 (dashed black). Orange circles show averages of per-cycle variables over arbitrary groups of the same sizes as lineages (artificial lineages; ρ=0.42). (D) Scatter plot of fold-growth set points ϕ for neighbor cells, Pearson ρ=0.43. (E) Scatter plot of division fraction set points f¯ for neighbor cells, Pearson ρ=0.33. (F) Same presentation as in C, for the variables f¯ and eϕ¯. The dashed black line is f¯eϕ¯=1; ρ=0.84 for temporal averages, ρ=0.38 for artificial averages. For a full matrix of set point scatter plots for pairs of variables between neighbor lineages, see Figure S7
Figure 6
Figure 6
Homeostasis attractor manifold, two views. Homeostatic set points (temporal averages) of lineages from mother machine experiments (blue circles) and from sisters machine experiments (violet triangles), both grown in LB medium at 32. (A) Side view, emphasizing the small variability in the direction perpendicular to the manifold. (B) Front view emphasizing the spread within the manifold, in the vicinity of ατ = 1n2 (black line). In both panels, gray manifold represents r (α, τ, f) = feατ = 1
Figure 7
Figure 7
Cell size correlations over long and short timescales (A–C)Correlations between initial size and (A) size at division, (B) added size, and (C) fold growth. The orange contours represent percentiles 20 to 80 of the pooled ensemble per-cycle data, black squares are the same data after binning. Blue and orange dots are the averages of real and artificial lineages, respectively. Black dashed lines represent expected relations from general considerations of long-term homeostasis: xτ = 2x0 (A), Δ = x0 (B), eφ = xτ/x0 = 2. The Pearson correlation coefficients for the pooled ensemble, artificial and lineage set points respectively are: 0.61, 0.64, and 0.95 for (A), 0.1, 0.17, and 0.82 for (B) and - 0.43, -.0.35, and - 0.11 for (C).
Figure 8
Figure 8
Correlations between cell size and growth/division variables Top: contour plots of correlation between pooled per-cycle variables in physical units (orange contours; ρ=0.12,0.3,0.37 for A, B, C, respectively), their binned values (black square) and time averages (blue circles; ρ=0.19,0.1,0.11). Bottom: Correlations between fast temporal fluctuations, where lineage set points (long term averages) have been subtracted, sharpen the top row correlations (ρ=.05, - .49, 0.44 for D, E, F.). Gray contours: pooled data for relative variables, black squares: binned data
Figure 9
Figure 9
Persistence of phenotypic variables (A) An illustration of the normalized cumulative sum (blue solid line) and its linear approximation for windows of size k = 5 (red dotted line). F (k) will estimate the standard deviation around the linear fits as a function of window size (see STAR Methods). (B) Standard deviation of the fluctuations F (k) as a function of window size k for each lineage separately (light blue lines) and averaged over all lineages (dotted blue lines), showing an approximate power law scaling F(k)kγ. Top line: x0, with power γ = 0.81; bottom line: r, with γ = 0.3. The black dotted line illustrates F(k)k0.5, expected for temporally independent fluctuations. (C) Mean and standard deviation of the scaling exponents for each variable in individual lineages from all mother and sisters machine data (blue symbols). Orange symbols show the same analysis for lineages with shuffled generation order. See Figure S9 for the same analysis on publicly available datasets

References

    1. Amir A. Cell size regulation in bacteria. Phys. Rev. Lett. 2014;112:208102.
    1. Bowsher C.G., Peter S S. Identifying sources of variation and the flow of information in biochemical networks. Proc. Natl. Acad. Sci. U. S. A. 2012;109:E1320–E1328. - PMC - PubMed
    1. Braun E. Academic Press; 2020. Cell-state organization by exploratory sloppy dynamics. Phenotypic Switching; pp. 305–334.
    1. Brenner N., Braun E., Yoney A., Susman L., Rotella J., Salman H. Single-cell protein dynamics reproduce universal fluctuations in cell populations. Eur. Phys. J. E. 2015;38:102. - PubMed
    1. Brenner N., Newman C.M., Osmanović D., Rabin Y., Salman H., Stein D.L. Universal protein distributions in a model of cell growth and division. Phys. Rev. E. Stat. Nonlin. Soft Matter Phys. 2015;92:042713. - PubMed

LinkOut - more resources