. 2022 Jan 10;25(2):103746.
doi: 10.1016/j.isci.2022.103746. eCollection 2022 Feb 18.

Antibody variable sequences have a pronounced effect on cellular transport and plasma half-life

Affiliations

Antibody variable sequences have a pronounced effect on cellular transport and plasma half-life

Algirdas Grevys et al. iScience. .

Abstract

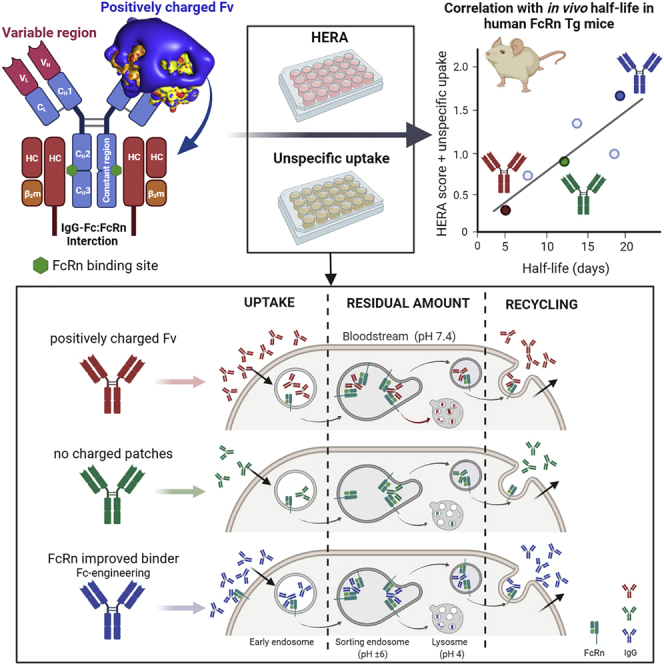
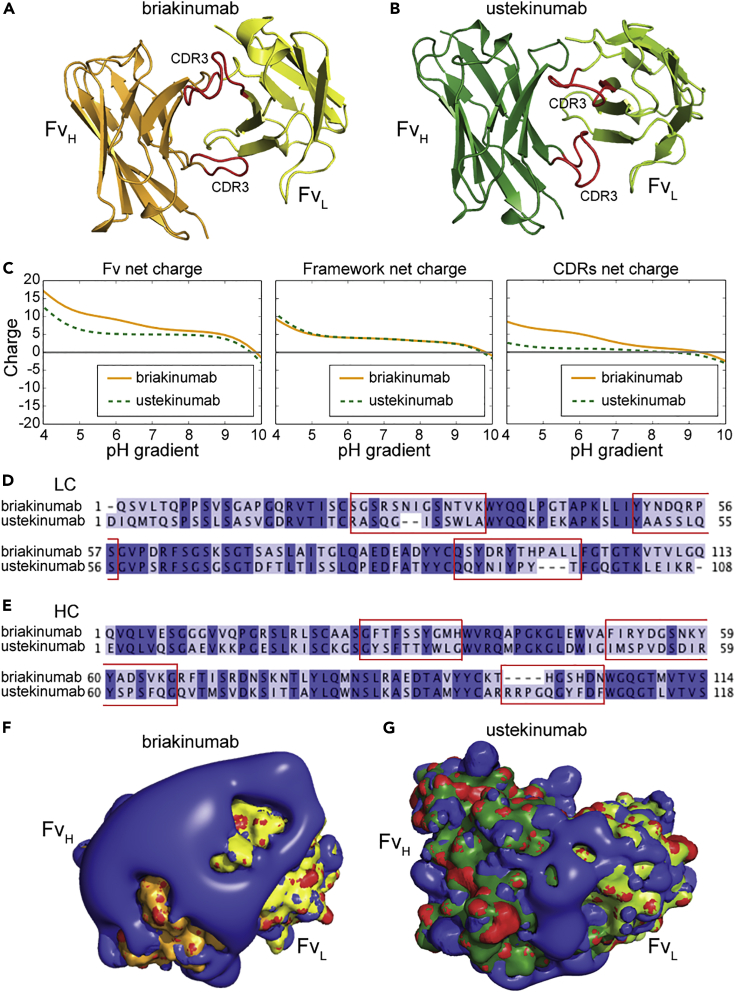
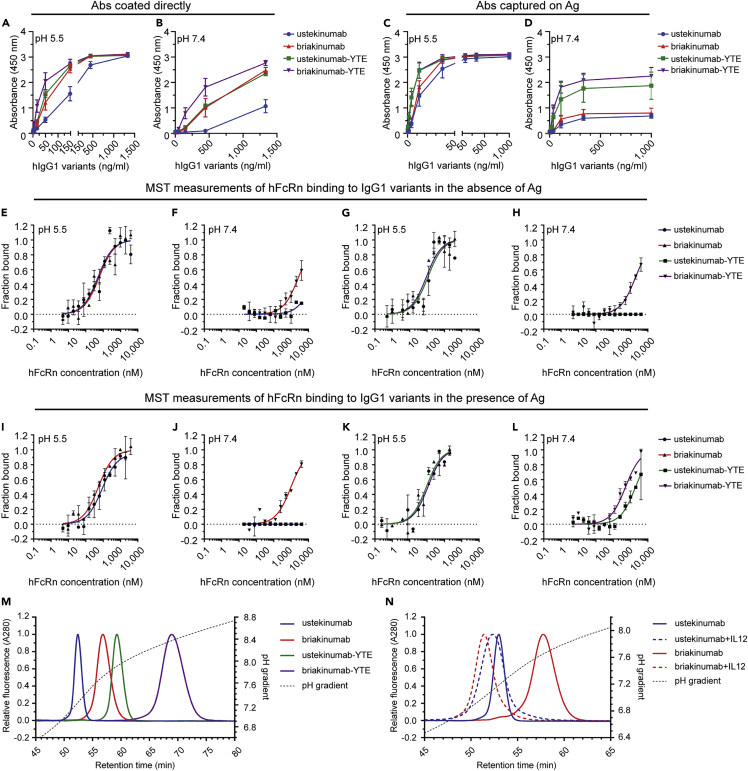
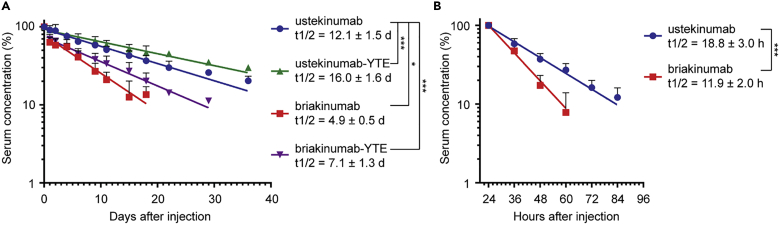
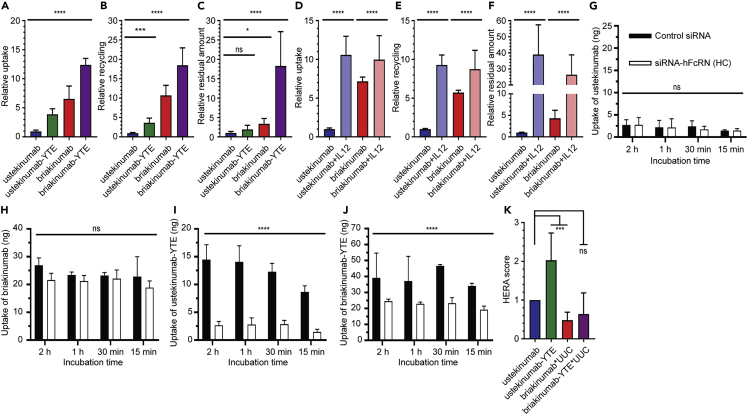
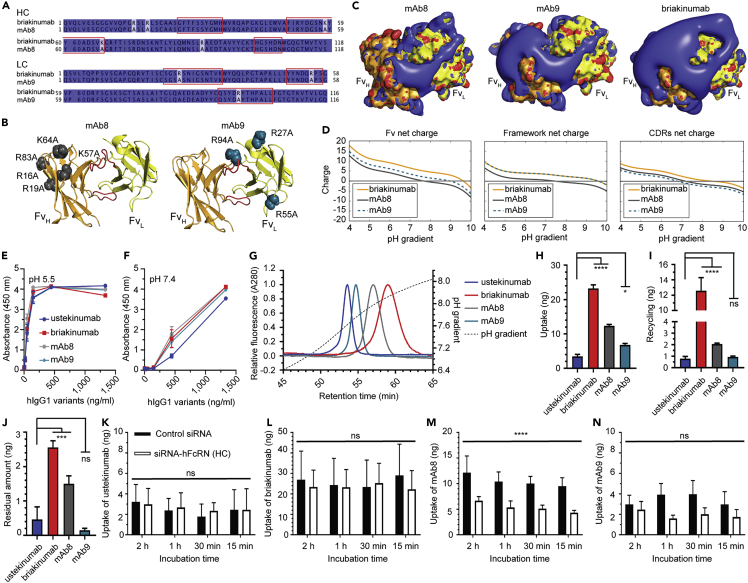
Monoclonal IgG antibodies are the fastest growing class of biologics, but large differences exist in their plasma half-life in humans. Thus, to design IgG antibodies with favorable pharmacokinetics, it is crucial to identify the determinants of such differences. Here, we demonstrate that the variable region sequences of IgG antibodies greatly affect cellular uptake and subsequent recycling and rescue from intracellular degradation by endothelial cells. When the variable sequences are masked by the cognate antigen, it influences both their transport behavior and binding to the neonatal Fc receptor (FcRn), a key regulator of IgG plasma half-life. Furthermore, we show how charge patch differences in the variable domains modulate both binding and transport properties and that a short plasma half-life, due to unfavorable charge patches, may partly be overcome by Fc-engineering for improved FcRn binding.

Keywords: Biological sciences; Biophysics; Immunology.


Conflict of interest statement

T.S., T.E., F.A.A.J., and A.G. are under paid employment by the company F. Hoffmann-La Roche. Other authors declare no conflict of interest.

Figures

None
Graphical abstract
Figure 1
Figure 1
Charge distribution of the Fv domains of ustekinumab and briakinumab (A and B) (A) Crystal structures of top orientated briakinumab and (B) ustekinumab variable domains. CDR loop three of LC and HC are highlighted in red color. The HC of ustekinumab and briakinumab are shown in green and orange, and the LC of ustekinumab and briakinumab are colored in light green and yellow, respectively. (C–G) (C) Sequence-based calculation of net charge through pH range of ustekinumab and briakinumab variable domains, framework (without CDRs) and CDRs, respectively. CDRs were defined as indicated in the material and methods. Sequence alignments of ustekinumab and briakinumab (D) LC and (E) HC, conserved residues are marked with dark blue, distinct residues with light blue, dash indicate missing amino acid residues, and CDR sequences are highlighted by red square. Sequence alignments have been made by Jalview. The charge distribution of top oriented (F) briakinumab and (G) ustekinumab Fv domains at pH 7.4. Blue color indicates positive charge, red negative charge, the HC of ustekinumab and briakinumab are shown in green and orange, and the LC of ustekinumab and briakinumab are colored in light green and yellow, respectively. The figures were visualized using PyMOL (www.pymol.org) with the crystallography data of human IgG1 (Luo et al., 2010; Bloch et al., 2017) (PDB ID codes 3HMW [ustekinumab] and 5N2K [briakinumab]), and net charges were calculated with Emboss iep (www.bioinformatics.nl).
Figure 2
Figure 2
Influence of IL-12 on IgG binding to hFcRn (A–N) ELISA binding of titrated amounts (1400.0–0.07 ng/mL) of WT IgG1 and Fc-engineered variants to hFcRn at pH (A) 5.5 and (B) 7.4, when the antibodies were directly coated to ELISA wells. ELISA binding of titrated amounts (1000.0–0.02 ng/mL) of WT IgG1 and Fc-engineered variants to hFcRn at pH (C) 5.5 and (D) 7.4, when the antibodies were captured on IL-12 coated in wells. Data are mean ± SD of three independent experiments performed in duplicates. Microscale Thermophoresis analysis where constant amount (20 nM) of ustekinumab and briakinumab at pH (E) 5.5 or (F) 7.4, ustekinumab-YTE and briakinumab-YTE at pH (G) 5.5 or (H) 7.4, ustekinumab and briakinumab were preincubated with IL-12 at pH (I) 5.5 or (J) 7.4, and further ustekinumab-YTE and briakinumab-YTE were preincubated with IL12 at pH (K) 5.5 or (L) 7.4 and added to titrated (40,000.0–0.3 nM) amounts of hFnRn. Binding data are derived from the specific change in the thermophoresis mobility and the ratio of normalized time averaged (1s) fluorescence intensities at T-jump points of the Microscale Thermophoresis traces (−1 and 1.5s). To form IgG-IL-12 complexes, the IgGs variants were mixed with IL-12 at ratio 1 to 2, and incubated for 10 min at room temperature. The results are mean ± SD from two independent experiments performed in triplicates. Analytical hFcRn affinity chromatography of (M) ustekinumab, briakinumab, and YTE variants, and (N) ustekinumab and briakinumab as monomeric fractions as well as in a complex with the IL-12. The elution profiles are shown as relative fluorescence intensity as a function of the pH gradient. Fluorescence intensity was normalized and set to one for the clarity. Data are shown as one representative experiment out of three independent experiments.
Figure 3
Figure 3
Half-life of ustekinumab and briakinumab variants in FcRn KO and hFcRn transgenic mice (A and B) Log-linear changes in the serum concentration of hIgG1 ustekinumab (blue), briakinumab (red), ustekinumab-YTE (green), and briakinumab-YTE (purple) in (A) hFcRn transgenic mice (n = 5, per group) and (B) FcRn KO mice (n = 6, per group). The antibodies were administrated as a single i.v. injection at 2 mg/kg (hFcRn transgenic mice) or i.p. injection at 4 mg/kg (FcRn deficient mice), followed by collection of serum samples and determination of IgG concentrations by ELISA. The results are shown as mean ± SD from one representative experiment. (A) ∗p = 0.0491 and ∗∗∗p < 0.0001 by Mixed effect model (Dunnett multiple comparison test), and (B) ∗∗∗p = 0.0009 by unpaired t test. The results were derived from a single experiment with five or six mice per group.
Figure 4
Figure 4
Cellular transport properties of ustekinumab and briakinumab (A) Relative uptake of WT and Fc-engineered human IgG1 variants when 400 nM of each variant was added to the cells followed by 4 h incubation, washing, and lysis of the cells. (B) Relative recycling of the Fc-engineered human IgG1 variants when 400 nM of each variant was added to the cells and incubated for 4 h followed by extensive washing and additional 4 h incubation before sample collection. (C) Relative residual amount of WT and Fc-engineered human IgG1 variants. The same procedure as in (B) followed by lysis of the cells. (D–F) Relative (D) uptake, (E) recycling, and (F) residual amount of ustekinumab and briakinumab in the absence or presence of IL-12. The amounts of IgG variants in all samples were quantified by ELISA, and obtained data are shown as mean ± SD of (A–C) five or (D–F) three independent experiments performed in (A–C) triplicates or (D–F) duplicates. ns, not significant, ∗p < 0.05, ∗∗p < 0.01, ∗∗∗p < 0.001, and ∗∗∗∗p < 0.0001, by one-way ANOVA (Dunnett’s multiple comparison test for A–C and for D–F Sidak’s multiple comparisons test). (A–F) Values for ustekinumab were set to 1, and the other antibody variants relative to this. (G–J) Uptake of (G) ustekinumab, (H) briakinumab, (I) ustekinumab-YTE, and (J) briakinumab-YTE at pH 7.4 when 400 nM of each was added to HMEC1-hFcRn cells treated with a mixture of control siRNA or siRNA targeting the hFcRn HC followed by incubation for 15 min, 30 min, 1 h, and 2 h. After extensive washing, the cells were lysed and added to ELISA for quantification of the amounts of antibody variants. Obtained data are presented as mean ± SD from one representative experiment performed in duplicates out of five independent experiments. ns, not significant and ∗∗∗∗p < 0.0001, by two-way ANOVA (Sidak’s multiple comparisons test). (K) HERA score for the ustekinumab and briakinumab and the respective YTE variants were calculated from the data shown in A, C, H, and J. ns, not significant and ∗∗∗p < 0.001, by one-way ANOVA (Dunnett’s multiple comparison test).
Figure 5
Figure 5
Fv-engineering of briakinumab modulates binding to FcRn and cellular uptake (A) Sequence alignments of HC and LC of briakinumab, mAb8, and mAb9. Conserved and nonconserved amino acid residues are marked in dark and light blue, respectively, whereas CDR sequences are highlighted by red squares. (B) Crystal structure of top orientated briakinumab Fv showing the substitutions within mAb8 and mAb9, respectively. CDR loop three of LC and HC are highlighted in red. The HC of briakinumab is shown in orange, and the LC is colored in yellow. (C) The charge distribution of top oriented briakinumab, mAb8, and mAb9 Fv at pH 7.4. The blue and red colors indicate positive and negative charges. The coloring of the HC and LC of Fvs is kept the same as in (B). (D) Sequence-based calculation of net charge through pH range of briakinumab, mAb8, and mAb9 Fv, frameworks (without CDRs) and CDRs, respectively. Sequence alignments have been made by Jalview. The figures were designed using PyMOL (www.pymol.org) with the crystallography data (PDB ID code 5N2K [briakinumab]) of human IgG1 (Bloch et al., 2017), and Emboss iep was used for net charge calculation (www.bioinformatics.nl). (E and F) ELISA binding of titrated amounts (1400.0–0.07 ng/mL) of ustekinumab, briakinumab, mAb8, and mAb9 to hFcRn at pH (E) 5.5 and (F) 7.4. Data are mean ± SD of three independent experiments performed in duplicates. (G) Analytical hFcRn affinity chromatography of ustekinumab, briakinumab, mAb8, and mAb9 as monomeric fractions. The elution profiles are shown as relative fluorescence intensity and as a function of pH gradient. Fluorescence intensity was normalized and set to one for the clarity. Data are shown as one representative experiment out of three independent experiments. (H) Uptake of ustekinumab, briakinumab, mAb8, and mAb9 when 400 nM of each variant was added to the cells followed by 4 h incubation, washing, and lysis of the cells. (I) Recycling of the WTs and Fv-engineered variants when 400 nM of each variant was added to the cells and incubated for 4 h followed by extensive washing and additional 4 h incubation before sample collection. (J) Residual amount of WTs and Fv-engineered variants. The amounts of IgG variants in all samples were quantified by ELISA, and obtained data are shown as mean ± SD of three independent experiments performed in triplicates. ns, not significant, ∗p = 0.0472 and ∗∗∗∗p < 0.0001, by one-way ANOVA (Dunnett’s multiple comparison test). (K–N) Uptake of (K) ustekinumab, (L) briakinumab, (M) mAb8, and (N) mAb9 at pH 7.4 when 400 nM of each was added to HMEC1-hFcRn cells treated with a mixture of control siRNA or siRNA targeting the hFcRh HC followed by incubation for 15 min, 30 min, 1 h, and 2 h. After extensive washing, the cells were lysed and added to ELISA for quantification of the amounts of antibody variants. Obtained data are presented as mean ± SD of five experiments performed in duplicates. ns, not significant and ∗∗∗∗p < 0.0001, by two-way ANOVA (Sidak’s multiple comparisons test).

References

    1. Abdiche Y.N., Yeung Y.A., Chaparro-Riggers J., Barman I., Strop P., Chin S.M., Pham A., Bolton G., Mcdonough D., Lindquist K., et al. The neonatal Fc receptor (FcRn) binds independently to both sites of the IgG homodimer with identical affinity. MAbs. 2015;7:331–343. - PMC - PubMed
    1. Andersen J.T., Justesen S., Fleckenstein B., Michaelsen T.E., Berntzen G., Kenanova V.E., Daba M.B., Lauvrak V., Buus S., Sandlie I. Ligand binding and antigenic properties of a human neonatal Fc receptor with mutation of two unpaired cysteine residues. FEBS J. 2008;275:4097–4110. - PubMed
    1. Baker N.A., Sept D., Joseph S., Holst M.J., Mccammon J.A. Electrostatics of nanosystems: application to microtubules and the ribosome. Proc. Natl. Acad. Sci. U S A. 2001;98:10037–10041. - PMC - PubMed
    1. Bloch Y., Bouchareychas L., Merceron R., Adanowska K., Bossche L., Detry S., Govindarajan S., Elewaut D., Haerynck F., Dullaers M. Structural activation of pro-inflammatory human cytokine IL-23 by cognate IL-23 receptor enables recruitment of the shared receptor IL-12r 1. Immunity. 2017;48:45–58. - PMC - PubMed
    1. Bonvin P., Venet S., Fontaine G., Ravn U., Gueneau F., Kosco-Vilbois M., Proudfoot A.E., Fischer N. De novo isolation of antibodies with pH-dependent binding properties. MAbs. 2015;7:294–302. - PMC - PubMed

LinkOut - more resources