. 2021 Aug;2(8):794-802.
doi: 10.1038/s43018-021-00232-6. Epub 2021 Aug 12.

Mature tertiary lymphoid structures predict immune checkpoint inhibitor efficacy in solid tumors independently of PD-L1 expression

Affiliations

Mature tertiary lymphoid structures predict immune checkpoint inhibitor efficacy in solid tumors independently of PD-L1 expression

Lucile Vanhersecke et al. Nat Cancer. 2021 Aug.

Abstract

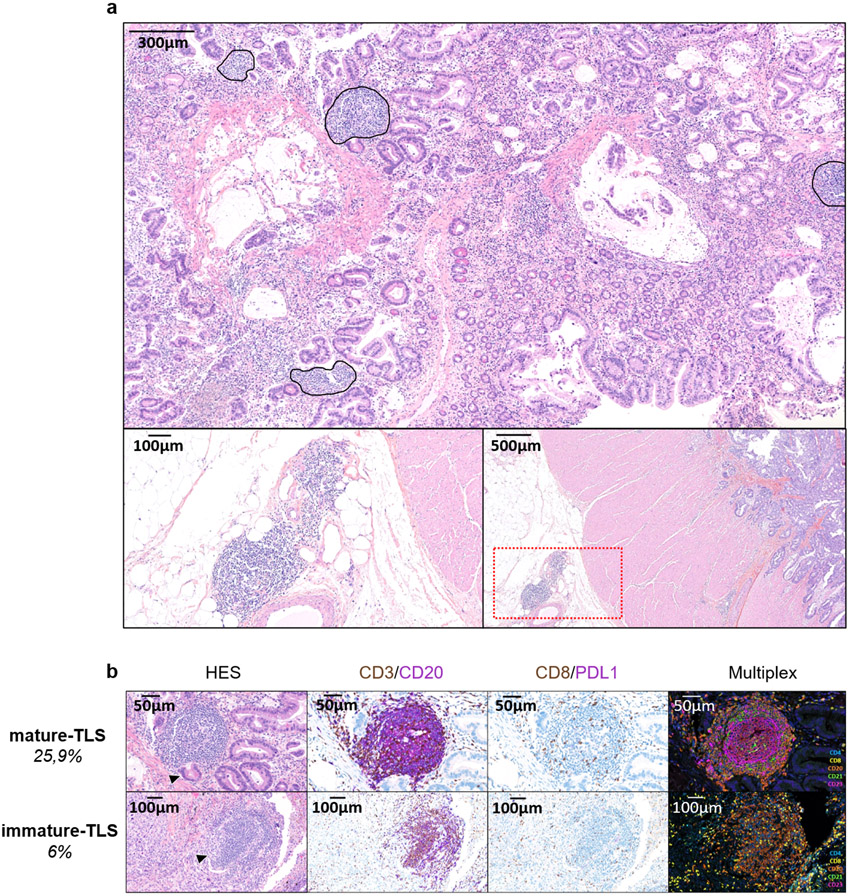
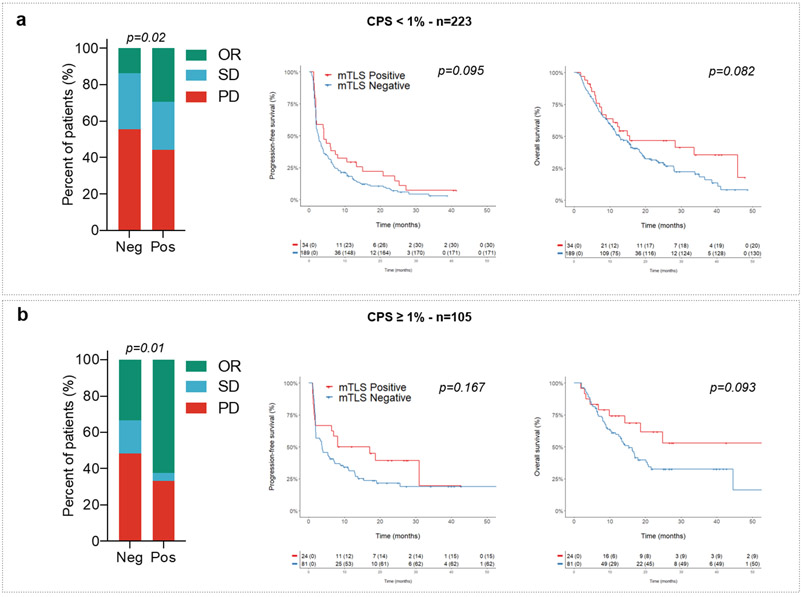
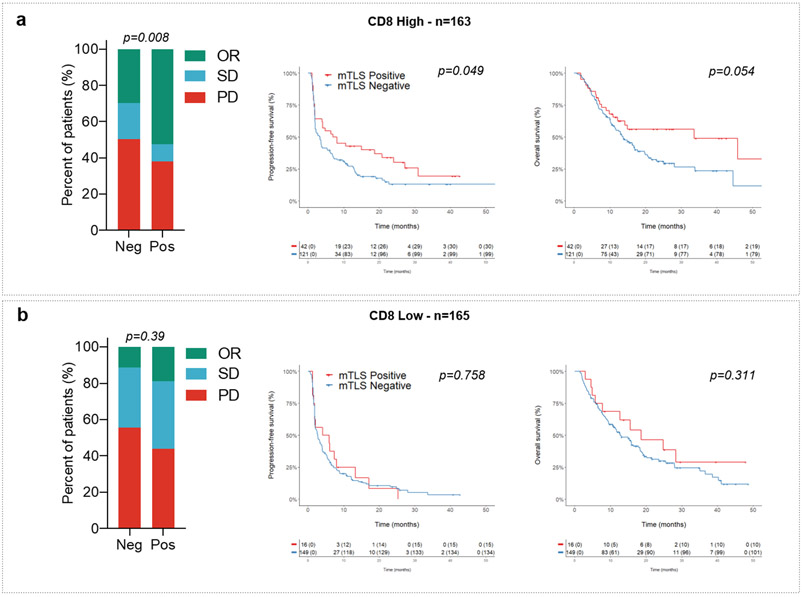
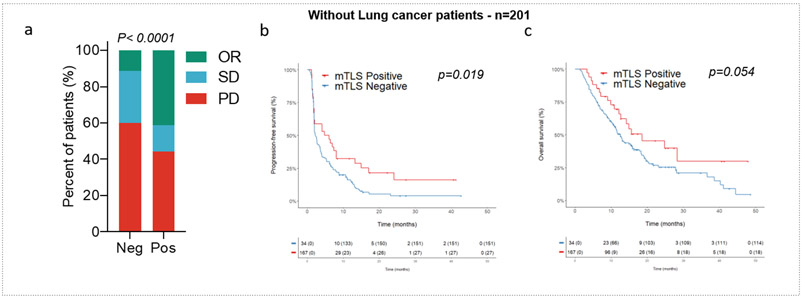
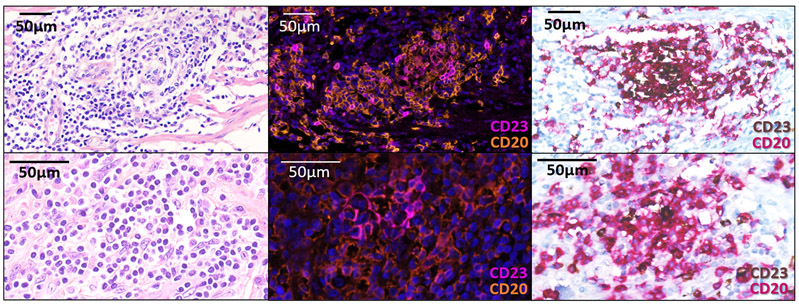
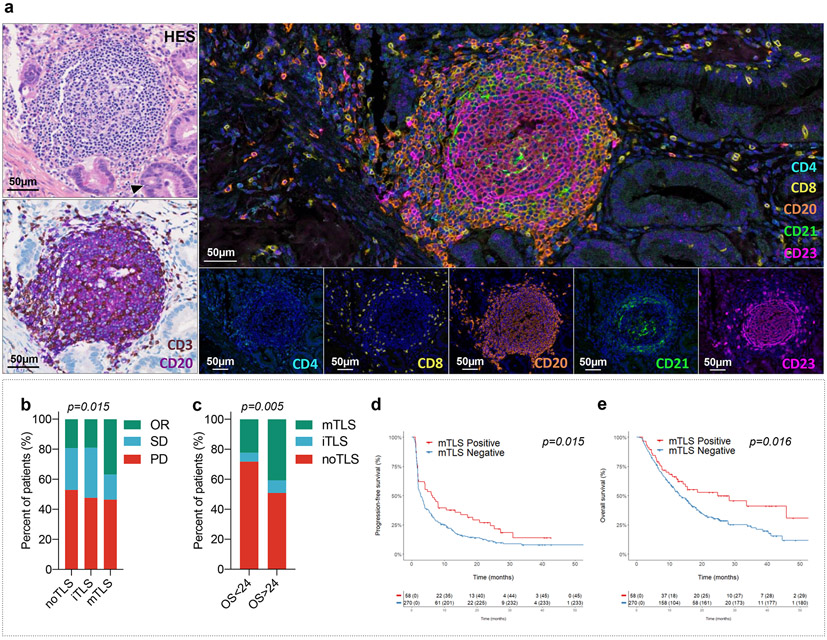
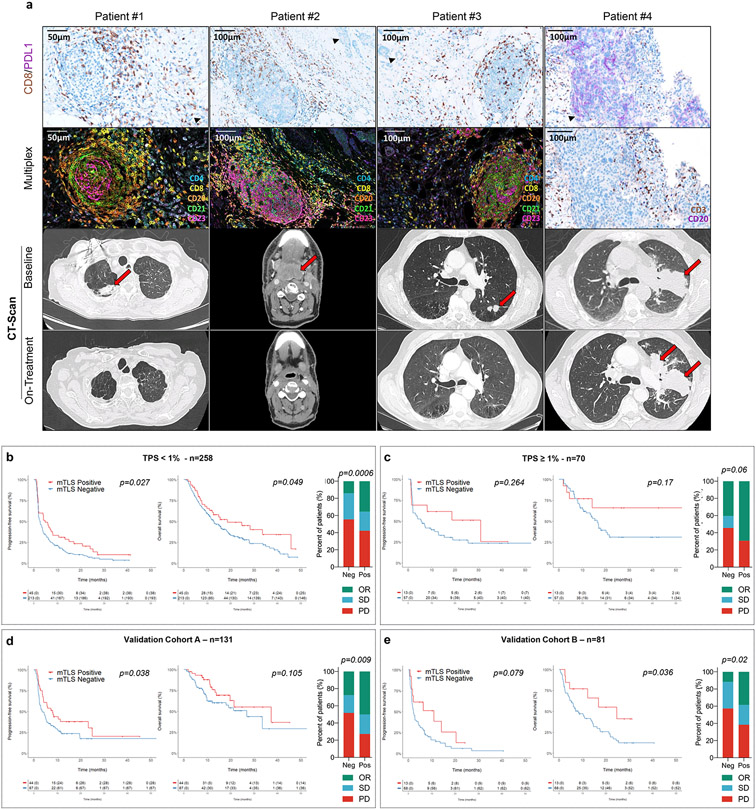
Only a minority of patients derive long-term clinical benefit from anti-PD1/PD-L1 monoclonal antibodies. The presence of tertiary lymphoid structures (TLS) has been associated with improved survival in several tumor types. Here, using a large-scale retrospective analysis of three independent cohorts of cancer patients treated with anti-PD1/PD-L1 antibodies, we showed that the presence of mature TLS was associated with improved objective response rate, progression-free survival, and overall survival independently of PD-L1 expression status and CD8+ T-cell density. These results pave the way for using TLS detection to select patients who are more likely to benefit from immune checkpoint blockade.

Keywords: Immune checkpoint inhibitors; biomarkers; tertiary lymphoid structures (TLS); tumor microenvironment.


Conflict of interest statement

DECLARATION OF INTERESTS LV, MB, SC, SLM, ML, IS, MT, GR, SP, MC, FC, CL, KB, MK, IG, CSF, VV, FC, WHF, and FLL: Nothing to disclose AB, JPG, and CR: Employees of Immusmol/Explicyte EO, AS: Employees of Astra Zeneca AI: Received research grants from Astra Zeneca, Bayer, BMS, Chugai, Merck, MSD, Pharmamar, Novartis, Roche, and received personal fees from Epizyme, Bayer, Lilly, Roche, and Springworks BB: Received grants from AstraZeneca , Pfizer , Eli Lilly , Onxeo , Bristol Myers Squibb , Inivata , Abbvie , Amgen , Blueprint Medicines , Celgene , GlaxoSmithKline , Ignyta , Ipsen , Merck KGaA , MSD Oncology , Nektar , PharmaMar , Sanofi , Spectrum Pharmaceuticals , Takeda , Tiziana Therapeutics , Cristal Therapeutics , Daiichi Sankyo , Janssen Oncology , OSE Immunotherapeutics , BeiGene , Boehringer Ingelheim , Genentech , SERVIER , Tolero Pharmaceuticals YL: Received grants and personal fees from Janssen, during the conduct of the study; personal fees and non-financial support from Astellas, grants and personal fees from Sanofi, personal fees and non-financial support from Roche, personal fees and non-financial support from AstraZeneca, grants, personal fees and non-financial support from MSD, personal fees and non-financial support from BMS, personal fees from Clovis , personal fees and non-financial support from Seattle Genetics, personal fees from Incyte, personal fees from Pfizer. AM: Received research grants from Mersu, Bristol-Myers Squibb, Boehringer Ingelheim, Transgene, MSD and received personal fees from Bristol-Myers Squibb, AstraZeneca, MedImmune, Oncovir, Merieux JCS: Has received consultancy fees from AstraZeneca, Astex, Clovis, GSK, GamaMabs, Lilly, MSD, Mission Therapeutics, Merus, Pfizer, Pharma Mar, Pierre Fabre, Roche/Genentech, Sanofi, Servier, Symphogen, and Takeda.

Figures

Extended Data Fig. 1
Extended Data Fig. 1. Assessment of the presence of TLS and their maturation stage in tumors.
a: This is a TLS-positive primary pancreatic adenocarcinoma associated with a T CD8+ lymphocyte density of 154/mm2 and negative for PD-L1. The TLS are delineated with the black lines on the HES slide, highlighting their vicinity to tumor cells. Scale bar indicates 300μm in size. Representative of 540 tumors analyzed (Discovery cohort n=328, validation cohort A n=131, validation cohort B n=81). b: This panel shows representative examples of immature and mature TLS observed in tumor samples. Upper panel: This mature TLS is detected in a primary pancreatic adenocarcinoma associated with a T CD8+ lymphocyte density of 154/mm2 and negative for PD-L1. Mature TLS are defined by the presence of a network of CD23-positive dendritic cells on immunofluorescence (note that in this case, the presence of a germinal center visible on the HES was already diagnostic of a mature TLS). Lower panel: The picture shows an immature TLS detected in a primary adenocarcinoma of the lung concomitantly showing a high T CD8+ lymphocyte infiltrate of 372/mm2 and a PD-L1 TPS score of 1%. The tumor was only associated with immature TLS displaying no germinal center and no network of CD23-positive dendritic cells on immunofluorescence. Representative of 540 tumors analyzed (Discovery cohort n=328, validation cohort A n=131, validation cohort B n=81). The pictures from the left to right column correspond to 1) Hematoxylin Eosin Saffron (HES) staining, 2) Double immunohistochemistry staining of CD3/CD20 (CD3 in brown, CD20 in purple), 3) Double immunohistochemistry staining of CD8/PD-L1 (CD8 in brown, PD-L1 in purple), 4) Multiplex immunofluorescence assay of CD4 (blue), CD8 (yellow), CD20 (orange), CD21 (green) and CD23 (pink). The scale bars on the HES images indicate 50μm and 100μm for the upper and lower panels, respectively. Black cropped arrows highlight the tumor cells in the samples.
Extended Data Fig. 2
Extended Data Fig. 2. Predictive value of TLS status according to CPS PD-L1 scores.
Objective response rates (OR: objective response, SD: stable disease; PD: progressive disease; chi squared (χ2) test) and Kaplan-Meier curves of progression-free survival (log-rank test) and overall survival (log-rank test) of 328 cancer patients treated with anti-PD1/PD-L1 antagonists according to CPS PD-L1 scores (a: CPS PD-L1 <1, N=223 patients; b: CPS PD-L1 ≥ 1, N=105 patients) and TLS status (red curve: mature-TLS positive tumors; blue line: mature-TLS negative tumors).
Extended Data Fig. 3
Extended Data Fig. 3. Predictive value of TLS status according to T CD8 cell density.
Objective Response rates (OR: objective response, SD: stable disease, PD: progressive disease; chi squared (χ2) test) and Kaplan-Meier curves of progression-free (log-rank test) and overall survival (log-rank test) of 328 cancer patients treated with anti-PD1/PD-L1 antagonists according to T CD8+ cell density (a: low density, N=165 patients; b: high density, N=163 patients) and TLS status (red curve: mature-TLS positive tumors; blue line: mature-TLS negative tumors).
Extended Data Fig. 4
Extended Data Fig. 4. Outcome of cancer patients (non-small cell lung cancer excluded) according to TLS status
a) Objective Response rates (OR: objective response, SD: stable disease, PD: progressive disease; chi squared (χ2) test) and Kaplan-Meier curves (log-rank test) of progression-free (b) and overall survival (c) of 201 cancer patients (all tumor types except non-small cell lung cancer) treated with anti-PD1/PD-L1 antagonists according to TLS status (red curve: mature-TLS positive tumors; blue line: mature-TLS negative tumors).
Extended Data Fig. 5
Extended Data Fig. 5. Comparison of the TLS screening with pathology and immunohistochemistry pathology versus the screening with immunofluorescence (method by Petitprez et al).
First line: conspicuous mature TLS with CD23+ follicular dendritic cells network. Second line: mature TLS defined by isolated CD23+ cell displaying dendritic morphology. Pictures from the left to right column correspond to 1) Hematoxylin Eosin Saffron (HES) staining, 2) Multiplex immunofluorescence assay of CD23 (pink) and CD20 (orange), 3) Double immunohistochemistry staining of CD23/CD20 (CD23 in brown, CD20 in red). The scale bars on the HES images indicate 50μm in size. Representative of 540 tumors analyzed (Discovery cohort n=328, validation cohort A n=131, validation cohort B n=81).
Figure 1.
Figure 1.. Mature TLS are predictive of outcome in cancer patients treated with immune-checkpoint inhibitors.
a, The presence of TLS in tumors was systematically screened with a Hematoxylin Eosin Saffron (HES) staining and double immunohistochemistry staining of CD3-CD20 (CD3 and CD20 stained in brown and purple, respectively). PD-L1 status was assessed with a double immunohistochemistry staining of CD8/PD-L1 (CD8 and PD-L1 stained in brown and purple, respectively). The maturity of TLS was assessed in TLS positive tumors with a multiplex immunofluorescence assay combining CD4, CD8, CD20, CD21 and CD23 markers. This illustrated case is a primary pancreatic adenocarcinoma associated with mature TLS displaying a prominent germinal center on HES staining. Representative of 540 tumors analyzed (Discovery cohort n=328, validation cohort A n=131, validation cohort B n=81). This tumor was negative for PD-L1 and displayed a T-cell CD8+ lymphocytes density of 154/mm2. Immunofluorescence assay show a dense network of CD23+ follicular dendritic cells within the germinal center. The scale bar indicates 50μm in size. Black cropped arrow highlights the tumor cells in the sample. Images at the bottom show the expression of each single marker assessed with its corresponding fluorescence spectrum. b, Response rate as defined per RECIST criteria according to the TLS status: absence (no TLS, N=223 patients), immature TLS (iTLS, N=21 patients) or mature TLS (mTLS, N=84 patients). PD is indicative of progressive disease, SD of stable disease and OR of objective response as per RECIST 1.1 criteria. [chi squared (χ2) test] c, Proportion of patients characterized by the absence or presence of either iTLS or mTLS according to overall survival endpoint (OS ≤ 24 months versus > 24 months from immunotherapy onset, chi-squared test) [panels (B,C), N = 328 patients] d, Kaplan-Meier curves of progression-free survival and overall survival in the discovery cohort of 328 cancer patients treated with anti-PD1/PD-L1 antagonists according to the mature TLS status (red curve: mature-TLS enriched tumors; blue curve: mature-TLS negative tumors). [log-rank test]
Figure 2.
Figure 2.. Mature TLS are predictive of response to immune-checkpoint inhibition independently of the PD-L1 expression status.
a, Panel A: For each case, from top to bottom, 1) Double staining of CD8/PD-L1 (CD8 in brown, PD-L1 in purple); 2) Multiplex immunofluorescence assay of CD4 (blue), CD8 (yellow), CD20 (orange), and CD23 (pink); 3) and 4) Computed Tomography scan obtained at baseline and 8-16 weeks after treatment onset. Patient #1: Near complete response in a case of mature TLS+ metastasis of a lung adenocarcinoma with a CD8+ T lymphocytes density of 159/mm2 and a negative PD-L1 status. Patient #2: Complete response in a case of mature TLS+ metastasis of a pharyngeal squamous cell carcinoma negative for PD-L1 associated with a T-CD8 lymphocytes density of 124/mm2. Patient #3: Near complete response in a case of mature TLS+ microsatellite stable (MSS) colorectal adenocarcinoma associated with a T-CD8+ lymphocytes density of 115/mm2 and with a low PD-L1 rate (TPS score = 1%). Patient #4: Progressive disease in a patient with advanced lung adenocarcinoma showing high expression of PD-L1 and no detectable TLS (Representative of tumor samples and imaging of N = 4 patients from 540 tumors analyzed [Discovery cohort n=328, validation cohort A n=131, validation cohort B n=81]. b, On the left part, the histogram highlights the response rates achieved in patients with PDL1-negative tumors (defined as a TPS score < 1%, N=258 patients) according to the absence (no mTLS) or presence of mTLS. On the right part, from the left to right the Kaplan-Meier curves depict the progression-free survival and overall survival of the patients with PDL1-negative tumors according to their mTLS status. [log-rank test] c, On the left part, the histogram highlights the different response rates in patients with PDL1-positive tumors (defined as a TPS score > 1%, N=70 patients) according to the absence or presence of mTLS. On the right part, from the left to right the Kaplan-Meier curves depict the progression-free survival and overall survival of the patients with PD-L1-positive tumors according to their mTLS status d-e) In validation cohort A (N=131 patients) and in validation cohort B consisting (N=81 patients) , all treated with PD(L)1 antagonists, (left) illustration of response rate as defined per RECIST criteria according to the absence or presence of mature TLS (mTLS) and (right) Kaplan-Meier curves of progression-free survival and overall survival of cancer patients according to the absence or presence of mTLS. [log-rank test] Abbreviations: SD: stable disease, OR: objective response, PD: progressive disease, mTLS: mature TLS.

References

    1. Vaddepally RK, Kharel P, Pandey R, Garje R, Chandra AB. Review of Indications of FDA-Approved Immune Checkpoint Inhibitors per NCCN Guidelines with the Level of Evidence. Cancers (Basel). 2020. Mar 20;12(3). - PMC - PubMed
    1. Davis AA, Patel VG. The role of PD-L1 expression as a predictive biomarker: an analysis of all US Food and Drug Administration (FDA) approvals of immune checkpoint inhibitors. J Immunother Cancer. 2019;7(1):278. - PMC - PubMed
    1. Cassetta L, Kitamura T. Targeting Tumor-Associated Macrophages as a Potential Strategy to Enhance the Response to Immune Checkpoint Inhibitors. Front Cell Dev Biol. 2018;6:38. - PMC - PubMed
    1. Schalper KA, Carleton M, Zhou M, et al. Elevated serum interleukin-8 is associated with enhanced intratumor neutrophils and reduced clinical benefit of immune-checkpoint inhibitors. Nat Med. 2020;26(5):688–692. - PMC - PubMed
    1. Sautès-Fridman C, Petitprez F, Calderaro J, Fridman WH. Tertiary lymphoid structures in the era of cancer immunotherapy. Nat Rev Cancer. 2019;19(6):307–325. - PubMed

Publication types

MeSH terms