

Analysis of the Associations Between the Human Fecal Microbiome and Bone Density, Structure, and Strength: The Osteoporotic Fractures in Men (MrOS) Cohort
- PMID: 35119137
- PMCID: PMC9605688
- DOI: 10.1002/jbmr.4518
Analysis of the Associations Between the Human Fecal Microbiome and Bone Density, Structure, and Strength: The Osteoporotic Fractures in Men (MrOS) Cohort
Abstract
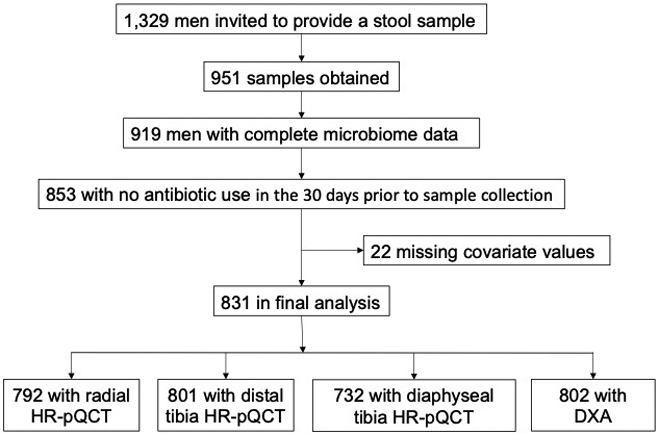
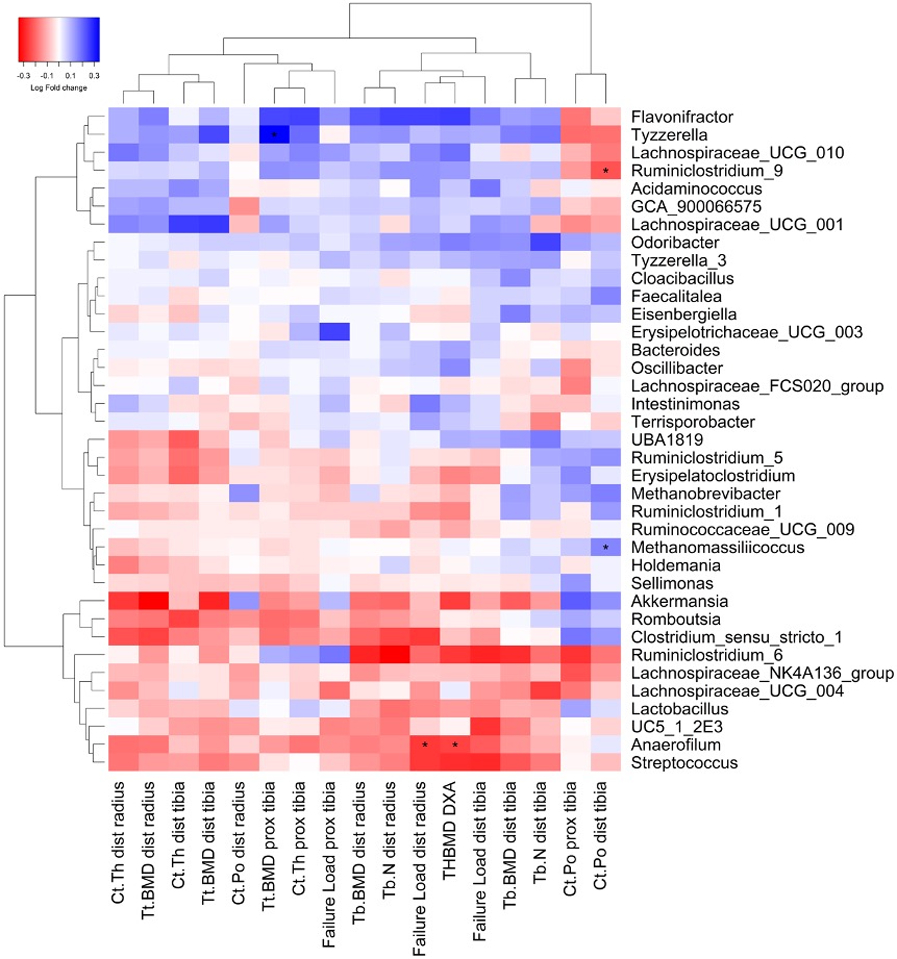
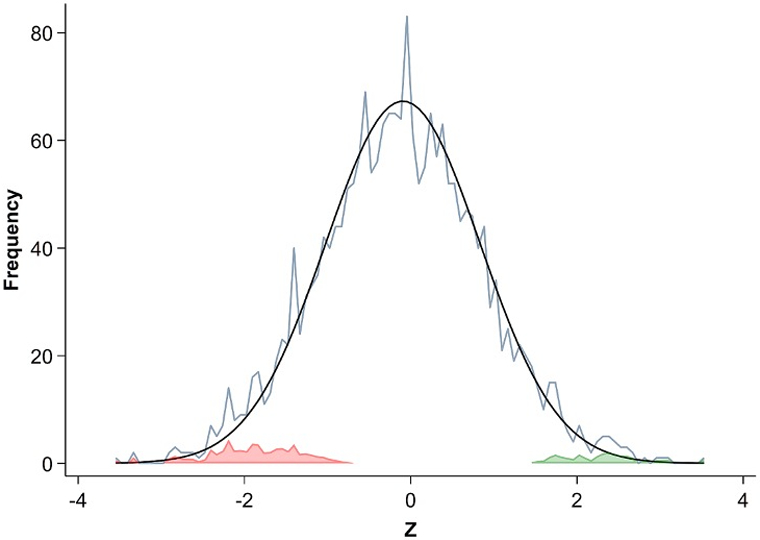
In preclinical models, the composition and function of the gut microbiota have been linked to bone growth and homeostasis, but there are few available data from studies of human populations. In a hypothesis-generating experiment in a large cohort of community-dwelling older men (n = 831; age range, 78-98 years), we explored the associations between fecal microbial profiles and bone density, microarchitecture, and strength measured with total hip dual-energy X-ray absorptiometry (DXA) and high-resolution peripheral quantitative computed tomography (HRpQCT) (distal radius, distal and diaphyseal tibia). Fecal samples were collected and the 16S rRNA gene V4 hypervariable region sequenced. Sequences were bioinformatically processed through the DADA2 pipeline and then taxonomically assigned using SILVA. Generalized linear models as implemented in microbiome multivariable association with linear models (MaAsLin 2) were used to test for associations between skeletal measures and specific microbial genera. The abundances of four bacterial genera were weakly associated with bone density, structure, or strength (false discovery rate [FDR] ≤ 0.05), and the measured directions of associations of genera were generally consistent across multiple bone measures, supporting a role for microbiota on skeletal homeostasis. However, the associated effect sizes were small (log2 fold change < ±0.35), limiting power to confidently identify these associations even with high resolution skeletal imaging phenotypes, and we assessed the resulting implications for the design of future cohort-based studies. As in analogous examples from genomewide association studies, we find that larger cohort sizes will likely be needed to confidently identify associations between the fecal microbiota and skeletal health relying on 16S sequencing. Our findings bolster the view that the gut microbiome is associated with clinically important measures of bone health, while also indicating the challenges in the design of cohort-based microbiome studies. © 2022 American Society for Bone and Mineral Research (ASBMR).
Keywords: AGING; ANALYSIS/QUANTITATION OF BONE; EPIDEMIOLOGY; SYSTEMS BIOLOGY - BONE INTERACTIONS.
© 2022 American Society for Bone and Mineral Research (ASBMR).
Figures
Comment in
-
Down-to-Earth Studies of the Gut Microbiome in Bone Health and Disease.J Bone Miner Res. 2022 Apr;37(4):595-596. doi: 10.1002/jbmr.4547. Epub 2022 Mar 30. J Bone Miner Res. 2022. PMID: 35298042 No abstract available.
References
Publication types
MeSH terms
Substances
Grants and funding
LinkOut - more resources
Full Text Sources
Other Literature Sources
Medical
Research Materials
