. 2022 Apr;9(10):e2104317.
doi: 10.1002/advs.202104317. Epub 2022 Feb 4.

Cdyl Deficiency Brakes Neuronal Excitability and Nociception through Promoting Kcnb1 Transcription in Peripheral Sensory Neurons

Affiliations

Cdyl Deficiency Brakes Neuronal Excitability and Nociception through Promoting Kcnb1 Transcription in Peripheral Sensory Neurons

Zhao-Wei Sun et al. Adv Sci (Weinh). 2022 Apr.

Erratum in

Abstract

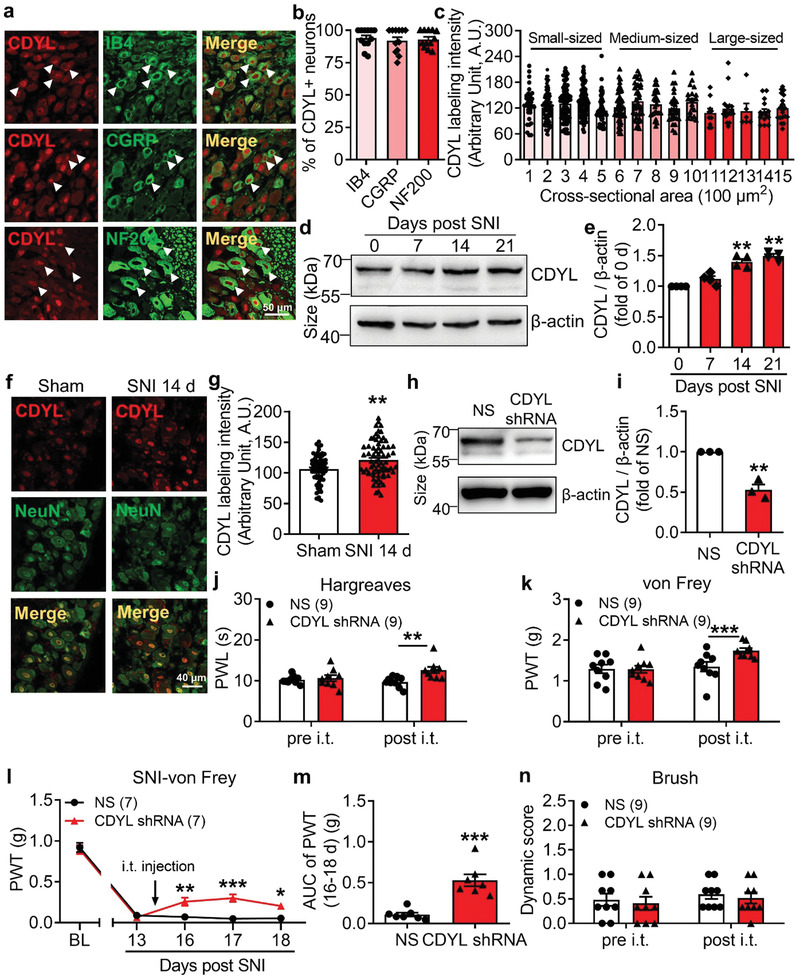
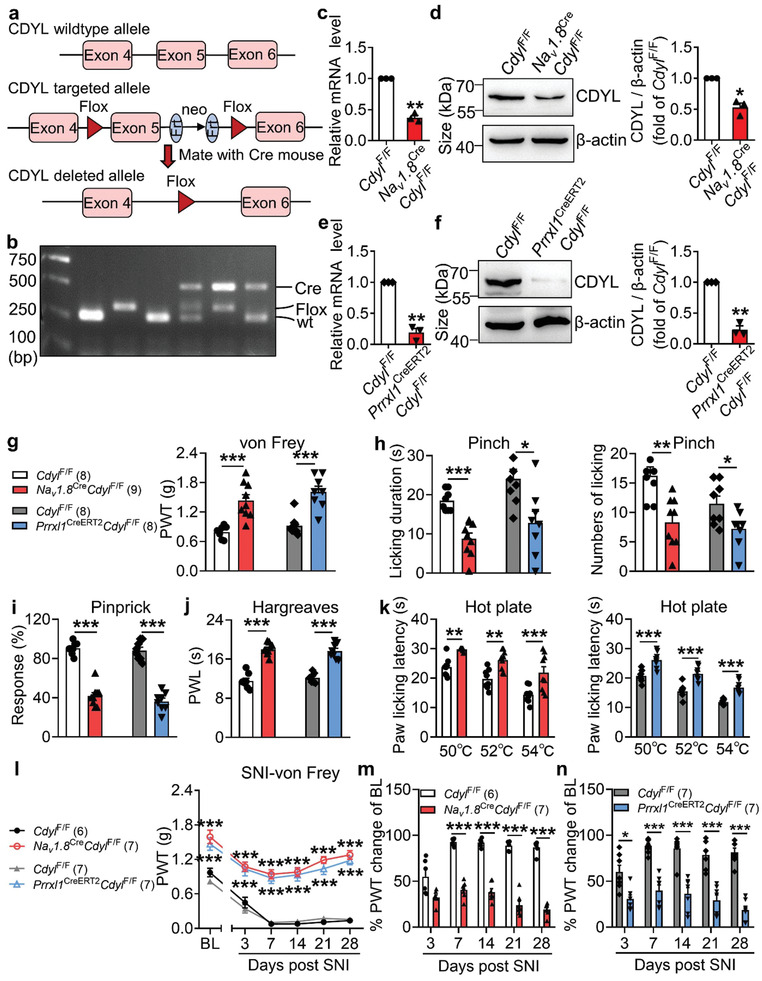
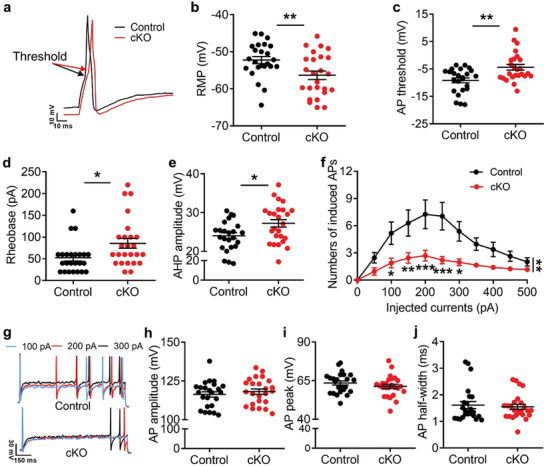
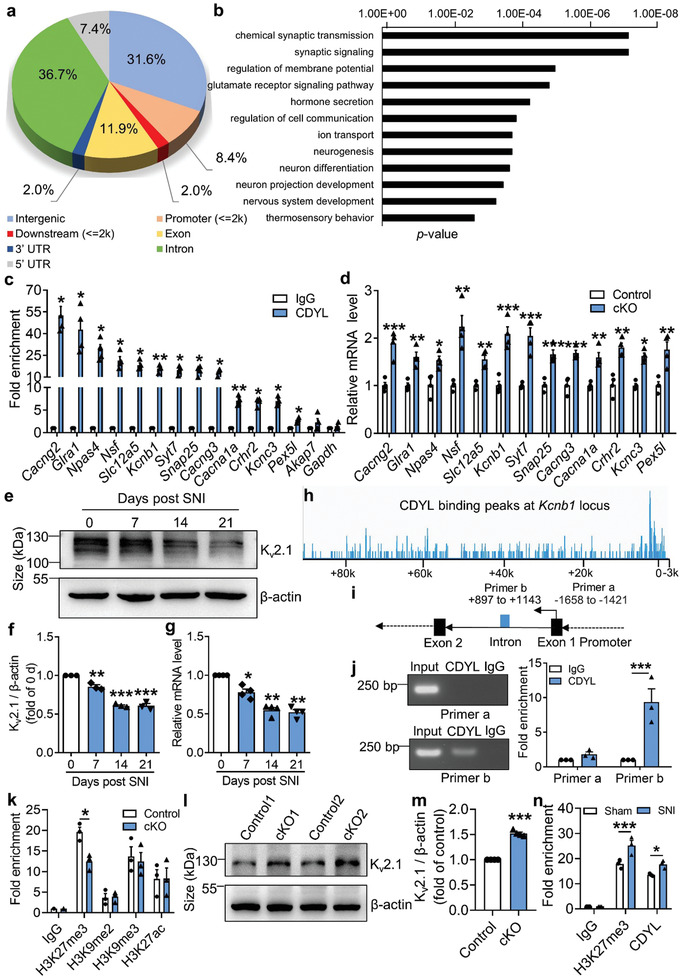
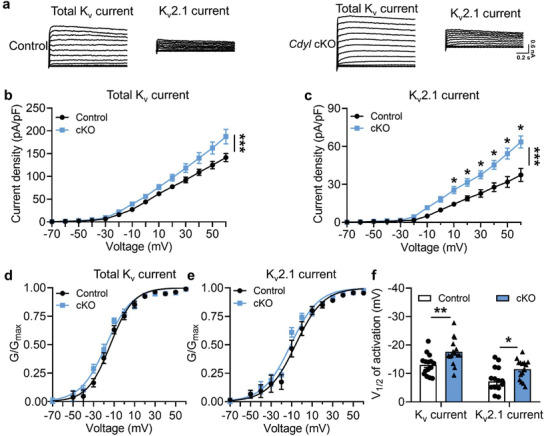
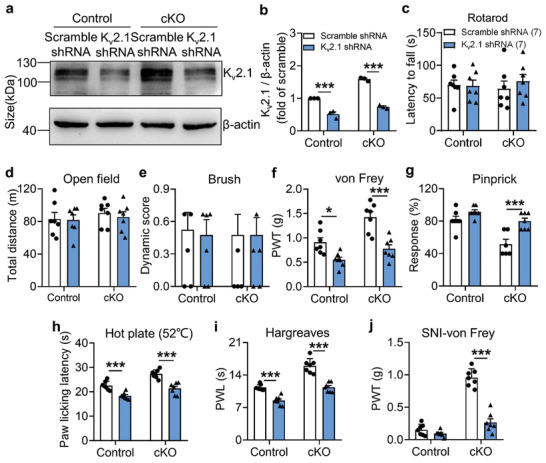
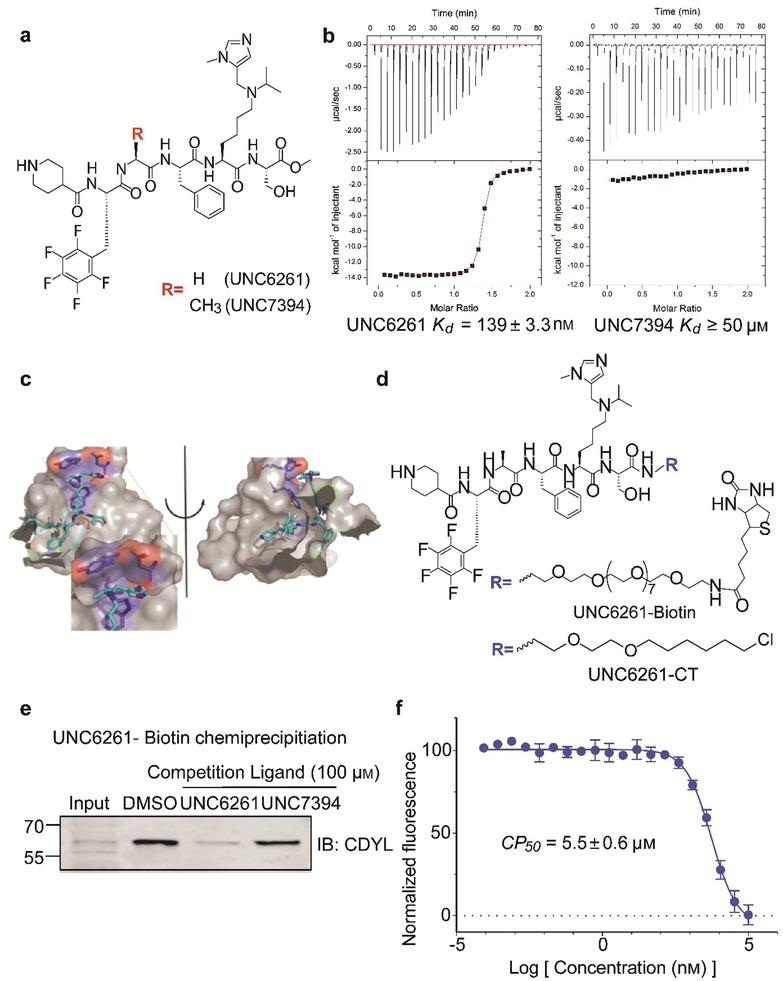
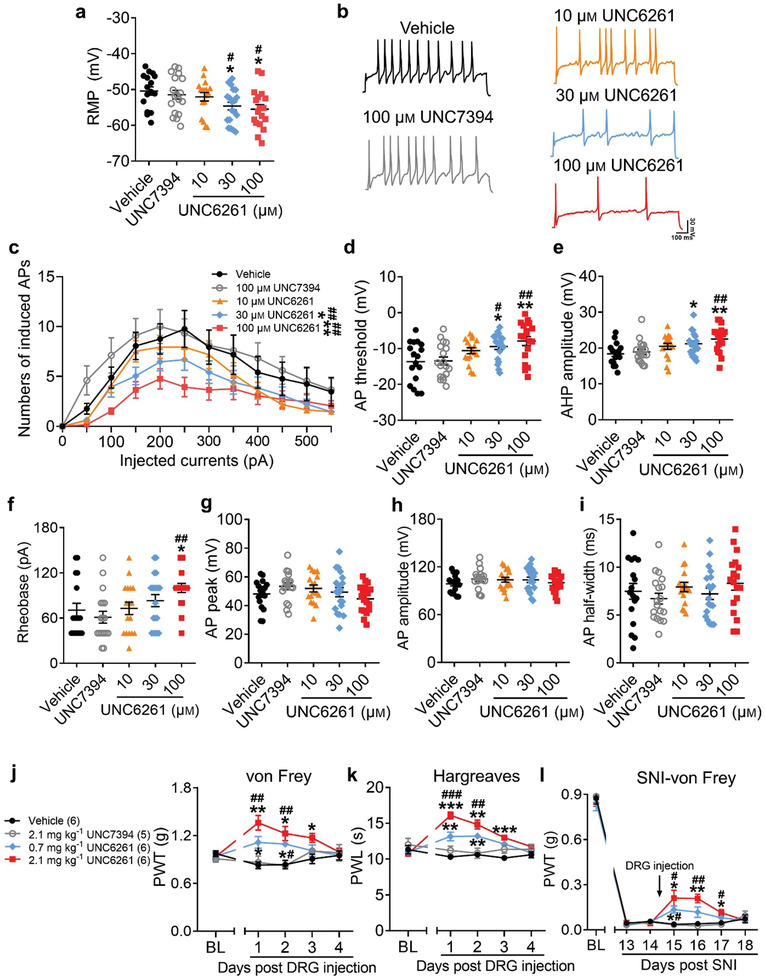
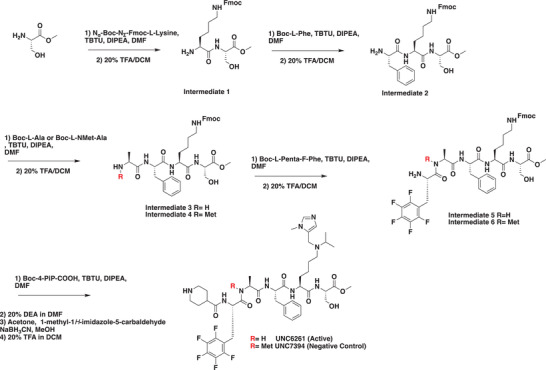
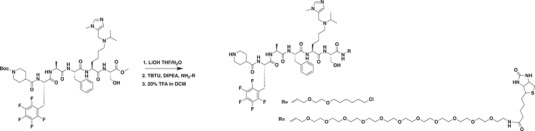
Epigenetic modifications are involved in the onset, development, and maintenance of pain; however, the precise epigenetic mechanism underlying pain regulation remains elusive. Here it is reported that the epigenetic factor chromodomain Y-like (CDYL) is crucial for pain processing. Selective knockout of CDYL in sensory neurons results in decreased neuronal excitability and nociception. Moreover, CDYL facilitates histone 3 lysine 27 trimethylation (H3K27me3) deposition at the Kcnb1 intron region thus silencing voltage-gated potassium channel (Kv ) subfamily member Kv 2.1 transcription. Loss function of CDYL enhances total Kv and Kv 2.1 current density in dorsal root ganglia and knockdown of Kv 2.1 reverses the pain-related phenotypes of Cdyl deficiency mice. Furthermore, focal administration of a novel potent CDYL antagonist blunts nociception and attenuates neuropathic pain. These findings reveal that CDYL is a critical regulator of pain sensation and shed light on the development of novel analgesics targeting epigenetic mechanisms.

Keywords: Kv2.1 channel; chromodomain Y-like; epigenetic regulation; novel chromodomain Y-like antagonist; pain sensation.


Conflict of interest statement

The authors declare no conflict of interest.

Figures

Figure 1
Figure 1
Peripheral CDYL is required for pain processing. a) Representative images of CDYL (red) and CGRP (green), IB4 (green), or NF200 (green) immunostaining in DRG. Scale bar, 50 µm. b) Quantification of the percentages of CDYL‐positive (CDYL+) neurons among those labeled with indicated markers. n = 3 biological replicates. One‐way ANOVA with Turkey's post‐hoc, no statistical significance. c) Labeling intensity of CDYL in DRG neurons with different cross‐sectional area. n = 4 mice. One‐way ANOVA with Turkey's post‐hoc, no statistical significance. d) Representative images of CDYL expression in ipsilateral L4‐5 DRG on days 0, 7, 14, and 21 after SNI by western blotting. e) Quantification of the CDYL protein level in (d). n = 4 biological replicates. One‐way ANOVA with Turkey's post‐hoc, **p < 0.01. f) Representative images of CDYL (red) and NeuN (green) immunostaining in DRG on day 14 after sham and SNI. Scale bar, 40 µm. g) Quantification of the CDYL labeling intensity in (f). n = 3 mice. Student's unpaired t test, **p < 0.01. h) Representative images of CDYL expression in DRG after transfection with indicated plasmids. i) Quantification of the CDYL protein level in (h). n = 4 biological replicates. Student's paired t test, **p < 0.01. j) Basal paw withdrawal latency (PWL) to radiant heat stimuli before and after intrathecal (i.t.) injection was assessed by Hargreaves's method. Two‐way ANOVA with Sidak's post‐hoc test, **p < 0.01. k) Basal paw withdrawal threshold (PWT) to mechanical stimuli was assessed by von Frey test. Two‐way ANOVA with Sidak's post‐hoc test, ***p < 0.001. l) Time course of PWT of the ipsilateral hind paw after SNI. Two‐way ANOVA with Sidak's post‐hoc test, *p < 0.05, **p < 0.01, ***p < 0.001. m) Area under the curve (AUC) from days 16 to 18 after SNI was compared. Student's unpaired t test, ***p < 0.001. n) Basal touch sensitivity was assessed by brush test. Two‐way ANOVA with Sidak's post‐hoc test, no statistical significance. Data are the mean ± SEM.
Figure 2
Figure 2
Loss of CDYL in male mice DRG decreases pain sensitivity. a) Strategy of conditional Cdyl knockout mice. b) PCR analysis of genomic DNA from intercrosses. c,e) The Cdyl mRNA level in DRG from homozygous genotypes of the Cdyl‐floxp mice crossed with Nav1.8‐Cre (Nav1.8 Cre Cdyl F/F) (c) or Prrxl1‐CreERT2 (Prrxl1CreERT2 Cdyl F/F) (e) mice was examined by qRT‐PCR. n = 4 biological replicates. Student's paired t test, **p < 0.01. d,f) Representative images of CDYL expression in Nav1.8 Cre Cdyl F/F mice (d) or Prrxl1CreERT2 Cdyl F/F mice (f) by western blotting (left). Quantification of CDYL expression in the left image (right). n = 4 biological replicates. Student's paired t test, *p < 0.05, **p < 0.01. g) Basal PWT was assessed by von Frey test. Student's unpaired t test, ***p < 0.001. h) Licking durations (left) and numbers (right) responding to pinching stimuli were measured. Student's unpaired t test, *p < 0.05, **p < 0.01, ***p < 0.001. i) Response to pinprick stimuli were assessed by pinprick test. Student's unpaired t test, ***p < 0.001. j) Basal PWL was assessed by Hargreaves's method. Student's unpaired t test, ***p < 0.001. k) Response to noxious heat stimuli was assessed by hot plate test. Student's unpaired t test, **p < 0.01, ***p < 0.001. l) Time course of PWT after SNI. Two‐way ANOVA with Sidak's post‐hoc test, ***p < 0.001. m,n) Percentages of PWT changes of baseline at different time points after SNI. Two‐way ANOVA with Sidak's post‐hoc test, *p < 0.05, ***p < 0.001. Data are the mean ± SEM.
Figure 3
Figure 3
Loss of CDYL in male mice DRG inhibits neuronal excitability. a) Representative traces of evoked action potentials (APs) in DRG neurons. Scale bars, 10 ms and 10 mV. b–e) The resting membrane potential (RMP) (b), AP threshold (c), current threshold (rheobase) (d) and the amplitude of after‐hyperpolarization (AHP) (e) obtained from DRG neurons of male Cdyl cKO mice and their littermate controls. Student's unpaired t test, *p < 0.05, **p < 0.01. f,g) Numbers (f) and representative traces (g) of APs induced by indicated currents. Scale bars, 150 ms and 30 mV. Two‐way ANOVA, group effect: **p < 0.01, shown at the end of the lines; post‐test: Sidak's post‐hoc test, *p < 0.05, **p < 0.01, ***p < 0.001, shown below the lines. h–j) The amplitude (h), peak (i), and half‐width (j) of AP in DRG neurons of Cdyl cKO mice and controls. Student's unpaired t test, no statistical significance. n control = 24; n cKO = 25. Data are presented as mean ± SEM.
Figure 4
Figure 4
CDYL suppresses Kcnb1 transcription by promoting H3K27me3 at the intron region. a) The genomic distribution of CDYL binding locus was determined by ChIP‐seq analysis. b) The biological process of the identified genes was classified by GO analysis. c) The ChIP‐seq results were verified in mice DRG by ChIP‐qPCR analysis. n = 3 biological replicates. Student's paired t test, *p < 0.05, **p < 0.01. d) The mRNA levels of representative genes in Cdyl cKO and control mice were measured by qRT‐PCR. n = 4 biological replicates. Student's paired t test, *p < 0.05, **p < 0.01, ***p < 0.001. e) Representative images of Kv2.1 expression in the ipsilateral DRG after SNI by western blotting. f) Quantification of the Kv2.1 protein level in (e). n = 3 biological replicates. One‐way ANOVA with Turkey's post‐hoc test, **p < 0.01, ***p < 0.001. g) The Kcnb1 mRNA level after SNI was measured by qRT‐PCR. n = 4 biological replicates. One‐way ANOVA with Turkey's post‐hoc test, *p < 0.05, **p < 0.01. h) The genome‐wide snapshot of CDYL binding peaks at Kcnb1 locus. i) Diagram of the designed primer pairs to indicated regions. j) The fold enrichment of CDYL at the Kcnb1 intron and promoter region by semi‐qChIP (left) and ChIP‐qPCR (right). n = 3 biological replicates. Student's paired t test, ***p < 0.001. k) The fold enrichment of H3 modifications at the Kcnb1 intron region in Cdyl cKO and control mice was measured by ChIP‐qPCR. n = 4 biological replicates. Student's paired t test, *p < 0.05. l) Representative images of Kv2.1 expression in Cdyl cKO mice and controls. m) Quantification of the Kv2.1 protein level in (l). n = 4 biological replicates. Student's paired t test, ***p < 0.001. n) The fold enrichment of H3K27me3 and CDYL at the Kcnb1 intron region on day 14 after SNI was measured by ChIP‐qPCR. n = 4 biological replicates. Student's paired t test, * p < 0.05, *** p < 0.001. Data are the mean ± SEM.
Figure 5
Figure 5
Loss of CDYL enhances total Kv and Kv2.1 currents in DRG. a) Representative traces of total Kv (left) and Kv2.1 current (right) in DRG neurons from control and Cdyl cKO mice. Scale bars, 0.2 s and 0.6 nA. b, c) Densities of total Kv (b) and Kv2.1 current (c) in DRG neurons from control and Cdyl cKO mice. Two‐way ANOVA, group effect: ***p < 0.001, shown at the end of the lines; post‐test: Sidak's post‐hoc test, *p < 0.05, shown above the lines. d,e) The activation curves of total Kv (d) and Kv2.1 current (e) in the DRG neurons from control and Cdyl cKO mice. f) The half‐activation values (V1/2) of total Kv and Kv2.1 current in the DRG neurons from control and Cdyl cKO mice. Student's unpaired t test, *p < 0.05, **p < 0.01. n control = 15, n cKO = 15. Data are the mean ± SEM.
Figure 6
Figure 6
CDYL mediates nociception through Kv2.1 channel. a) Representative images of Kv2.1 expression in ipsilateral DRG infected with AAV‐scramble shRNA or AAV‐Kv2.1 shRNA by western blotting. b) Quantification of the Kv2.1 protein level in (a). n = 3 biological replicates. Two‐way ANOVA with Turkey's post‐hoc test, ***p < 0.001. c,d) Coordination skills and motor activities were assessed by rotarod test (c) and open field test (d), respectively. Two‐way ANOVA with Turkey's post‐hoc test, no statistical significance. e) Tactile sensitivity was assessed by brush test. Two‐way ANOVA with Turkey's post‐hoc test, no statistical significance. f) Basal PWT was assessed by von Frey test. Two‐way ANOVA with Turkey's post‐hoc test, *p < 0.05, ***p < 0.001. g) Response to mechanical stimuli was assessed by pinprick test. Two‐way ANOVA with Turkey's post‐hoc test, ***p < 0.001. h) Response to thermal stimuli was assessed by hot plate test. Two‐way ANOVA with Turkey's post‐hoc test, ***p < 0.001. i) Basal PWL was assessed by Hargreaves test. Two‐way ANOVA with Turkey's post‐hoc test, ***p < 0.001. j) Mechanical allodynia on day 14 after SNI was assessed. Two‐way ANOVA with Turkey's post‐hoc test, ***p < 0.001. Data are the mean ± SEM.
Figure 7
Figure 7
UNC6261 is a potent antagonist of the CDYL chromodomain. a) Structure of UNC6261 and negative control ligand UNC7394. b) UNC6261 potently binds the CDYL chromodomain as determined by isothermal titration calorimetry whereas UNC7394 demonstrates no measurable binding. Data are the mean ± S.D. c) X‐ray crystal structure of UNC6261 bound to CDYL highlighting the surface groove and aromatic cage (bottom left) interactions (PDB: 7N27). d) Structure of UNC6261‐Biotin and UNC6261‐CT. e) Chemiprecipitation of full‐length CDYL from MDA‐MB‐231 cell lysates via UNC6261‐Biotin in the presence of UNC6261 and UNC7394. n = 2 biological replicates. f) CAPA analysis of UNC6261‐CT. Data are the mean ± SEM.
Figure 8
Figure 8
Suppressing peripheral CDYL activity by its antagonist reduces neuronal excitability and pain‐like behaviors. a) The RMP of DRG neurons treated with 10, 30, 100 µm UNC6261, 100 µm UNC7394 or vehicle for 24 h. One‐way ANOVA with Turkey's post‐hoc test, *p < 0.05 versus vehicle; # p < 0.05 versus UNC7394. b,c) Representative traces (b) and numbers (c) of APs induced by indicated currents. Scale bars, 100 ms and 30 mV. Two‐way ANOVA, group effect: *p < 0.05, **p < 0.01 versus vehicle; ## p < 0.01 versus UNC7394. d–f) The AP threshold (d), AHP amplitude (e), and rheobase (f) in DRG neurons. One‐way ANOVA with Turkey's post‐hoc test, *p < 0.05, **p < 0.01 versus vehicle; # p < 0.05, ## p < 0.01 versus UNC7394. g–i) The peak (g), amplitude (h), and half‐width (i) of AP in DRG neurons. One‐way ANOVA with Turkey's post‐hoc test, no statistical significance. n vehicle = 17, n UNC7394 = 18, n 10 µm UNC6261 = 17, n 30 µm UNC6261 = 19, n 100 µm UNC6261 = 18. j,k) Time course of PWT (j) and PWL (k) of mice after injection of 0.7 and 2.1 mg kg−1 UNC6261, 2.1 mg kg−1 UNC7394 or vehicle to DRG. Two‐way ANOVA with Sidak's post‐hoc test, *p < 0.05, **p < 0.01, ***p < 0.001 versus vehicle; ## p < 0.01, ### p < 0.001 versus UNC7394. l) Time course of PWT of SNI mice with injection of UNC6261, UNC7394 or vehicle. Two‐way ANOVA with Sidak's post‐hoc test, *p < 0.05, **p < 0.01 versus vehicle; # p < 0.05, ## p < 0.01 versus UNC7394. Data are the mean ± SEM.
Scheme 1
Scheme 1
Synthesis of UNC6261 and UNC7934.
Scheme 2
Scheme 2
Synthesis of UNC6261‐Biotin and UNC6261‐CT.

References

    1. Polli A., Godderis L., Ghosh M., Ickmans K., Nijs J., J. Pain 2019, 9, 1166.
    1. Liang L., Lutz B. M., Bekker A., Tao Y. X., Epigenomics 2015, 7, 235. - PMC - PubMed
    1. Chen C., Zhang J., Sun L., Zhang Y., Gan W. B., Tang P., Yang G., Nat. Commun. 2019, 10, 3087. - PMC - PubMed
    1. Liang L., Tao Y. X., Life Sci. 2018, 211, 182. - PubMed
    1. Zhang J., Rong L., Shao J., Zhang Y., Liu Y., Zhao S., Li L., Yu W., Zhang M., Ren X., Zhao Q., Zhu C., Luo H., Zang W., Cao J., J. Neurochem. 2020, 156, 367. - PubMed