. 2022 Feb 4;8(5):eabi9533.
doi: 10.1126/sciadv.abi9533. Epub 2022 Feb 4.

Loss of TSC1/TSC2 sensitizes immune checkpoint blockade in non-small cell lung cancer

Affiliations

Loss of TSC1/TSC2 sensitizes immune checkpoint blockade in non-small cell lung cancer

Qingyuan Huang et al. Sci Adv. .

Abstract

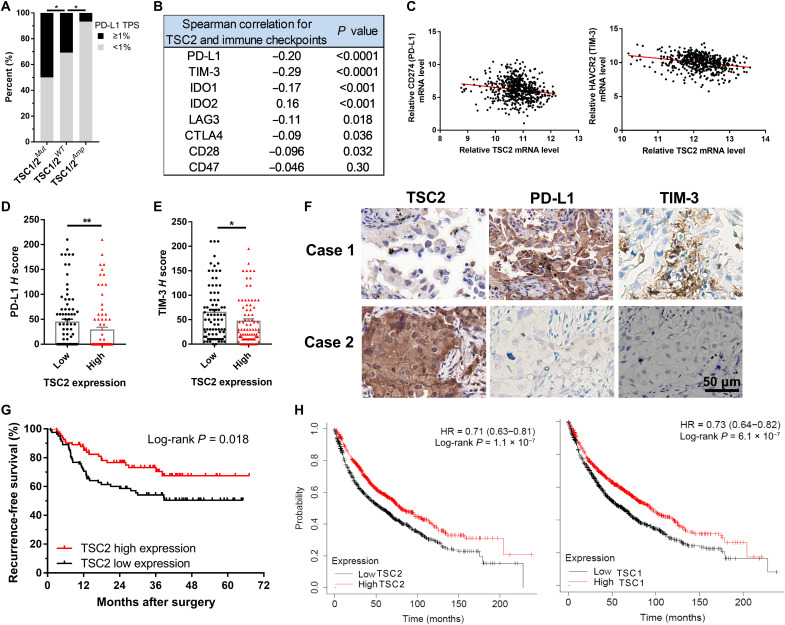
Tuberous sclerosis complex subunit 1 (TSC1) and 2 (TSC2) are frequently mutated in non-small cell lung cancer (NSCLC), however, their effects on antitumor immunity remained unexplored. A CRISPR screening in murine KrasG12D/Trp53-/- (KP) model identified Tsc1 and Tsc2 as potent regulators of programmed cell death ligand 1 (Pd-l1) expression in vitro and sensitivity to anti-programmed cell death receptor 1 (PD-1) treatment in vivo. TSC1 or TSC2 knockout (KO) promoted the transcriptional and membrane expression of PD-L1 in cell lines. TSC2-deficient tumors manifested an inflamed microenvironment in patient samples and The Cancer Genome Atlas dataset. In syngeneic murine models, KP-Tsc2-KO tumors showed notable response to anti-PD-1 antibody treatment, but Tsc2-wild-type tumors did not. Patients with TSC1/TSC2-mutant NSCLC receiving immune checkpoint blockade (ICB) had increased durable clinical benefit and survival. Collectively, TSC1/TSC2 loss defines a distinct subtype of NSCLC characterized as inflamed tumor microenvironment and superior sensitivity to ICB.


Figures

Fig. 1.
Fig. 1.. In vitro and in vivo CRISPR screening identified Tsc1/Tsc2 as candidates of immune modulators.
(A) Diagram of CRISPR screening system. ab, antibody. (B and C) In vitro screening in KP-Cas9 clone 7 (B) and KP-Cas9 clone 9 (C). The top 15% Pd-l1–high and the top 15% Pd-l1–low populations were sorted, and sgRNAs of Tsc2 and Tsc1 were enriched in Pd-l1–high population. Blue peak, cells transfected with empty vector; red peak, cell pools transfected with sgRNA library. (D) Relative reads number of Tsc2 and Tsc1 in the in vivo screening in KP-Cas9 clone 7. Twelve tumors from six mice were included in each group of the screen. *P < 0.05 and **P < 0.01. APC, allophycocyanin.
Fig. 2.
Fig. 2.. Tsc2-KO promoted PD-L1 expression in lung cancer cells.
(A) Membrane PD-L1 expression in KP-Cas9 cells transfected with sgRNA for Ctrl or Tsc2. (B) Membrane PD-L1 expression in clones of KP-Tsc2-KO cells in (A). (C) Membrane PD-L1 expression in clones of human A549-TSC2-KO cells. (D) Membrane PD-L1 expression in KP-Tsc2-KO cells transfected with vehicle or human TSC2 coding sequence (CDS). (E) Real-time PCR analyses of Pd-l1 mRNA level in KP-Cas9 cells transfected with sgRNA for Ctrl or Tsc2. (F) Membrane PD-L1 expression in KP-Cas9 cells transfected with sgRNA for Ctrl or Tsc1. (G) Tsc2-KO in KP-Ova cells significantly inhibited the cell-killing activity of OT-1 T cells in the in vitro killing assay, but the addition of anti–PD-1 antibody could not reverse this inhibition. (H) Flow cytometry showed that Tsc2-KO did not increase the membrane level of Ova and H-2 in the in vitro killing assay. Data are shown as means ± SEM. *P < 0.05, **P < 0.01, ***P < 0.001, and ****P < 0.0001. n.s., not significant; aPD-1, anti–PD-1 antibody.
Fig. 3.
Fig. 3.. Correlation of TSC2 with immune checkpoints in patient samples.
(A) Comparison of the PD-L1–positive (TPS ≥ 1%) rates of patients harboring TSC1/TSC2-mutant, TSC1/TSC2-WT, or TSC1/TSC2-amplificated tumors in the FUSCC NGS cohort. Fisher’s exact test. (B) Summary of Spearman correlations between TSC2 and immune checkpoints mRNA levels in TCGA dataset. (C) Spearman correlations between TSC2 and PD-L1 and TIM-3 mRNA levels in (B). (D and E) Correlations between TSC2 and PD-L1 (D) and TIM-3 (E) expression level assessed by H score of immunostaining in FUSCC TMA cohort. Data are shown as means ± SEM. (F) Representative images of immunohistochemistry (IHC) for TSC2, PD-L1, and TIM-3 in (D) and (E). (G) RFS stratified by TSC2 protein expression level in the FUSCC TMA cohort. (H) Association of TSC2 (215735_s_at) and TSC1 (209390_at) mRNA levels with overall survival (OS) in NSCLC datasets from the KM plotter. *P < 0.05 and **P < 0.01. IDO, Indoleamine 2,3-dioxigenase; LAG3, lymphocyte-Activation Gene 3; CTLA4, cytotoxic T-lymphocyte associated protein 4; HAVCR2, hepatitis A virus cellular receptor 2; HR, hazard ratio.
Fig. 4.
Fig. 4.. TSC2 loss reprogrammed TME.
(A) Correlation between TSC2 level and immune filtrates. Data were derived from TIMER 2.0 (http://timer.comp-genomics.org/). Yellow highlight indicates statistical significance. Treg, regulatory T cell; NK, natural killer; TH2, T helper cell 2; DC, dendritic cell. (B) Correlation between TSC2 mRNA level and CD8+ T cell by MCP-COUNTER in (A). (C) Correlations between TSC2 and CD8A expression level assessed by H score of immunostaining in FUSCC TMA cohort. Data are shown as means ± SEM. (D) Representative images of CD8A in (C). (E) Summary of correlation between TSC2 and T cell activation markers level in TCGA dataset. (F) Comparison of immune phenotypes classified on the basis of PD-L1 and CD8A level by TSC2 level in TCGA dataset. (G) Bar graphs comparing the CD8+/CD3+ ratio and PD-1 MFI in CD8+ T cells in KP syngeneic murine models (n = 4 for each group). (H) Bar graphs comparing the CD8+/CD3+ ratio and PD-1 MFI in CD8+ T cells in patients with NSCLC (TSC1/TSC2-mutant, n = 5; TSC1/TSC2-WT, n = 15). (I) Bar graphs comparing the apoptosis rate and Ki-67 MFI in CD8+ T cells in KP syngeneic murine models. (J) Bar graphs comparing Ki-67 MFI in CD8+ T cells in patients with NSCLC. (K) Higher mutational load and predicted neoantigen burden of TSC1/TSC2-mutant patients in TCGA and Hellmann’s datasets. Box and whisker plots indicate median and 95% confidence interval. *P < 0.05 and **P < 0.01. TPM, transcripts per million.
Fig. 5.
Fig. 5.. TSC1/TSC2-loss lung cancer benefits from ICB in syngeneic murine model and patients.
(A) Anti–PD-1 antibody treatment in KP ctrl or KP-Tsc2-KO allograft tumors in subcutaneous injection model. Data are shown as means ± SEM and compared by repeated-measures analysis of variance (ANOVA). (B) Water fall plot showing tumor volume changes in response to treatment in (A). Each bar represents one tumor. (C) Tumor volumes at the treatment endpoint in (A). Data are shown as means ± SEM. (D and E) TSC1/TSC2 mutation was associated with higher durable clinical benefit (DCB) rate (D) and progression-free survival (PFS) (E) in 75 patients with NSCLC receiving immunotherapy. NDB, no durable benefit. (F) Individual PFS of 75 patients with NSCLC coupled with their clinical benefit, gender, smoking status, histology, TMB, and neoantigen burden in each patient. (G) Computed tomography (CT) images of a patient with recurrent TSC1-mutant lung adenocarcinoma before and after treatment with pembrolizumab and chemotherapy. q3W, every 3 weeks. *P < 0.05.

References

    1. Rizvi H., Sanchez-Vega F., la K., Chatila W., Jonsson P., Halpenny D., Plodkowski A., Long N., Sauter J. L., Rekhtman N., Hollmann T., Schalper K. A., Gainor J. F., Shen R., Ni A., Arbour K. C., Merghoub T., Wolchok J., Snyder A., Chaft J. E., Kris M. G., Rudin C. M., Socci N. D., Berger M. F., Taylor B. S., Zehir A., Solit D. B., Arcila M. E., Ladanyi M., Riely G. J., Schultz N., Hellmann M. D., Molecular determinants of response to anti-programmed cell death (PD)-1 and anti-programmed death-ligand 1 (PD-L1) blockade in patients with non-small-cell lung cancer profiled with targeted next-generation sequencing. J. Clin. Oncol. 36, 633–641 (2018). - PMC - PubMed
    1. Huang Q., Zhang H., Hai J., Socinski M. A., Lim E., Chen H., Stebbing J., Impact of PD-L1 expression, driver mutations and clinical characteristics on survival after anti-PD-1/PD-L1 immunotherapy versus chemotherapy in non-small-cell lung cancer: A meta-analysis of randomized trials. Onco. Targets. Ther. 7, e1396403 (2018). - PMC - PubMed
    1. Coelho M. A., de Carné Trécesson S., Rana S., Zecchin D., Moore C., Molina-Arcas M., East P., Spencer-Dene B., Nye E., Barnouin K., Snijders A. P., Lai W. S., Blackshear P. J., Downward J., Oncogenic RAS signaling promotes tumor immunoresistance by stabilizing PD-L1 mRNA. Immunity 47, 1083–1099.e6 (2017). - PMC - PubMed
    1. Cortez M. A., Ivan C., Valdecanas D., Wang X., Peltier H. J., Ye Y., Araujo L., Carbone D. P., Shilo K., Giri D. K., Kelnar K., Martin D., Komaki R., Gomez D. R., Krishnan S., Calin G. A., Bader A. G., Welsh J. W., PDL1 regulation by p53 via miR-34. J. Natl. Cancer Inst. 108, (2016). - PMC - PubMed
    1. Akbay E. A., Koyama S., Carretero J., Altabef A., Tchaicha J. H., Christensen C. L., Mikse O. R., Cherniack A. D., Beauchamp E. M., Pugh T. J., Wilkerson M. D., Fecci P. E., Butaney M., Reibel J. B., Soucheray M., Cohoon T. J., Janne P. A., Meyerson M., Hayes D. N., Shapiro G. I., Shimamura T., Sholl L. M., Rodig S. J., Freeman G. J., Hammerman P. S., Dranoff G., Wong K. K., Activation of the PD-1 pathway contributes to immune escape in EGFR-driven lung tumors. Cancer Discov. 3, 1355–1363 (2013). - PMC - PubMed

Publication types

MeSH terms

Supplementary concepts