. 2022 Feb 4;8(5):eabj9309.
doi: 10.1126/sciadv.abj9309. Epub 2022 Feb 4.

Patterns of eukaryotic diversity from the surface to the deep-ocean sediment

Affiliations

Patterns of eukaryotic diversity from the surface to the deep-ocean sediment

Tristan Cordier et al. Sci Adv. .

Abstract

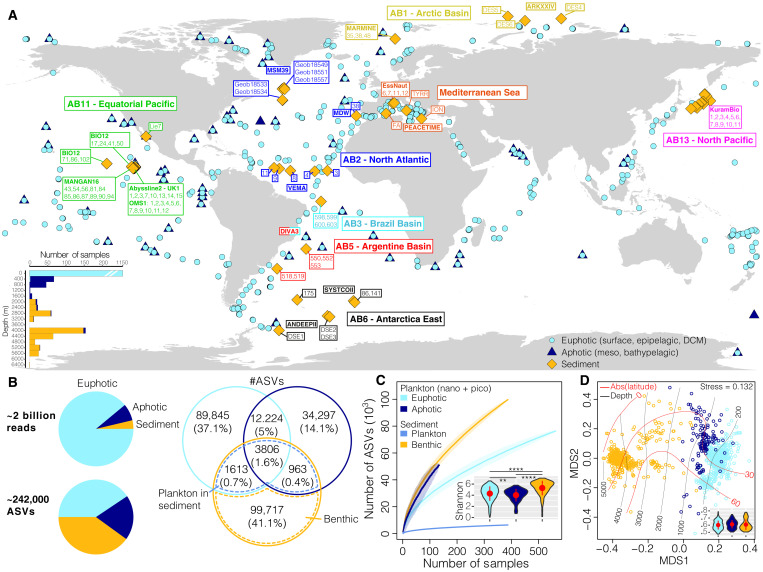
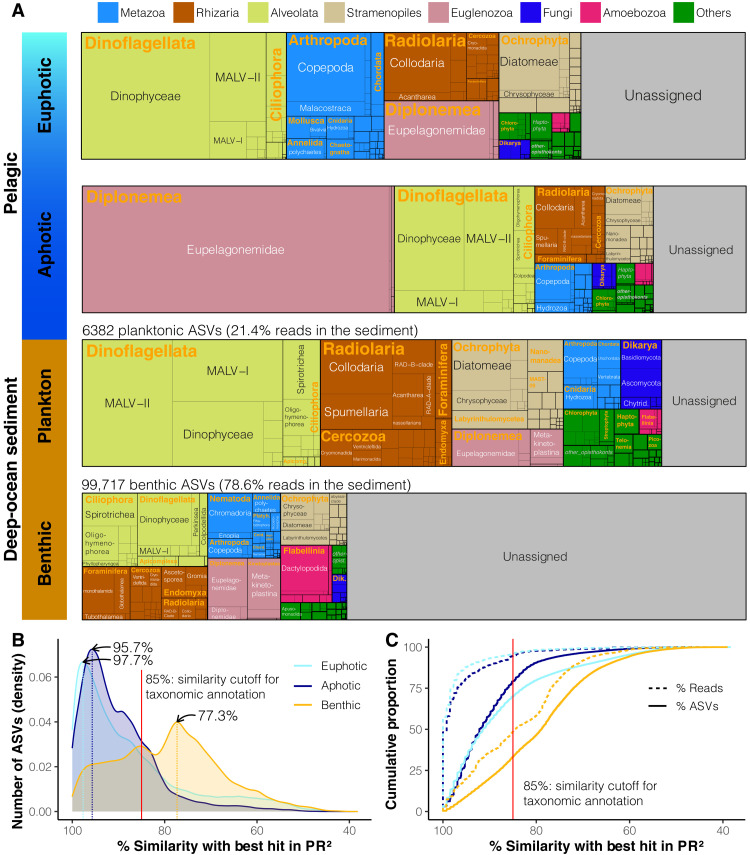
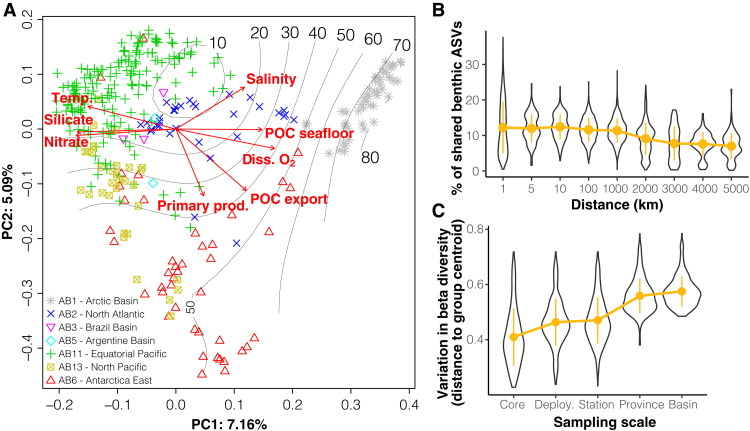
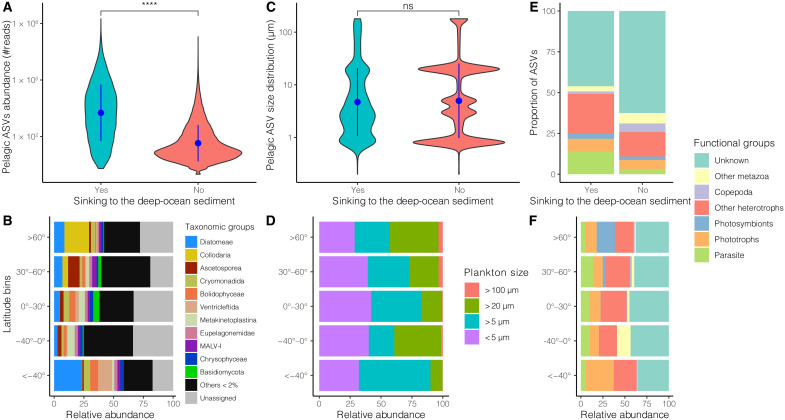
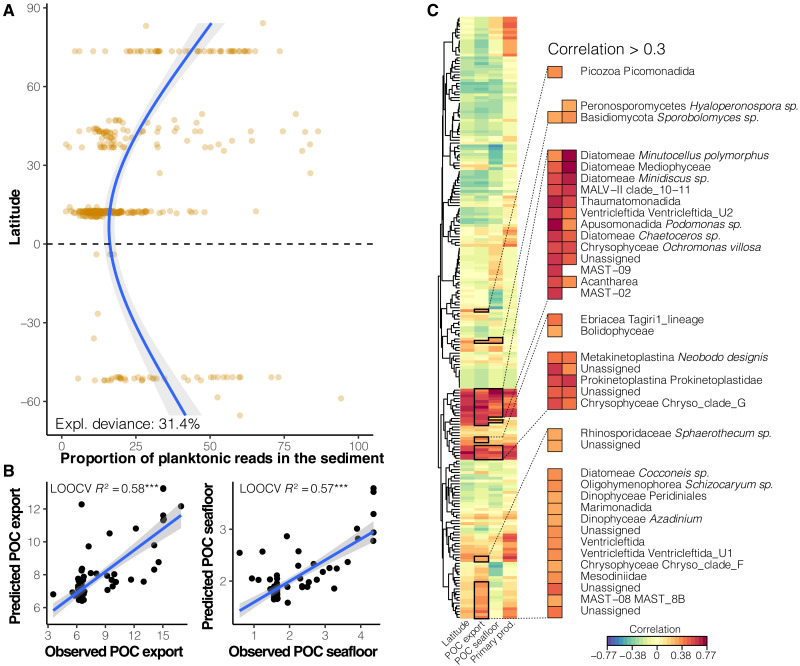
Remote deep-ocean sediment (DOS) ecosystems are among the least explored biomes on Earth. Genomic assessments of their biodiversity have failed to separate indigenous benthic organisms from sinking plankton. Here, we compare global-scale eukaryotic DNA metabarcoding datasets (18S-V9) from abyssal and lower bathyal surficial sediments and euphotic and aphotic ocean pelagic layers to distinguish plankton from benthic diversity in sediment material. Based on 1685 samples collected throughout the world ocean, we show that DOS diversity is at least threefold that in pelagic realms, with nearly two-thirds represented by abundant yet unknown eukaryotes. These benthic communities are spatially structured by ocean basins and particulate organic carbon (POC) flux from the upper ocean. Plankton DNA reaching the DOS originates from abundant species, with maximal deposition at high latitudes. Its seafloor DNA signature predicts variations in POC export from the surface and reveals previously overlooked taxa that may drive the biological carbon pump.


Figures

Fig. 1.
Fig. 1.. Eukaryotic ribosomal DNA diversity in the pelagic euphotic and aphotic zones and in the deep-ocean surficial sediment.
(A) Location of the stations (n = 447) from which the samples (n = 1685) analyzed in this study were collected. The color of the sediment sampling station tags indicates approximate correspondence with abyssal provinces (42), and the names of deep-sea cruises are indicated in bold or within text boxes. The bottom left inset represents the depth distribution (in meters) of the samples. (B) Number of eukaryotic 18S V9 rDNA reads and of amplicon sequence variants (ASVs). A Venn diagram represents the distribution of ASV richness and their proportions within and across realms. The intersection of the pelagic and sediment datasets is used here to separate the indigenous benthic organisms from the sinking plankton (see Materials and Methods). (C) ASV accumulation curves as a function of sampling effort. For pelagic realms, we calculated the curves by focusing only on the nano- and picoplanktonic size fractions (see Materials and Methods). The inset displays the distribution of Shannon diversity for pelagic and benthic communities. The red dots and bars within violin plots represent means and SDs, and horizontal bars indicate significant differences (Wilcoxon tests, **P < 0.01 and ****P < 0.0001). (D) Nonmetric multidimensional scaling (NMDS) analysis of the Bray-Curtis dissimilarity matrix computed from the pelagic (only the nano- and pico-fractions) and sediment datasets. The red and black lines on the ordination represent, respectively, the absolute latitude and depth as fitted surfaces to the ordination. The inset represents the community dispersion within each realm (i.e., Bray-Curtis distances to the group centroid, higher values indicate more compositional variation). The red dots and bars within violin plots represent means and SDs, respectively, and no significant differences between realms were detected (Wilcoxon tests, P > 0.05).
Fig. 2.
Fig. 2.. Taxonomic composition of eukaryotes (ASV richness) in the pelagic euphotic, pelagic aphotic, and DOS (sinking plankton and benthic communities) realms.
(A) ASV richness of eukaryotic groups (see fig. S4 for relative abundances and table S3 for details). The number of ASVs and their relative abundance in the sediment are shown for ASVs of pelagic origin, as well as those derived from indigenous benthic taxa. (B) Number of ASVs (represented as density) as a function of their similarity with the best hit with a reference sequence in the PR2 database. The peaks in density for each realm are highlighted on the plot, and the corresponding similarity level with reference sequences is indicated. (C) Cumulative proportion of ASVs and read abundance as a function of their similarity with the best hit with a reference sequence in PR2. The red vertical lines indicate the similarity cutoff (85%) for taxonomic annotation used in this study.
Fig. 3.
Fig. 3.. Biogeography of the deep-ocean benthic eukaryotic communities.
(A) Principal coordinates analysis of the Bray-Curtis dissimilarity matrix computed from the normalized read counts of indigenous benthic ASVs using the cumulative sum scaling (CSS) method. The proportion of variance explained by the first two axes is indicated on the plot. The gray lines and numbers indicate the absolute latitude as a fitted smooth surface on the ordination, and the red arrows are fitted seafloor (temp.: temperature; diss. O2: dissolved oxygen; seabed salinity, silicate and nitrate concentrations, and POC reaching the seafloor) or surface water (primary prod.: primary productivity, POC export from the surface) environmental parameters to the ordination. Colors and symbols indicate location of sampling sites in the abyssal biogeographic provinces (AB1 to AB13) postulated by (42). (B) Proportion of shared benthic ASVs as a function of increasing distance between pairs of samples. The proportion of shared ASVs was computed only within the same oceanic basins. (C) Variation in b diversity, i.e., distribution of sample distances to group centroids, as a function of increasing spatial sampling scale. Higher values indicate higher compositional variation. Orange dots and bars represent means and standard deviations (SDs), respectively.
Fig. 4.
Fig. 4.. Abundance and functional attributes of the sinking plankton compared to their nonsinking counterparts and the taxonomic and functional abundance breakdown of plankton DNA in DOSs.
Comparison of the DNA-based log-transformed read abundance (A), the inferred size distribution (C), and the functional breakdown (E) of pelagic ASV sinking to the DOS with their nonsinking counterparts in pelagic realms (euphotic and aphotic datasets have been combined). Results of Wilcoxon tests in (A) and (C) are indicated as follows: ****P < 0.0001; not significant (ns), P > 0.05. Breakdown of taxonomic (B), inferred size classes (D), and functional (F) relative abundances of plankton DNA in DOS as a function of latitudinal bins.
Fig. 5.
Fig. 5.. Plankton DNA proportion in the DOS as a function of latitude and planktonic taxa in sediment associated with POC export from the surface and its fraction reaching the seafloor.
(A) Proportion of DNA reads in DOSs representing sinking planktonic taxa as a function of latitude. The blue solid line represents a fitted generalized additive model (s = 3); the shades are displaying 95% confidence intervals. The explained variation of plankton DNA proportion in sediment is indicated on the plot. (B) Prediction of POC export and POC reaching the seafloor from the composition of plankton DNA in the DOS (POC export and POC seafloor are expressed in g Corg/m2 per year). Random forest regressions were used in a leave-one-out cross validation (LOOCV) approach at the station scale. Correlation coefficients of linear models are reported on the plots. Blue lines represent linear models (both with P < 0.001), and shades represent 95% confidence intervals. (C) Planktonic ASVs in sediment associated with the POC export and POC reaching the seafloor were identified with a sparse partial least square regression. Planktonic ASVs strongly associated (correlation > 0.3) with POC export and POC reaching the seafloor are detailed on the clustered heatmap (details in table S6).

References

    1. Thurber A. R., Sweetman A. K., Narayanaswamy B. E., Jones D. O. B., Ingels J., Hansman R. L., Ecosystem function and services provided by the deep sea. Biogeosciences 11, 3941–3963 (2014).
    1. Levin L. A., Le Bris N., The deep ocean under climate change. Science 350, 766–768 (2015). - PubMed
    1. Breitburg D., Levin L. A., Oschlies A., Grégoire M., Chavez F. P., Conley D. J., Garçon V., Gilbert D., Gutiérrez D., Isensee K., Jacinto G. S., Limburg K. E., Montes I., Naqvi S. W. A., Pitcher G. C., Rabalais N. N., Roman M. R., Rose K. A., Seibel B. A., Telszewski M., Yasuhara M., Zhang J., Declining oxygen in the global ocean and coastal waters. Science 359, eaam7240 (2018). - PubMed
    1. Smith C. R., Tunnicliffe V., Colaço A., Drazen J. C., Gollner S., Levin L. A., Mestre N. C., Metaxas A., Molodtsova T. N., Morato T., Sweetman A. K., Washburn T., Amon D. J., Deep-sea misconceptions cause underestimation of seabed-mining impacts. Trends Ecol. Evol. 35, 853–857 (2020). - PubMed
    1. Pusceddu A., Bianchelli S., Martín J., Puig P., Palanques A., Masqué P., Danovaro R., Chronic and intensive bottom trawling impairs deep-sea biodiversity and ecosystem functioning. Proc. Natl. Acad. Sci. U.S.A. 111, 8861–8866 (2014). - PMC - PubMed