. 2022 Apr 16;399(10334):1489-1512.
doi: 10.1016/S0140-6736(22)00172-6. Epub 2022 Feb 1.

Pandemic preparedness and COVID-19: an exploratory analysis of infection and fatality rates, and contextual factors associated with preparedness in 177 countries, from Jan 1, 2020, to Sept 30, 2021

Collaborators

Pandemic preparedness and COVID-19: an exploratory analysis of infection and fatality rates, and contextual factors associated with preparedness in 177 countries, from Jan 1, 2020, to Sept 30, 2021

COVID-19 National Preparedness Collaborators. Lancet. .

Abstract

Background: National rates of COVID-19 infection and fatality have varied dramatically since the onset of the pandemic. Understanding the conditions associated with this cross-country variation is essential to guiding investment in more effective preparedness and response for future pandemics.

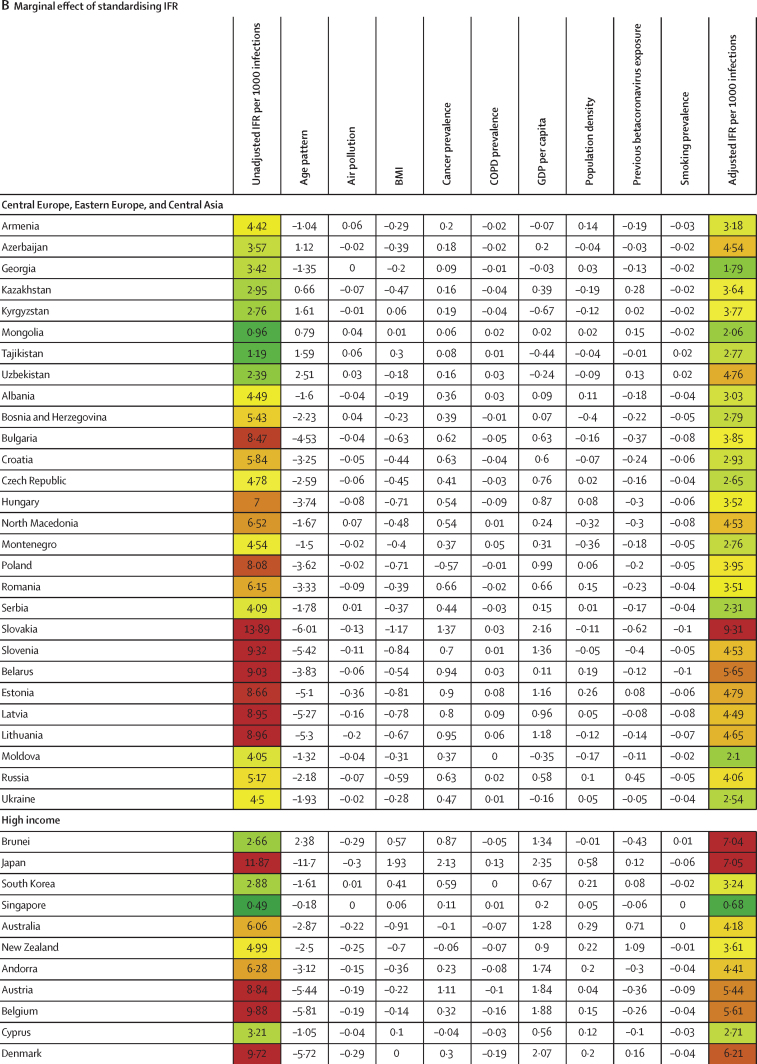
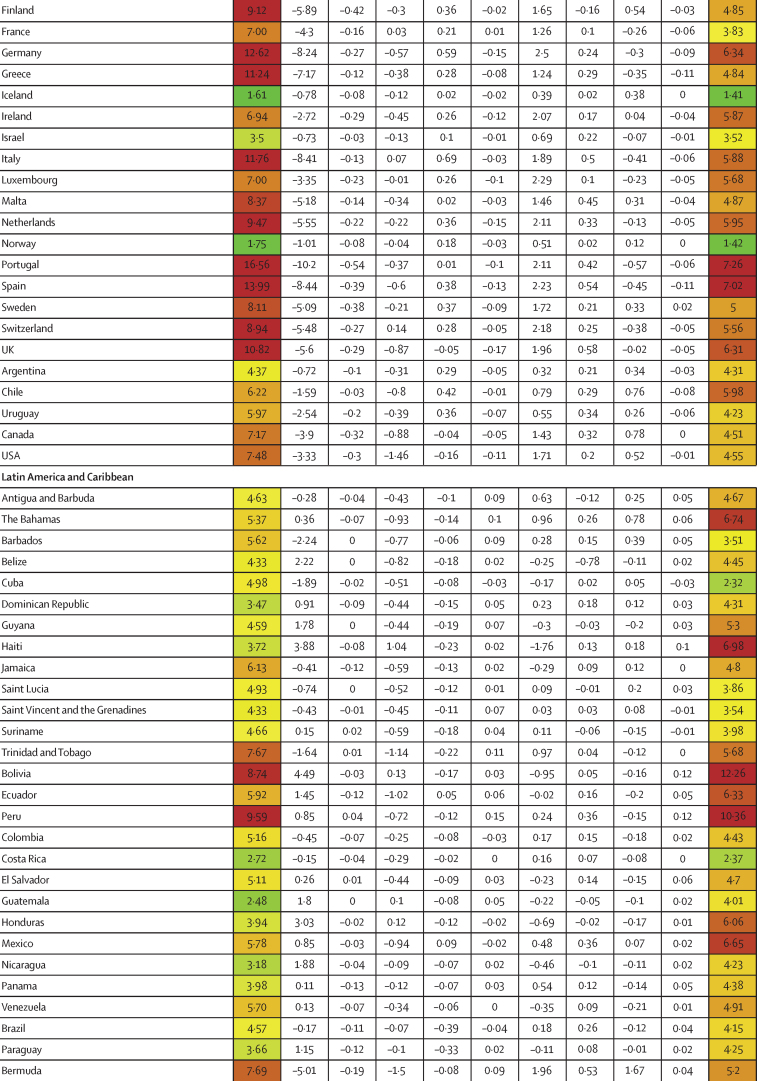
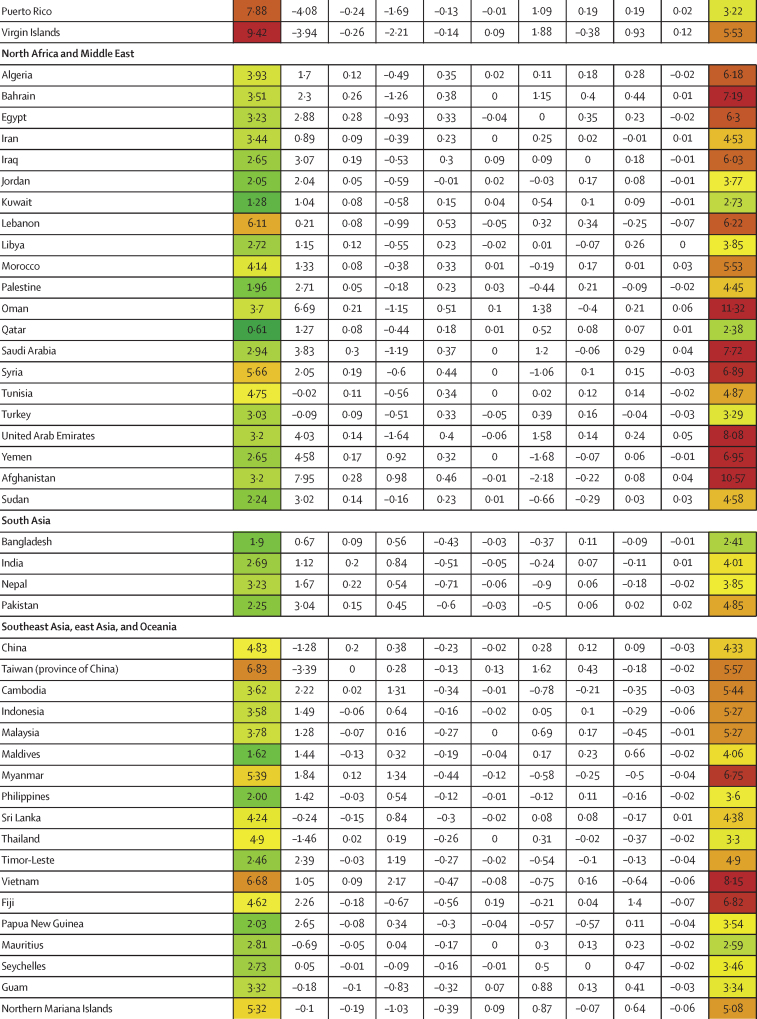
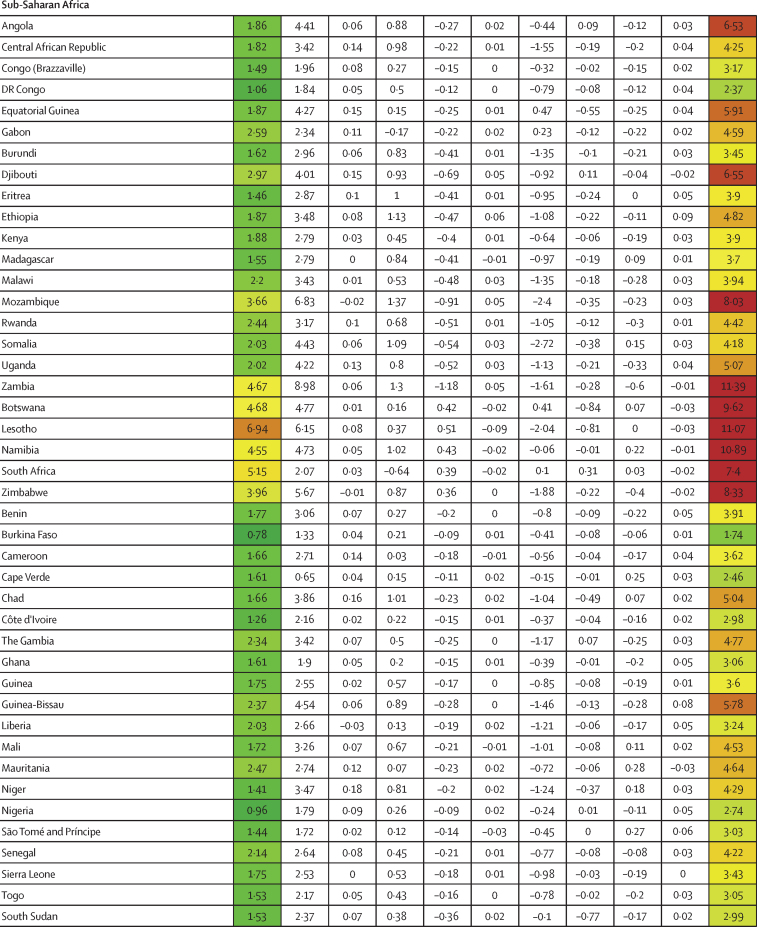
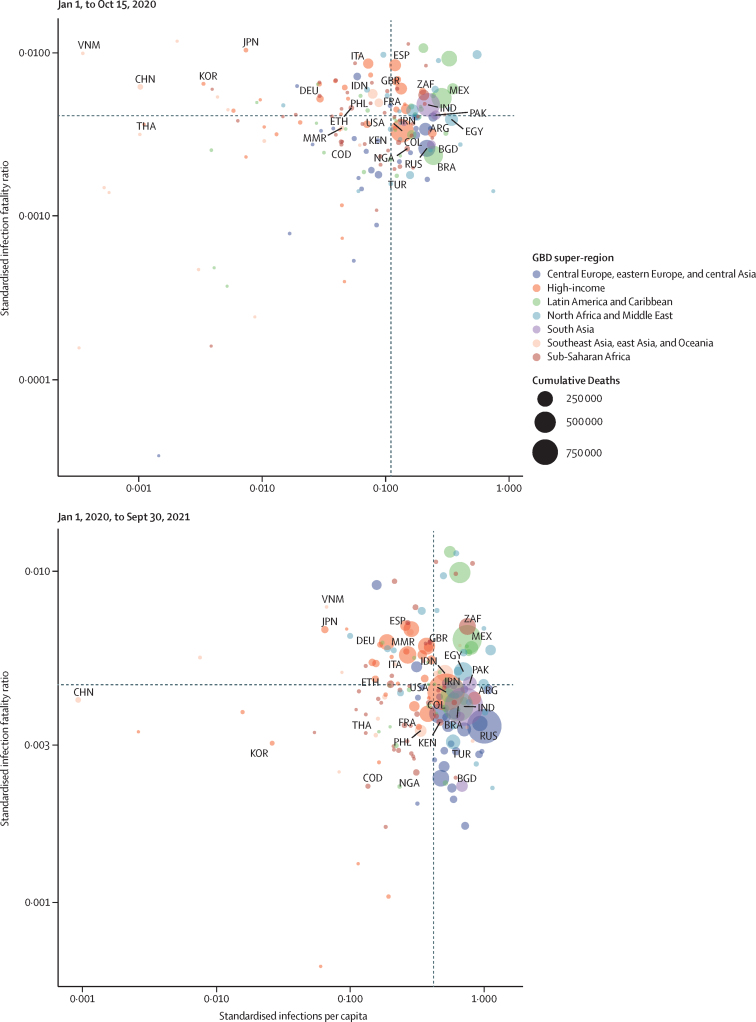
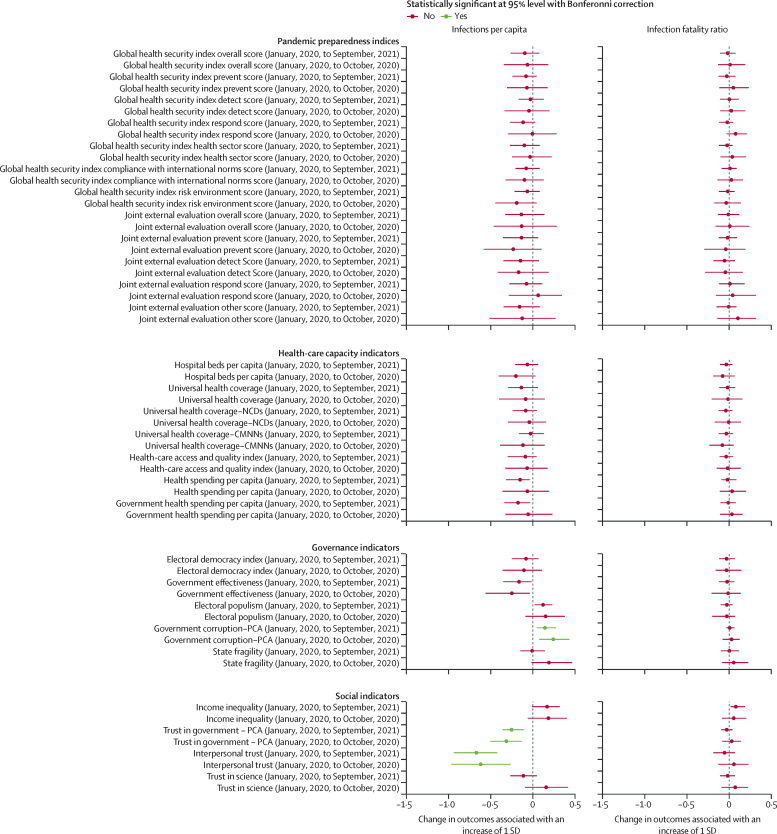
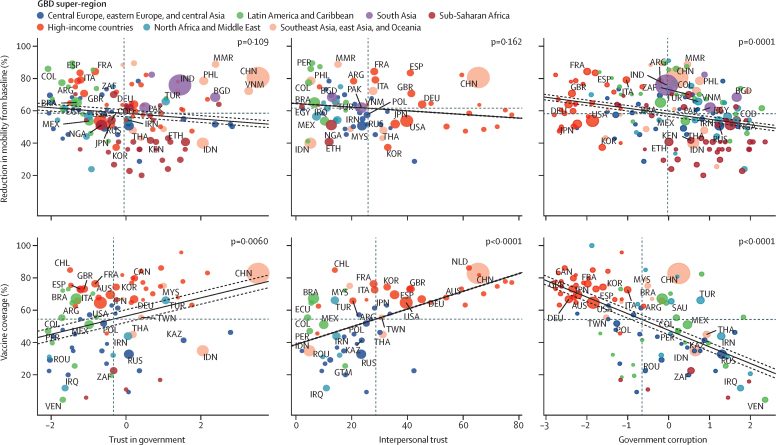
Methods: Daily SARS-CoV-2 infections and COVID-19 deaths for 177 countries and territories and 181 subnational locations were extracted from the Institute for Health Metrics and Evaluation's modelling database. Cumulative infection rate and infection-fatality ratio (IFR) were estimated and standardised for environmental, demographic, biological, and economic factors. For infections, we included factors associated with environmental seasonality (measured as the relative risk of pneumonia), population density, gross domestic product (GDP) per capita, proportion of the population living below 100 m, and a proxy for previous exposure to other betacoronaviruses. For IFR, factors were age distribution of the population, mean body-mass index (BMI), exposure to air pollution, smoking rates, the proxy for previous exposure to other betacoronaviruses, population density, age-standardised prevalence of chronic obstructive pulmonary disease and cancer, and GDP per capita. These were standardised using indirect age standardisation and multivariate linear models. Standardised national cumulative infection rates and IFRs were tested for associations with 12 pandemic preparedness indices, seven health-care capacity indicators, and ten other demographic, social, and political conditions using linear regression. To investigate pathways by which important factors might affect infections with SARS-CoV-2, we also assessed the relationship between interpersonal and governmental trust and corruption and changes in mobility patterns and COVID-19 vaccination rates.

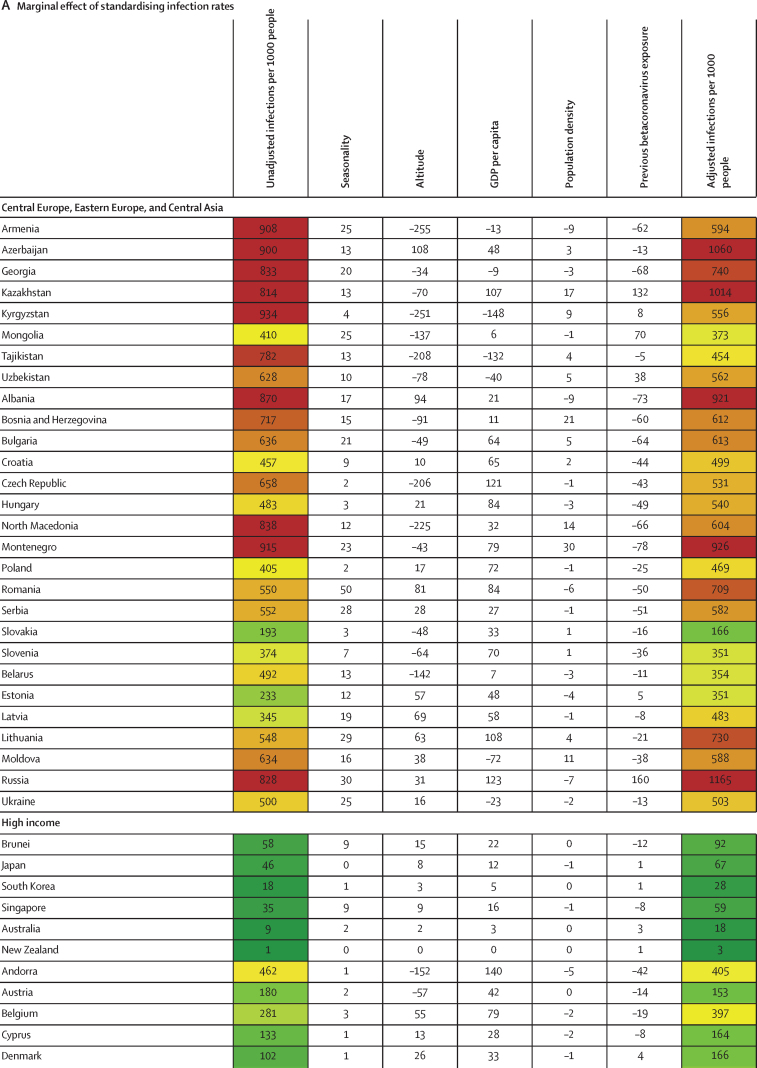
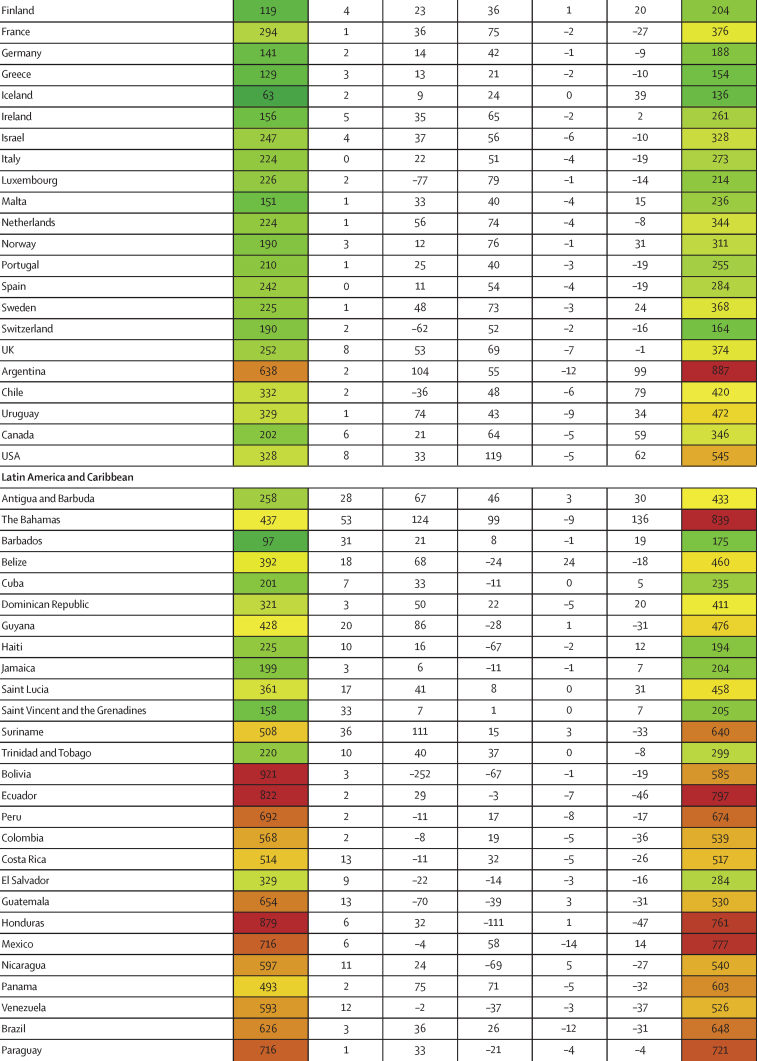
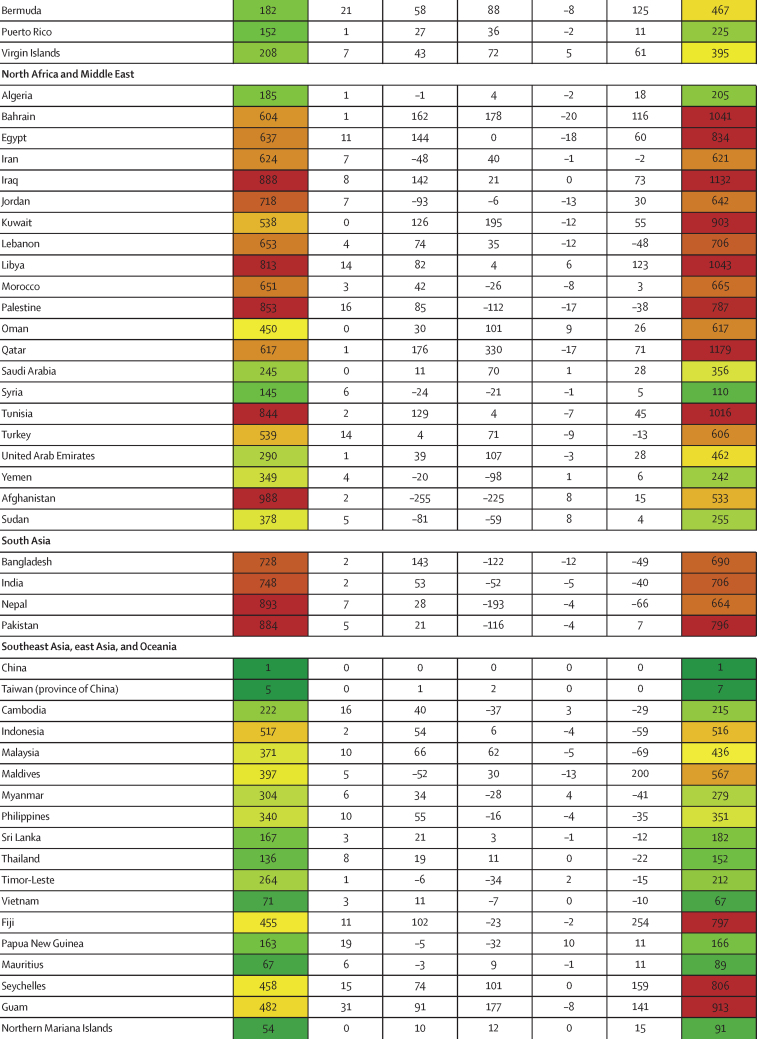
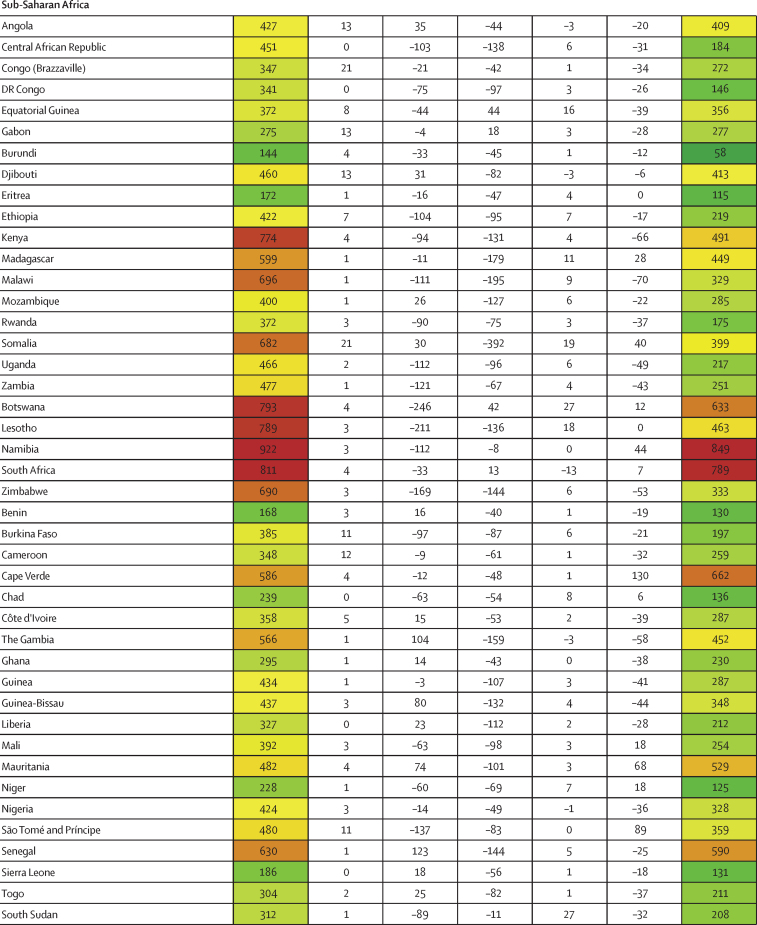
Findings: The factors that explained the most variation in cumulative rates of SARS-CoV-2 infection between Jan 1, 2020, and Sept 30, 2021, included the proportion of the population living below 100 m (5·4% [4·0-7·9] of variation), GDP per capita (4·2% [1·8-6·6] of variation), and the proportion of infections attributable to seasonality (2·1% [95% uncertainty interval 1·7-2·7] of variation). Most cross-country variation in cumulative infection rates could not be explained. The factors that explained the most variation in COVID-19 IFR over the same period were the age profile of the country (46·7% [18·4-67·6] of variation), GDP per capita (3·1% [0·3-8·6] of variation), and national mean BMI (1·1% [0·2-2·6] of variation). 44·4% (29·2-61·7) of cross-national variation in IFR could not be explained. Pandemic-preparedness indices, which aim to measure health security capacity, were not meaningfully associated with standardised infection rates or IFRs. Measures of trust in the government and interpersonal trust, as well as less government corruption, had larger, statistically significant associations with lower standardised infection rates. High levels of government and interpersonal trust, as well as less government corruption, were also associated with higher COVID-19 vaccine coverage among middle-income and high-income countries where vaccine availability was more widespread, and lower corruption was associated with greater reductions in mobility. If these modelled associations were to be causal, an increase in trust of governments such that all countries had societies that attained at least the amount of trust in government or interpersonal trust measured in Denmark, which is in the 75th percentile across these spectrums, might have reduced global infections by 12·9% (5·7-17·8) for government trust and 40·3% (24·3-51·4) for interpersonal trust. Similarly, if all countries had a national BMI equal to or less than that of the 25th percentile, our analysis suggests global standardised IFR would be reduced by 11·1%.

Interpretation: Efforts to improve pandemic preparedness and response for the next pandemic might benefit from greater investment in risk communication and community engagement strategies to boost the confidence that individuals have in public health guidance. Our results suggest that increasing health promotion for key modifiable risks is associated with a reduction of fatalities in such a scenario.

Funding: Bill & Melinda Gates Foundation, J Stanton, T Gillespie, J and E Nordstrom, and Bloomberg Philanthropies.


Figures

Figure 1
Figure 1
Decomposition of difference in standardised cumulative SARS-CoV-2 infections per capita and IFR (A) Decomposition of the difference between cumulative and standardised cumulative SARS-CoV-2 infections per capita. The first column represents the number of unadjusted infections per capita, and each subsequent column represents the change in adjusted cumulative infections per capita that can be accounted for by seasonality, altitude, GDP per capita, population density, and a proxy for pre-exposure to betacoronavirus; the last column represents the adjusted infections per capita. The infections per capita metrics are colour-coded based on their severity relative to all other countries, with red representing higher cumulative infections per capita and green representing lower cumulative infections per capita (unadjusted and adjusted). (B) Decomposition of the difference between IFR and standardised IFR. The first column represents the raw IFR, and each subsequent column represents the proportion of IFR that can be accounted for by age structure, air pollution, BMI, cancer prevalence, COPD prevalence, GDP per capita, population density, a proxy for pre-exposure to betacoronavirus, and smoking prevalence; the last column represents the adjusted IFR. The IFR metrics are colour-coded based on their severity relative to all other countries, with red representing higher IFR and green representing IFR (raw and adjusted). BMI=body-mass index. COPD=chronic obstructive pulmonary disease. GDP=gross domestic product. IFR=infection-fatality ratio.
Figure 1
Figure 1
Decomposition of difference in standardised cumulative SARS-CoV-2 infections per capita and IFR (A) Decomposition of the difference between cumulative and standardised cumulative SARS-CoV-2 infections per capita. The first column represents the number of unadjusted infections per capita, and each subsequent column represents the change in adjusted cumulative infections per capita that can be accounted for by seasonality, altitude, GDP per capita, population density, and a proxy for pre-exposure to betacoronavirus; the last column represents the adjusted infections per capita. The infections per capita metrics are colour-coded based on their severity relative to all other countries, with red representing higher cumulative infections per capita and green representing lower cumulative infections per capita (unadjusted and adjusted). (B) Decomposition of the difference between IFR and standardised IFR. The first column represents the raw IFR, and each subsequent column represents the proportion of IFR that can be accounted for by age structure, air pollution, BMI, cancer prevalence, COPD prevalence, GDP per capita, population density, a proxy for pre-exposure to betacoronavirus, and smoking prevalence; the last column represents the adjusted IFR. The IFR metrics are colour-coded based on their severity relative to all other countries, with red representing higher IFR and green representing IFR (raw and adjusted). BMI=body-mass index. COPD=chronic obstructive pulmonary disease. GDP=gross domestic product. IFR=infection-fatality ratio.
Figure 2
Figure 2
Standardised infections per capita and standardised infection-fatality ratios The top panel shows the relationship between adjusted infections per capita and adjusted infection-fatality ratios from Jan 1, 2020, to Sept 30, 2021. The bottom panel shows the relationship between adjusted infections per capita and adjusted infection-fatality ratios from Jan 1, 2020, to Oct 15, 2020. The size of each circle represents the magnitude of cumulative deaths. ARG=Argentina. BGD=Bangladesh. BRA=Brazil. CHN=China. COD=Democratic Republic of the Congo. COL=Colombia. DEU=Germany. EGY=Egypt. ESP=Spain. ETH=Ethiopia. FRA=France. GBD=Global Burden of Diseases, Injuries, and Risk Factors Study. GBR=UK. IDN=Indonesia. IND=India. IRN=Iran. ITA=Italy. JPN=Japan. KEN=Kenya. KOR=South Korea. MEX=Mexico. MMR=Myanmar. NGA=Nigeria. PAK=Pakistan. PHL=Philippines. RUS=Russian Federation. THA=Thailand. TUR=Turkey. USA=United States of America. VNM=Vietnam. ZAF=South Africa.
Figure 3
Figure 3
Associations between key preparedness, capacity, governance, and social indicators and infection rates and IFR The left column shows estimated associations between indicators of key contextual factors (pandemic preparedness indices, health-care capacity indicators, governance indicators, and social indicators) and infections per capita. The right column shows estimated associations between key contextual factors and the infection-fatality ratio. Red indicates the association is not significant and green indicates the association is significant at a 95% CI with a Bonferroni correction. CMNN=communicable, maternal, neonatal, and nutritional disease. IFR=infection-fatality ratio. NCD=non-communicable disease. PCA=principal component analysis.
Figure 4
Figure 4
Association between trust and government corruption, and vaccine coverage and change in mobility The size of each circle represents total population. The solid line represents the fit of the linear regression for the two variables, and dotted lines represent the 95% CI. GBD=Global Burden of Diseases, Injuries, and Risk Factors Study.

References

    1. The Independent Panel for Pandemic Preparedness and Response COVID-19: make it the last pandemic. May 2021. https://recommendations.theindependentpanel.org/main-report/main-report/ - PMC - PubMed
    1. Stolberg SG. As pandemic recedes in US, calls are growing for an investigative commission. The New York Times. June 16, 2021
    1. Bollyky TJ, Patrick SM. Improving pandemic preparedness: lessons from COVID-19. Council on Foreign Relations. October, 2020. https://www.cfr.org/report/pandemic-preparedness-lessons-COVID-19/
    1. Ravi SJ, Warmbrod KL, Mullen L, et al. The value proposition of the Global Health Security Index. BMJ Glob Health. 2020;5 - PMC - PubMed
    1. Razavi A, Erondu N, Okereke E. The Global Health Security Index: what value does it add? BMJ Glob Health. 2020;5 - PMC - PubMed

Publication types

Substances