. 2022 Apr 6;30(4):1432-1450.
doi: 10.1016/j.ymthe.2022.01.037. Epub 2022 Feb 2.

Fluoxetine ameliorates mucopolysaccharidosis type IIIA

Affiliations

Fluoxetine ameliorates mucopolysaccharidosis type IIIA

Antonella Capuozzo et al. Mol Ther. .

Abstract

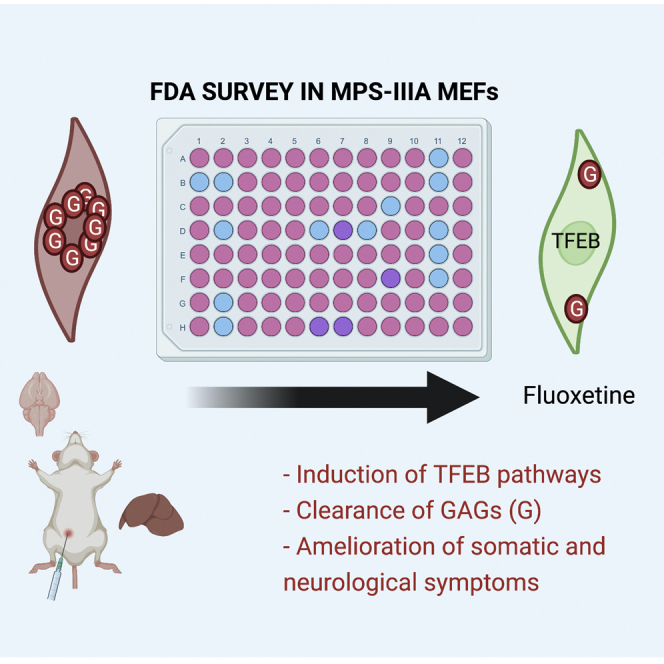
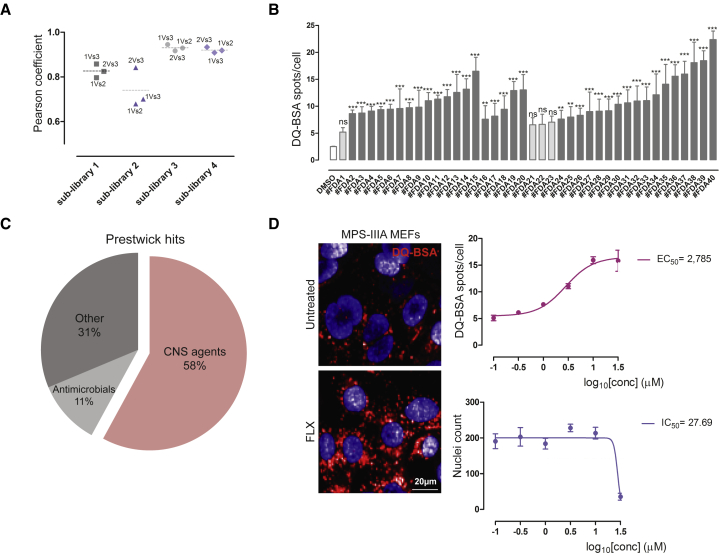
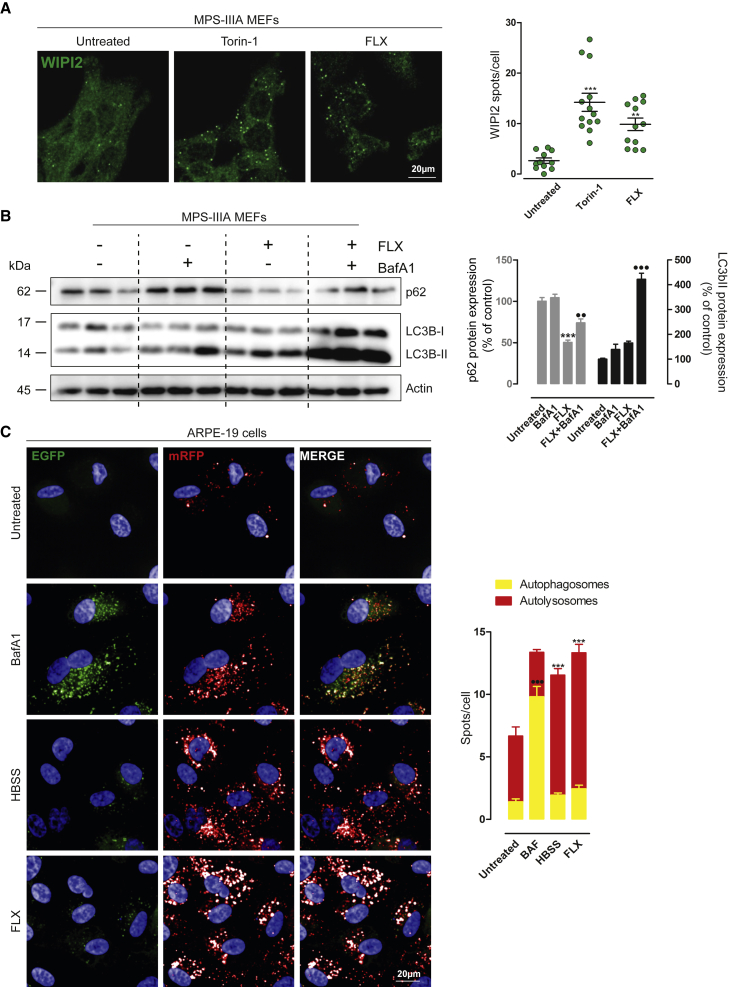
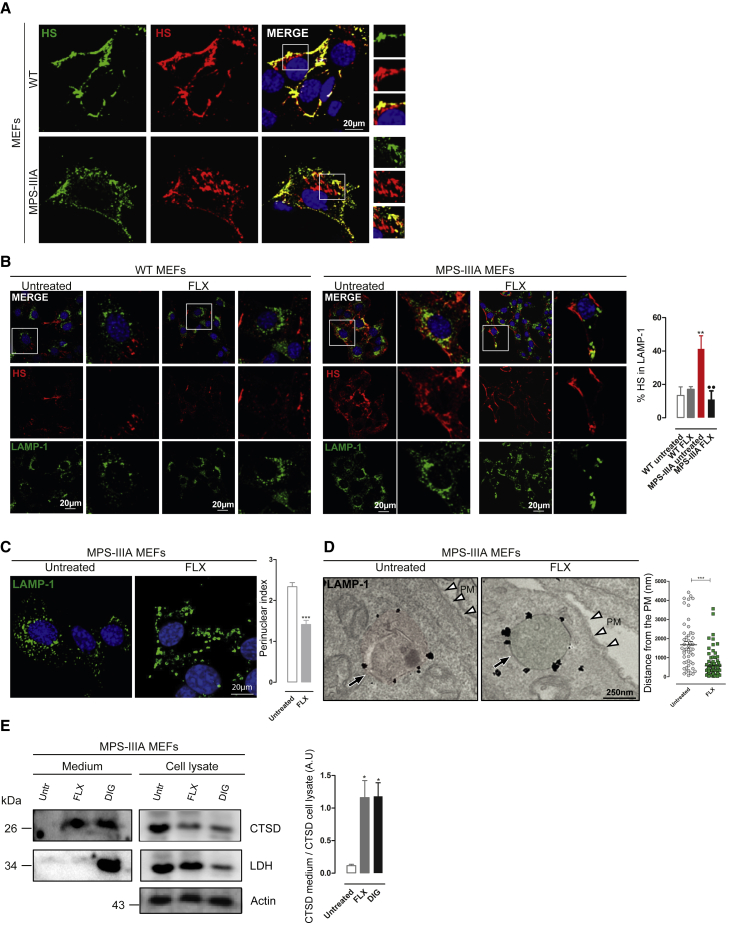
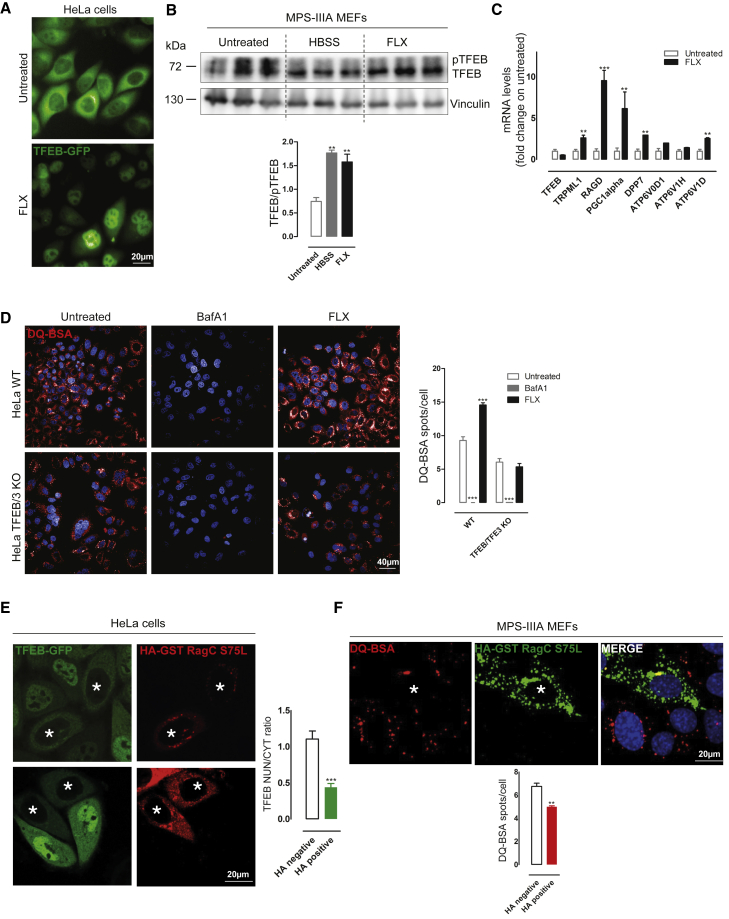
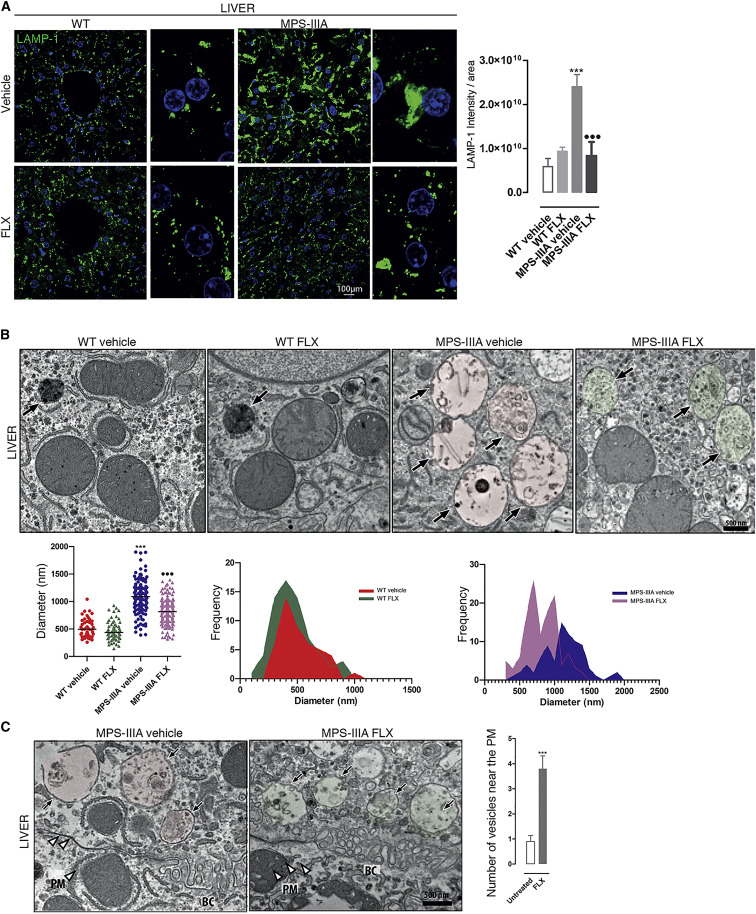
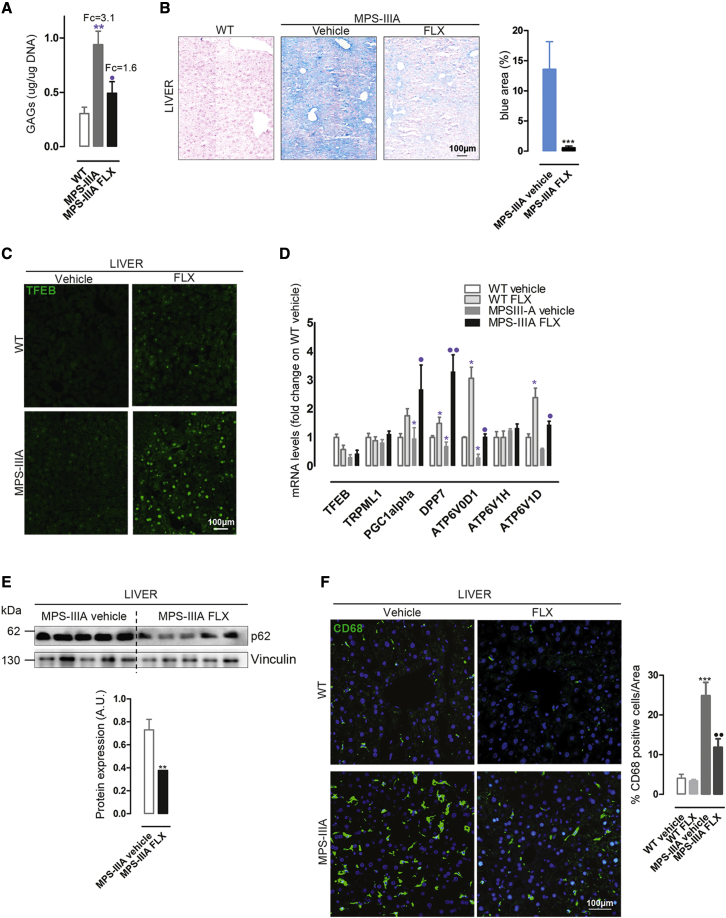
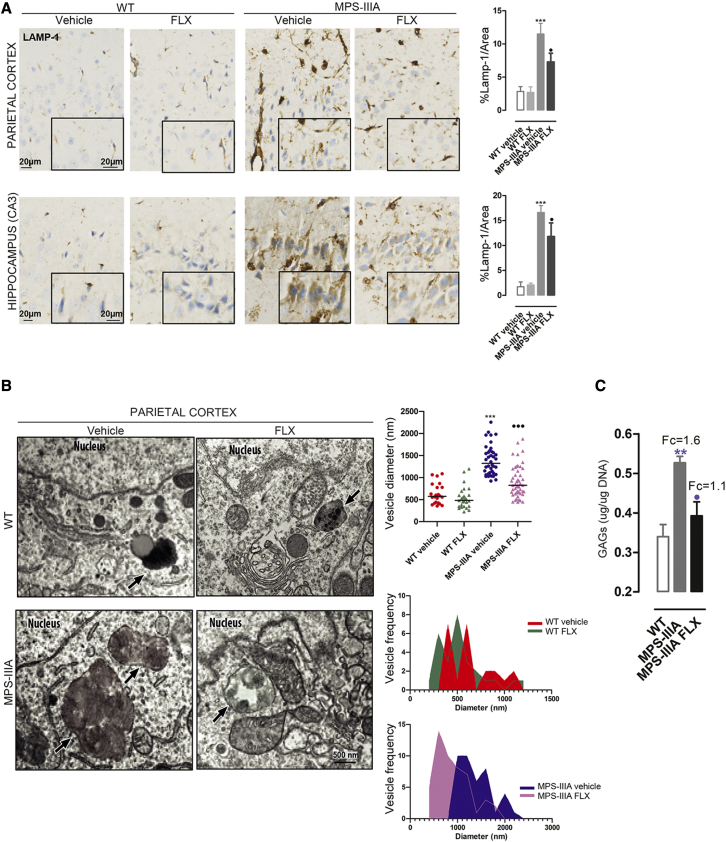
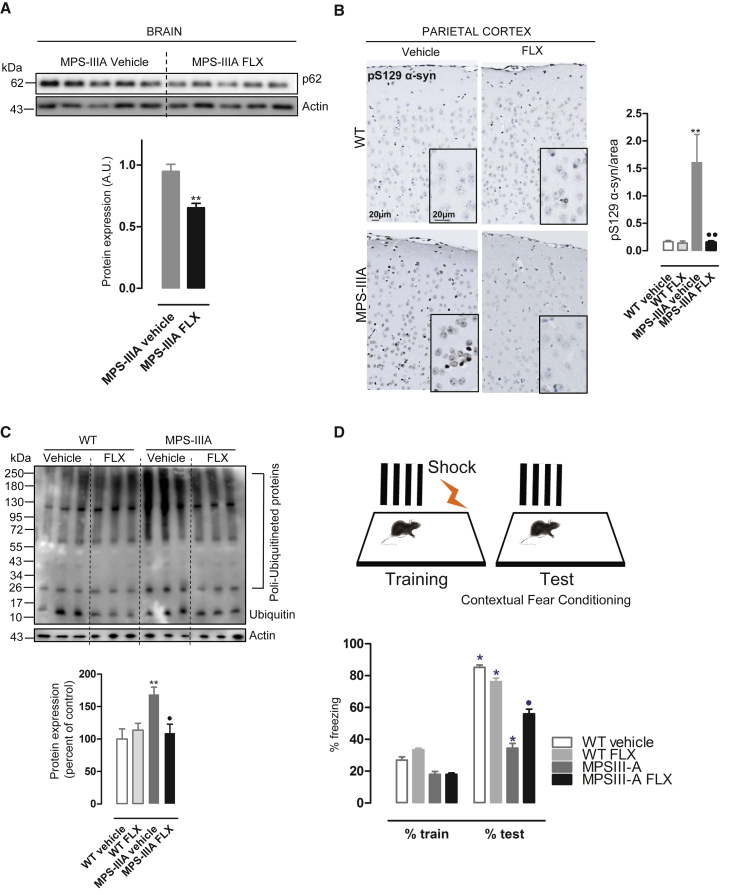
Mucopolysaccharidosis type IIIA (MPS-IIIA) is an autosomal recessive disorder caused by mutations in SGSH involved in the degradation of heparan sulfate. MPS-IIIA presents severe neurological symptoms such as progressive developmental delay and cognitive decline, for which there is currently no treatment. Brain targeting represents the main challenge for therapeutics to treat MPS-IIIA, and the development of small-molecule-based treatments able to reach the CNS could be a relevant advance for therapy. Using cell-based high content imaging to survey clinically approved drugs in MPS-IIIA cells, we identified fluoxetine, a selective serotonin reuptake inhibitor. Fluoxetine increases lysosomal and autophagic functions via TFEB activation through a RagC-dependent mechanism. Mechanistically, fluoxetine increases lysosomal exocytosis in mouse embryonic fibroblasts from MPS-IIIA mice, suggesting that this process may be responsible for heparan sulfate clearance. In vivo, fluoxetine ameliorates somatic and brain pathology in a mouse model of MPS-IIIA by decreasing the accumulation of glycosaminoglycans and aggregated autophagic substrates, reducing inflammation, and slowing down cognitive deterioration. We repurposed fluoxetine for potential therapeutics to treat human MPS-IIIA disease.

Keywords: MPS-IIIA; TFEB; autophagy; drug repurposing; fluoxetine; high content imaging; lysosomal exocytosis; lysosomal storage disorders.


Conflict of interest statement

Declaration of interests The authors declare that the research was conducted in the absence of any commercial or financial relationships that could be construed as a potential conflict of interest.

Figures

None
Graphical abstract
Figure 1
Figure 1
Cell-based DQ-BSA HCI assay identifies fluoxetine (FLX) as a compound hit in MPS-IIIA MEFs (A) Plot representing the Pearson correlation coefficient of the 3 replicas of the 4 Prestwick sub-libraries screened. (B) Plot representing the results of the screening. The y axis shows the DQ-BSA spots per cell values ±SEMs of the hit compounds obtained from the screening, compared to the untreated cells value (DMSO, median of the 4 sub-libraries), and the positive control value (Torin-1, median of the 4 sub-libraries). ANOVA test, ∗∗p < 0.01 versus DMSO; ∗∗∗p < 0.001 versus DMSO. (C) Hit compounds classification. The pie chart shows the drug class distribution of the hit compounds in percentage. (D) FLX re-testing in dose-response format. Dose-response curves of DQ-BSA spots per cell and viability (nuclei count) ± SEMs with relative EC50 and IC50 values, derived from the treatment of MPS-IIIA MEFs with FLX at scalar doses (from 30 to 0, 1 μM) of n > 100 cells from 2 independent experiments. The HCI images of the DQ-BSA spots are representative of the treatment with FLX at 3 μM compared to the untreated cells.
Figure 2
Figure 2
FLX induces autophagy (A) Representative confocal images of endogenous WIPI2+ puncta in MPS-IIIA MEFs untreated and treated with Torin-1 or FLX for 3 h. The plot shows the means of WIPI2 spots per cell ±SEMs of n = 102 cells from 3 independent experiments. ANOVA test, ∗∗p < 0.01 versus untreated; ∗∗∗p < 0.001 versus untreated. (B) Representative image of immunoblot analysis of endogenous p62 and LC3I/LC3II in MPS-IIIA MEFs upon 24 h of FLX treatment alone or in the presence of BafA1 for the last 3 h. The plot shows the densitometry of p62 (at left) and the LC3-II band (on right) normalized to actin as mean values ±SEMs of n = 6 lysates per condition pooled from 2 independent experiments. ANOVA test, ∗∗∗p < 0.001 versus untreated; ⋅⋅p < 0.01 versus FLX; ⋅⋅⋅p < 0.001 versus FLX. (C) Representative images from the high-content assay of ARPE-19 cells stably overexpressing mRFP-EGFP-LC3 plasmid starved with HBSS or untreated and treated with bafilomycin (BafA1) or FLX. The plot shows the quantification of autophagosomes (EGFP+ + mRFP+ spots per cell) compared to the autolysosomes (RFP+/GFP spots per cell). Values are means ± SEMs of n > 1,000 cells pooled from 3 independent experiments. ANOVA test, ∗∗∗p < 0.001 versus untreated/autolysosomes; ⋅⋅⋅p < 0.001 versus untreated/autophagosomes.
Figure 3
Figure 3
FLX reduces intracellular accumulation of HS by inducing lysosomal exocytosis (A) Representative confocal images of endogenous HS in WT and MPS-IIIA MEFs before (green) and after (red) cell permeabilization showing the HS intracellular aggregation in MPS-IIIA MEFs. (B) Representative confocal images of HS and LAMP-1 in WT and MPS-IIIA MEFs untreated and treated for 24 h with FLX. The plot shows the percentage of HS colocalization in LAMP-1 ± SEMs of n = 100 cells from 3 independent experiments. ANOVA test, ∗∗p < 0.01 versus WT untreated; ••p < 0.01 versus MPS-IIIA untreated. (C) Representative confocal images of lysosome distribution marked by LAMP-1 in MPS-IIIA MEFs untreated and treated with FLX overnight; the plot shows the perinuclear index of LAMP-1 ± SEMs of n = 100 cells from 3 independent experiments. t test, ∗∗∗ p < 0.001 versus untreated. (D) Representative immunoelectron microscopy (EM) images of untreated and FLX-treated MPS-IIIA MEFs, labeled with an antibody against LAMP-1. The plot shows the distance of lysosomes to the plasma membrane (PM) (nm) of n ≥ 50 counts. t test, ∗∗∗p < 0.001 versus untreated. The black arrows indicate the vesicle structures; the white arrowheads indicate the PM. (E) Representative images of immunoblot analysis of active cathepsin-D (CTSD) and lactate dehydrogenase (LDH) from the protein precipitated from the growth media (at left) and from the cell lysate (at right) of MPS-IIIA MEFs untreated and treated with FLX (24 h) or digitonin (1 h). The plot shows the normalization of CTSD in the medium on CTSD in the cell lysate. ANOVA test, ∗p < 0.05 versus untreated.
Figure 4
Figure 4
FLX activates TFEB in vitro (A) Representative HCI images of HeLa stably expressing TFEB-GFP plasmid and untreated or treated with FLX for 3 h. (B) Representative image of immunoblot analysis of endogenous TFEB in MPS-IIIA MEFs untreated or treated with FLX, showing the shift from phosphorylated (pTFEB) to the dephosphorylated form of TFEB. As a positive control, cells are starved with HBSS. The plot shows the ratio between the 2 bands (TFEB/pTFEB). ANOVA test, ∗∗p < 0.01 versus untreated. (C) Graph of quantitative RT-PCR (qRT-PCR) showing the mRNA levels of a subset of TFEB target genes in MPS-IIIA MEFs upon 24 h of FLX treatment. The data in the graphs are mean values ±SEMs; n = 4 samples per condition. t test, ∗∗p < 0.01 versus untreated; ∗∗∗p < 0.001 versus untreated. (D) Representative HCI images of DQ-BSA assay in HeLa WT and TFEB/TFE3 KO untreated and treated with BafA1 or FLX. The plot shows the number of DQ-BSA spots per cell as means ± SEMs of n > 1,000 cells. ANOVA test, ∗∗∗p < 0.001 versus untreated. (E) Representative confocal images of HeLa stably expressing TFEB-GFP transfected with HA-GST-RagCS75L plasmid and treated with FLX for 3 h. The plot shows the nuclear:cytosol TFEB ratio as means ± SEMs of n > 50 cells from 3 independent experiments, in the 2 distinct populations, not transfected (HA) and transfected (HA+, indicated with an asterisk). t test, ∗∗∗p < 0.001 versus HA. (F) Representative HCI images of MPS-IIIA MEFs transfected with HA-GST-RagCS75L plasmid, pre-treated with FLX for 3 h and incubated overnight with DQ-BSA. The plot shows the DQ-BSA spots per cell as means ± SEMs of n > 1,000 cells from 3 independent experiments, in the 3 distinct populations, not transfected (HA) and transfected (HA+, indicated with an asterisk). t test, ∗∗p < 0.01 versus HA.
Figure 5
Figure 5
FLX reduces lysosomal vacuolization and induces exocytosis in MPS-IIIA liver tissues (A) Representative confocal images of LAMP-1 in liver sections from WT (n = 4 per groups) and MPS-IIIA (n = 5 per groups) mice that were FLX-treated and compared with the vehicle-treated groups. The plot shows the mean intensity of LAMP-1 per area ±SEMs. ANOVA test, ∗∗∗p < 0.001 versus WT; ⋅⋅⋅p < 0.001 versus MPS-IIIA vehicle. (B) Representative EM images of liver tissues from WT and MPS-IIIA mice vehicle- or FLX-treated. The plot shows the diameter (nm) of n > 50 lysosomal-like structures derived from 2 different animals per group. ANOVA test, ∗∗∗p < 0.001 versus WT; ⋅⋅⋅p < 0.001 versus MPS-IIIA. The 2 histograms analyze the size-frequency distribution. The black arrows indicate the vesicle structures. (C) Representative EM images of liver tissues from vehicle- and FLX-treated MPS-IIIA mice showing the distance of the vesicles to the PM. The plot shows the number of vesicles close to the PM as ±SEMs of n > 50 lysosomal-like structures derived from 2 different animals per group. ANOVA test, ∗∗∗p < 0.001 versus vehicle. The black arrows indicate the vesicle structures; the white arrowheads indicate the PM. BC, bile canaliculus.
Figure 6
Figure 6
FLX ameliorates the hallmarks of liver MPS-IIIA pathology (A) Plot showing the results of the colorimetric quantification of GAGs (μg/μg DNA) ± SEMs in liver extracts from WT, MPS-IIIA-treated with vehicle, and MPS-IIIA-treated with FLX mice (n = 5 per group). The results are expressed as the fold change on WT. ANOVA test, ∗∗p < 0.01 versus WT; ⋅p < 0.05 versus MPS-IIIA. (B) Representative IHC images from AxioScan of colorimetric GAGs staining in liver sections from WT, MPS-IIIA-treated with vehicle, and FLX-treated MPS-IIIA mice; the plot shows the percentage of blue areas in MPS-IIIA untreated and treated (n = 5 per groups) with FLX. t test, ∗∗∗p < 0.001 versus untreated. (C) Representative confocal images of TFEB staining in liver sections of WT and MPS-IIIA mice vehicle- or FLX-treated. (D) Graph of qRT-PCR showing the mRNA levels of a subset of TFEB target genes in liver samples from vehicle- and FLX-treated WT and MPS-IIIA mice (n = 5). The data in the graphs are means ±SEMs. t test, ∗p < 0.05 versus WT vehicle; ⋅⋅p < 0.01 versus MPS-IIIA vehicle; ⋅p < 0.05 versus MPS-IIIA vehicle. (E) Representative image of immunoblot analysis of p62 in liver protein extracts from vehicle- and FLX-treated MPS-IIIA mice. The plot shows the densitometry of p62 band normalized to vinculin (n = 5 per group) as mean values ±SEMs. t test ∗∗p < 0.01 versus vehicle. (F) Representative confocal images of CD68 in liver sections from vehicle- and FLX-treated WT and MPS-IIIA mice. The plot shows the percentage of CD68+ cells per area ±SEMs (n = 5 per group). ANOVA test, ∗∗∗p < 0.001 versus WT vehicle; ⋅⋅p < 0.01 versus MPS-IIIA vehicle.
Figure 7
Figure 7
FLX ameliorates the storage pathology in the brain of MPS-IIIA-treated mice (A) Representative immunostaining using antibodies against the LAMP-1 protein in parietal cortex and hippocampus (CA3) sections from WT and MPS-IIIA mice that were FLX treated compared with vehicle. Nuclei were stained with hematoxylin II (blue). The data are expressed as the percentage of the LAMP-1 area. The graphs showed means ± SEMs (n = 4 per group). ANOVA test, ∗∗∗p < 0.001 versus WT: ⋅p < 0.05 versus MPS-IIIA. (B) Representative EM images of parietal cortex tissues from WT and MPS-IIIA mice that were vehicle- or FLX-treated. The plots show the diameter (nm) of n > 25 lysosomal-like structures derived from 2 different animals per group. ANOVA test, ∗∗∗p < 0.001 versus WT; ⋅⋅⋅p < 0.001 versus MPS-IIIA. The 2 histograms analyze the size-frequency distribution. The black arrows indicate the vesicle structures. (C) Plot showing the results of the colorimetric quantification of GAGs (μg/μg DNA ±SEMs) in brain extracts from WT, vehicle, and treated MPS-IIIA mice (n = 5 per group). Top, the fold change on WT. ANOVA test, ∗∗p < 0.01 versus WT; ⋅p < 0.05 versus MPS-IIIA.
Figure 8
Figure 8
FLX ameliorates the neurological hallmarks of MPS-IIIA mice (A) Representative images of immunoblot analysis of p62 in brain protein extracts from vehicle and FLX-treated MPS-IIIA mice. The plot shows the densitometry of the p62 band normalized to actin as mean values ±SEMs (n = 5 per group). t test, ∗∗p < 0.01 versus MPS-IIIA. (B) Representative immunostaining of phopsho-α-synuclein marker (pS129 α-syn) in brain parietal cortex sections from WT and MPS-IIIA mice that were FLX treated compared with the vehicle group. Nuclei were stained with hematoxylin II (blue). The plot shows the mean percentage of p-129-α-synuclein area on the total area ±SEMs (n = 4 per group). ANOVA test, ∗∗p < 0.01 versus WT vehicle; ⋅⋅p < 0.01 versus MPS-IIIA vehicle. (C) Representative images of the immunoblot analysis of ubiquitin in brain protein extracts from WT and MPS-IIIA vehicle and FLX-treated mice. The plot shows the densitometry of polyubiquitinated proteins normalized to actin as mean values ±SEMs (n = 6 per group). ANOVA test, ∗∗p < 0.01 versus WT vehicle; ⋅p < 0.05 versus MPS-IIIA vehicle. (D) FLX-treated WT (n = 9) and MPS-IIIA (n = 9) and relative control vehicle-treated WT (n = 7) and MPS-IIIA (n = 9) were tested at 8 months of age in the fear contextual conditioning test. Unequal post hoc analysis, ∗p < 0.05 versus train; ⋅p < 0.05 versus MPS-IIIA.

References

    1. Hemsley K.M., Hopwood J.J. Development of motor deficits in a murine model of mucopolysaccharidosis type IIIA (MPS-IIIA) Behav. Brain Res. 2005;158:191–199. doi: 10.1016/j.bbr.2004.08.019. - DOI - PubMed
    1. Settembre C., Fraldi A., Jahreiss L., Spampanato C., Venturi C., Medina D., de Pablo R., Tacchetti C., Rubinsztein D.C., Ballabio A. A block of autophagy in lysosomal storage disorders. Hum. Mol. Genet. 2008;17:119–129. doi: 10.1093/hmg/ddm289. - DOI - PubMed
    1. Monaco A., Maffia V., Sorrentino N.C., Sambri I., Ezhova Y., Giuliano T., Cacace V., Nusco E., De Risi M., De Leonibus E., et al. The amyloid inhibitor CLR01 relieves autophagy and ameliorates neuropathology in a severe lysosomal storage disease. Mol. Ther. 2020;28:1167–1176. doi: 10.1016/j.ymthe.2020.02.005. - DOI - PMC - PubMed
    1. Sardiello M., Palmieri M., di Ronza A., Medina D.L., Valenza M., Gennarino V.A., Di Malta C., Donaudy F., Embrione V., Polishchuk R.S., et al. A gene network regulating lysosomal biogenesis and function. Science. 2009;325:473–477. doi: 10.1126/science.1174447. - DOI - PubMed
    1. Medina D.L., Fraldi A., Bouche V., Annunziata F., Mansueto G., Spampanato C., Puri C., Pignata A., Martina J.A., Sardiello M., et al. Transcriptional activation of lysosomal exocytosis promotes cellular clearance. Dev. Cell. 2011;21:421–430. doi: 10.1016/j.devcel.2011.07.016. - DOI - PMC - PubMed

Publication types

LinkOut - more resources