. 2022 Feb 8;119(6):e2116512119.
doi: 10.1073/pnas.2116512119.

Transmission potential of human schistosomes can be driven by resource competition among snail intermediate hosts

Affiliations

Transmission potential of human schistosomes can be driven by resource competition among snail intermediate hosts

David J Civitello et al. Proc Natl Acad Sci U S A. .

Abstract

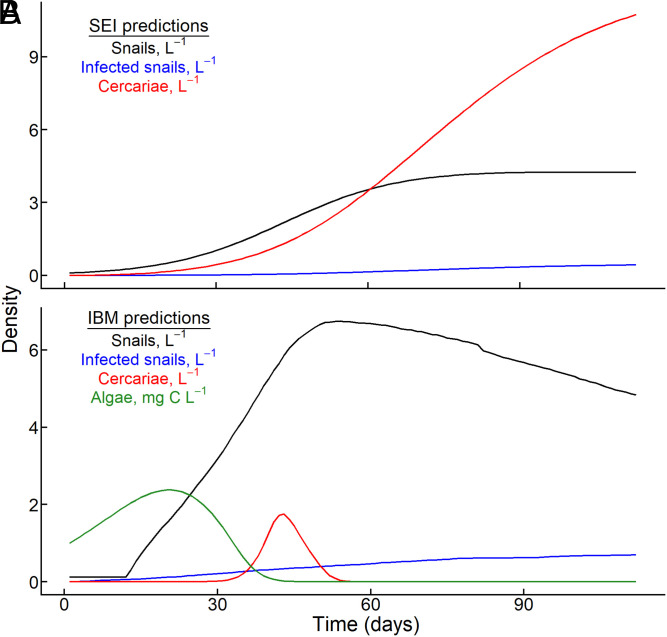
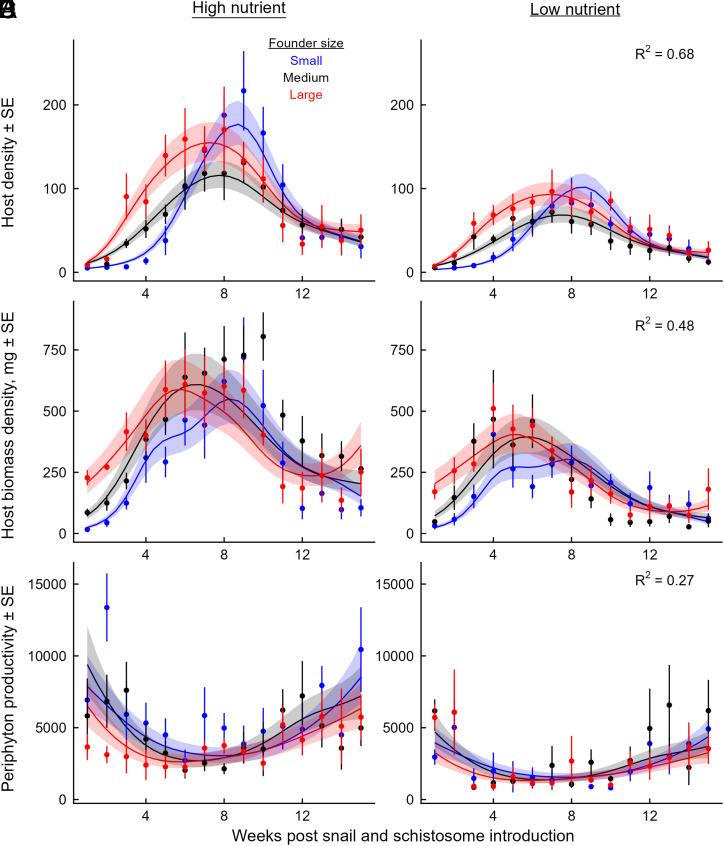
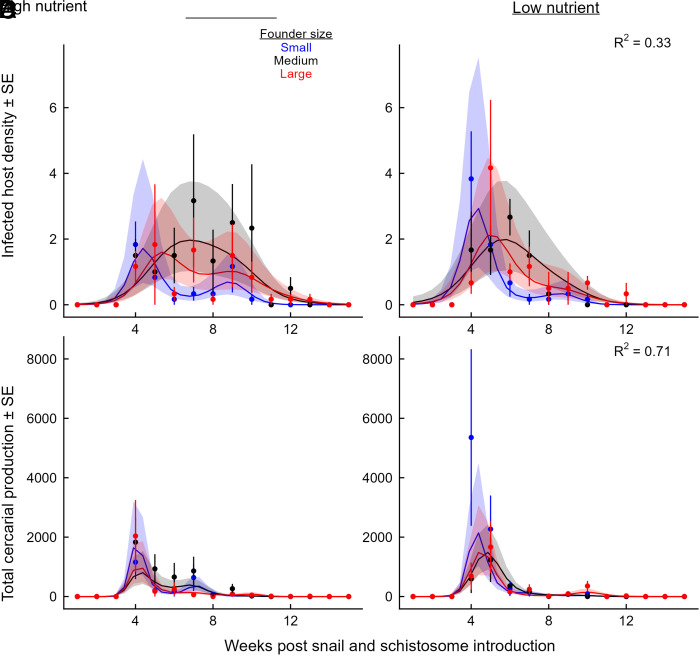
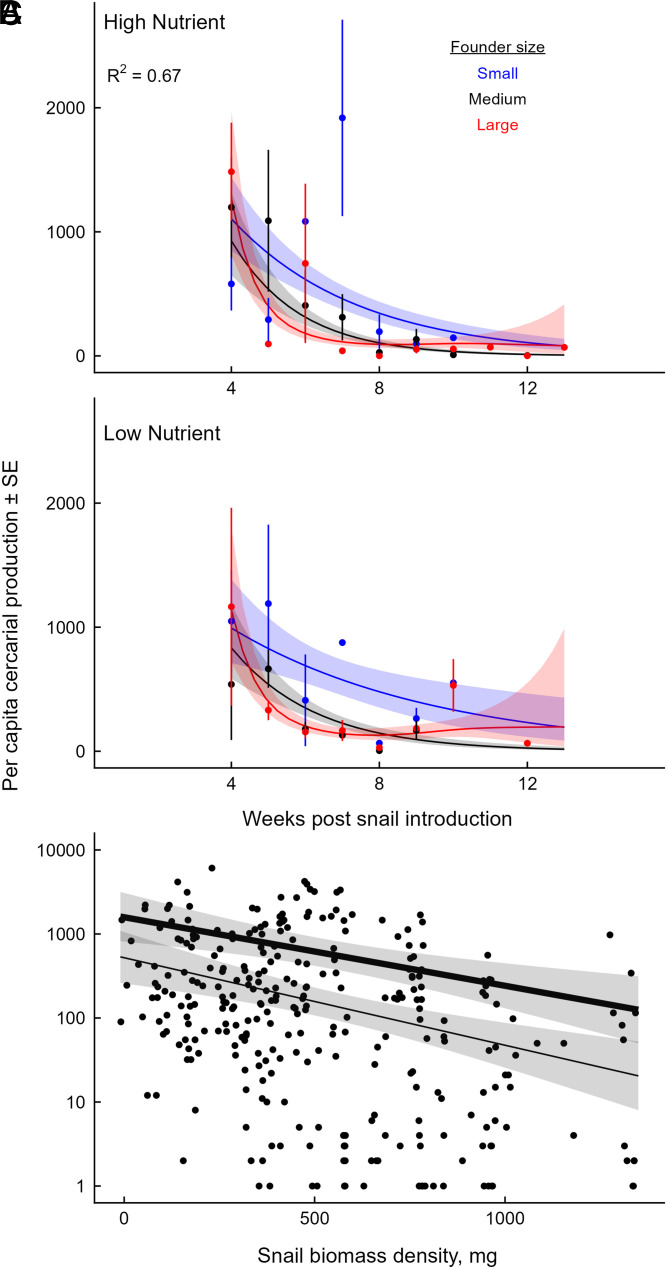
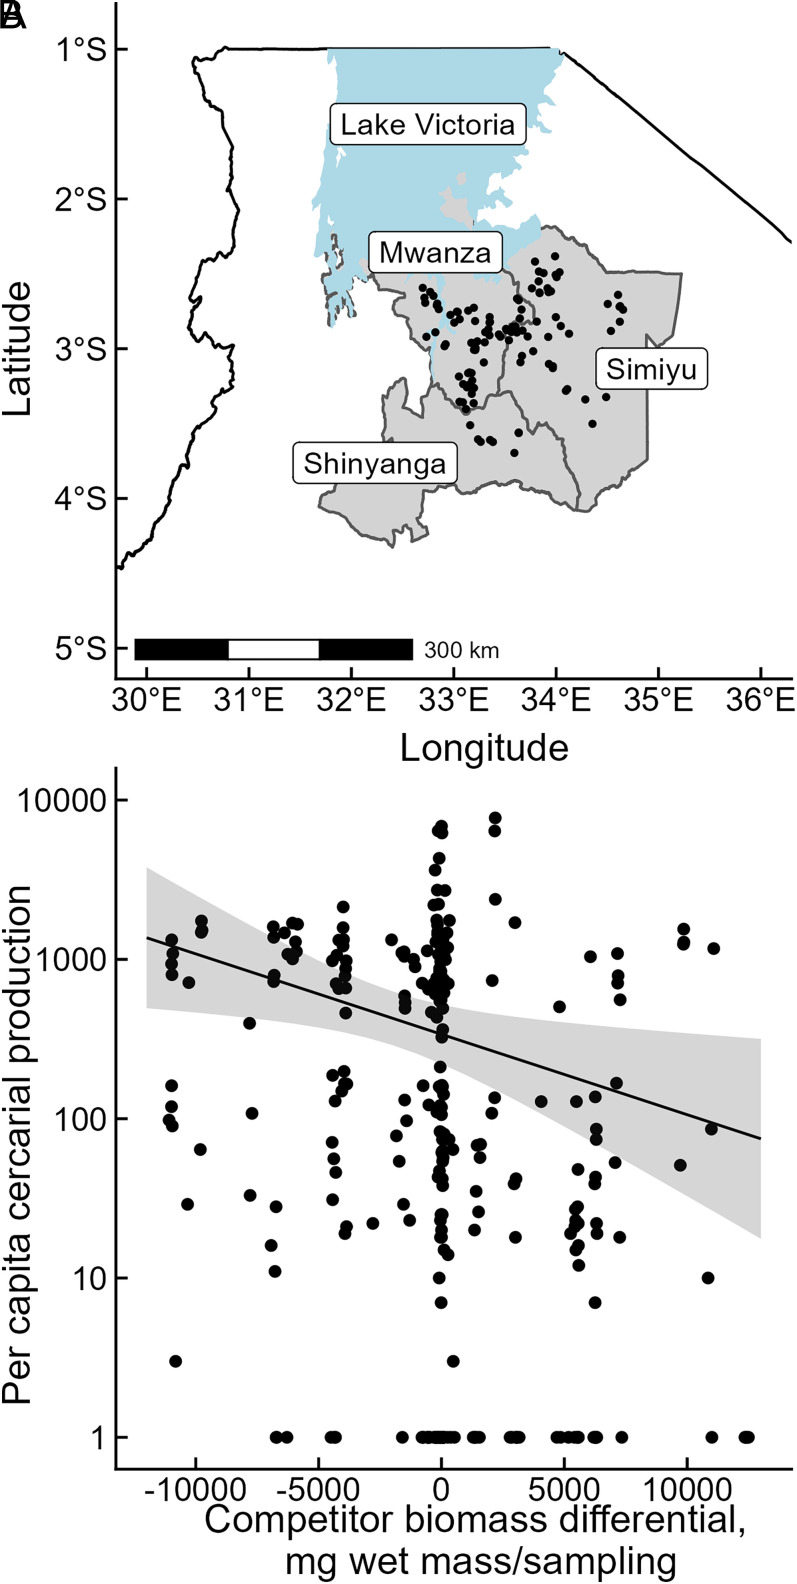
Predicting and disrupting transmission of human parasites from wildlife hosts or vectors remains challenging because ecological interactions can influence their epidemiological traits. Human schistosomes, parasitic flatworms that cycle between freshwater snails and humans, typify this challenge. Human exposure risk, given water contact, is driven by the production of free-living cercariae by snail populations. Conventional epidemiological models and management focus on the density of infected snails under the assumption that all snails are equally infectious. However, individual-level experiments contradict this assumption, showing increased production of schistosome cercariae with greater access to food resources. We built bioenergetics theory to predict how resource competition among snails drives the temporal dynamics of transmission potential to humans and tested these predictions with experimental epidemics and demonstrated consistency with field observations. This resource-explicit approach predicted an intense pulse of transmission potential when snail populations grow from low densities, i.e., when per capita access to resources is greatest, due to the resource-dependence of cercarial production. The experiment confirmed this prediction, identifying a strong effect of infected host size and the biomass of competitors on per capita cercarial production. A field survey of 109 waterbodies also found that per capita cercarial production decreased as competitor biomass increased. Further quantification of snail densities, sizes, cercarial production, and resources in diverse transmission sites is needed to assess the epidemiological importance of resource competition and support snail-based disruption of schistosome transmission. More broadly, this work illustrates how resource competition can sever the correspondence between infectious host density and transmission potential.

Keywords: energy budget; parasitism; resource competition; schistosome; transmission potential.


Conflict of interest statement

The authors declare no competing interest.

Figures

Fig. 1.
Fig. 1.
Divergent predictions for snail and schistosome dynamics in seasonal transmission scenarios arising from (A) the widely used SEI model of snail-schistosome dynamics and (B) the IBM that explicitly incorporates host-parasite energetics and resource competitions. For a small founding population of snails in an aquatic habitat subject to a constant input of schistosome miracidia, the first life stage of the parasite that emerges from eggs, (A) the SEI model predicts a logistic population growth pattern for the density of all snails (black), a slow rise in the density of infected snails (blue), and a coincident rise in the density of human-infectious schistosome cercariae (red), with the greatest potential for human transmission occurring at the end of the season. In contrast, (B) the bioenergetics-based IBM explicitly incorporates competition among snails for edible algal resources (green). Resource availability promotes snail population growth and schistosome cercariae peak in the early/intermediate period of the season because of high per capita snail reproduction and cercarial production rates despite a steady increase in the density of infected snails throughout the season.
Fig. 2.
Fig. 2.
Dynamics of (A, B) snail abundance, (C, D) snail total biomass, and (E, F) net productivity of periphyton in the mesocosm experiment under high nutrient enrichment (Left Column) and low nutrient enrichment (Right Column). Snail populations were founded by small (blue), medium (black), or large (red) individuals. All snail populations peaked in (A, B) abundance and (C, D) biomass during the middle of the experiment. As predicted, peaks occurred later for populations founded with smaller individuals and were larger with high than low nutrient inputs. (E, F) Net productivity of periphyton was greatest at the beginning and end of the experiment, lowest when snail populations peaked, and higher with high than with low nutrient additions. Points and error bars reflect observed treatment means ± SE, and lines and bands represent the predictions ± SE from the fitted GAMM models.
Fig. 3.
Fig. 3.
Dynamics of (A, B) infected snail density and (C, D) total cercarial production over time in the high nutrient (Left Column) and low nutrient (Right Column) treatments, respectively. Snail populations were founded by small (blue), medium (black), or large (red) individuals. (A, B) Infected snail hosts were observed from 4 to 13 wk postintroduction. However, (C, D) total cercarial production was highly concentrated at early timepoints. Points and error bars reflect observed treatment means ± SE, and lines and bands represent the predictions ± SE from the fitted GAMM models.
Fig. 4.
Fig. 4.
Dynamics of per capita cercarial production by snails over time during weeks 4 to 13, when infected snails were observed, under high nutrient enrichment (A) and low nutrient enrichment (B). Snail populations were founded by small (blue), medium (black), or large (red) individuals. Per capita production of cercariae was highest at weeks 4 to 5 when snail populations were growing, but it rapidly decreased over time. Points and error bars reflect observed treatment means ± SE, and lines and bands represent the predictions ± SE from the fitted GAMM models. (C) As predicted by the bioenergetics-based IBM, per capita cercarial production increased with the body size of the infected snail and decreased with the total biomass density of the snail population, driving the observed population-level patterns. Larger snails released more cercariae than small snails (thick line corresponds to 90th percentile size, ∼18 mm diameter; thin line corresponds to 10th percentile size, ∼6.7 mm diameter; shaded region corresponds to 95% CI). Snails of all sizes produced fewer cercariae with increasing competitor density (∼20-fold reduction across the gradient of observed densities.
Fig. 5.
Fig. 5.
(A) Map of 109 waterbodies (points) surveyed for B. nasutus snails and S. haematobium in three regions of northwest Tanzania. (B) Results of the field survey evaluating links among per capita cercarial production, infected snail size, and the biomass of snail competitors. Each point represents one infected snail. Competitor biomass differential represents biomass estimates that are centered on the average for each waterbody. Negative values on the x-axis correspond to infected snails releasing cercariae when competitor biomass in its waterbody was lower than average across the four collection dates, whereas positive values correspond to greater than average competitor biomass. As predicted by the bioenergetics-based IBM and consistent with the mesocosm experiment, per capita cercarial production was significantly reduced when the biomass of intraspecific competitors within waterbodies was greater, resulting in a ∼10-fold decrease across the gradient of competitor biomass (GLMM fixed-effect estimate for competitor biomass [solid line] and 95% CI [shaded region]).

References

    1. Morens D. M., Folkers G. K., Fauci A. S., The challenge of emerging and re-emerging infectious diseases. Nature 430, 242–249 (2004). - PMC - PubMed
    1. Bekerman E., Einav S., Infectious disease. Combating emerging viral threats. Science 348, 282–283 (2015). - PMC - PubMed
    1. Dijkstra K. B., Schrama M. J. J., Gorsich E. E., Hochkirch A., “Deadly mosquito” or “living freshwater”? Science 361, 341 (2018). - PubMed
    1. Rohr J. R., et al. , Emerging human infectious diseases and the links to global food production. Nat. Sustain. 2, 445–456 (2019). - PMC - PubMed
    1. Jones K. E., et al. , Global trends in emerging infectious diseases. Nature 451, 990–993 (2008). - PMC - PubMed

Publication types

MeSH terms