. 2022 Feb 4;13(1):692.
doi: 10.1038/s41467-022-28268-x.

The gut hormone Allatostatin C/Somatostatin regulates food intake and metabolic homeostasis under nutrient stress

Affiliations

The gut hormone Allatostatin C/Somatostatin regulates food intake and metabolic homeostasis under nutrient stress

Olga Kubrak et al. Nat Commun. .

Abstract

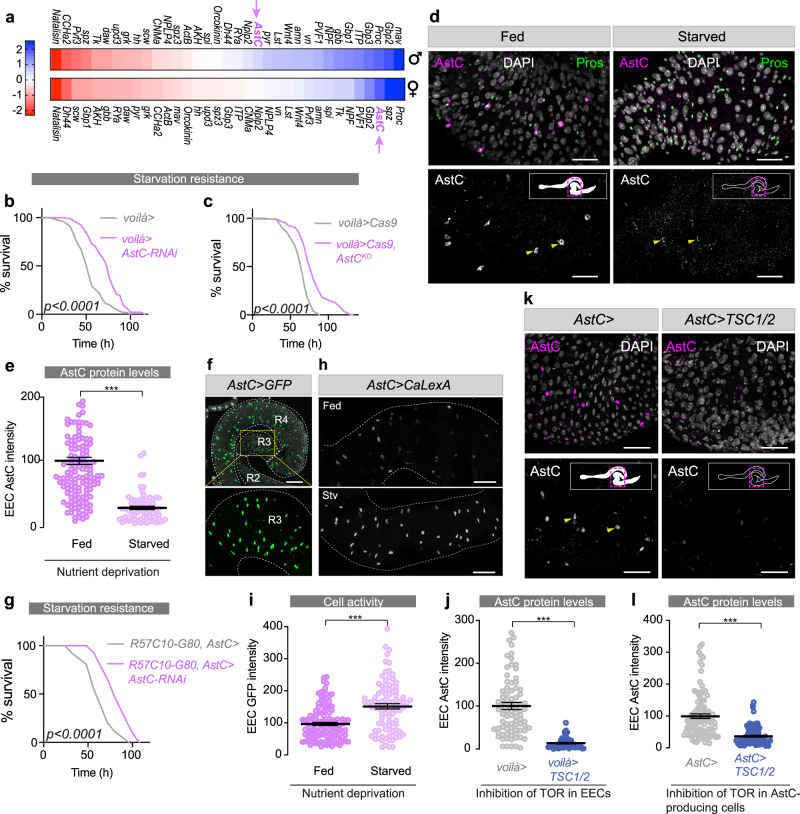
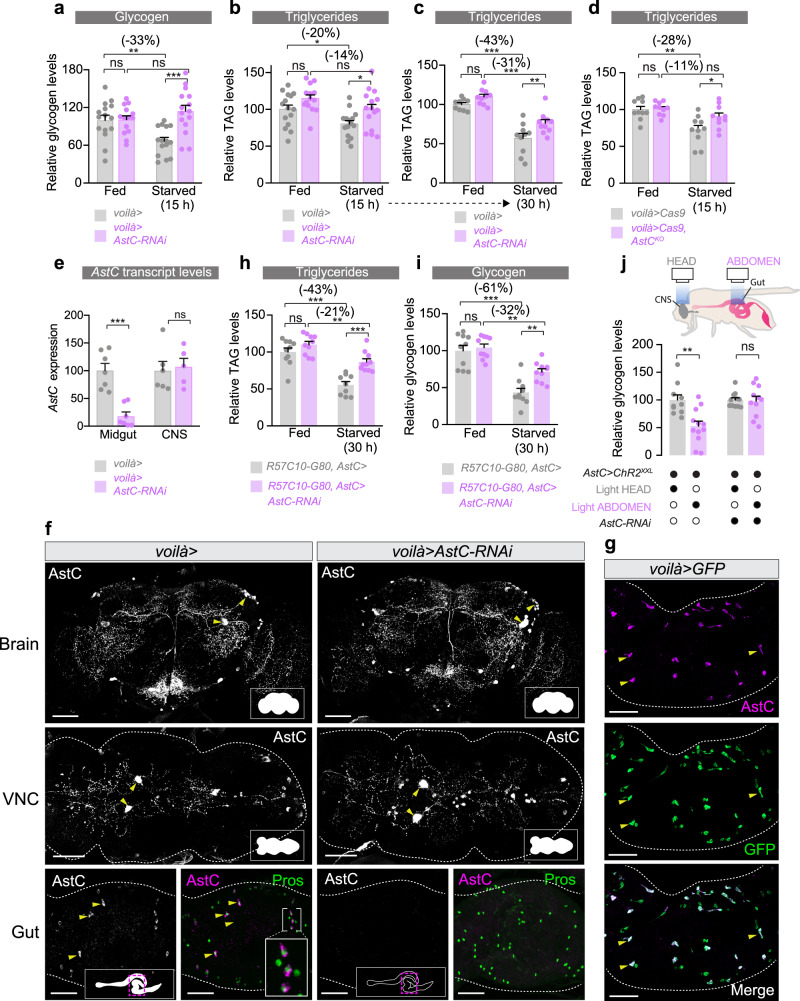
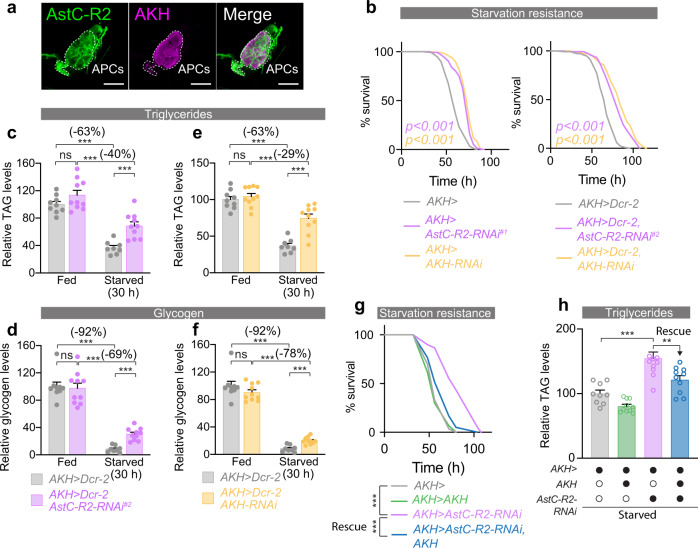
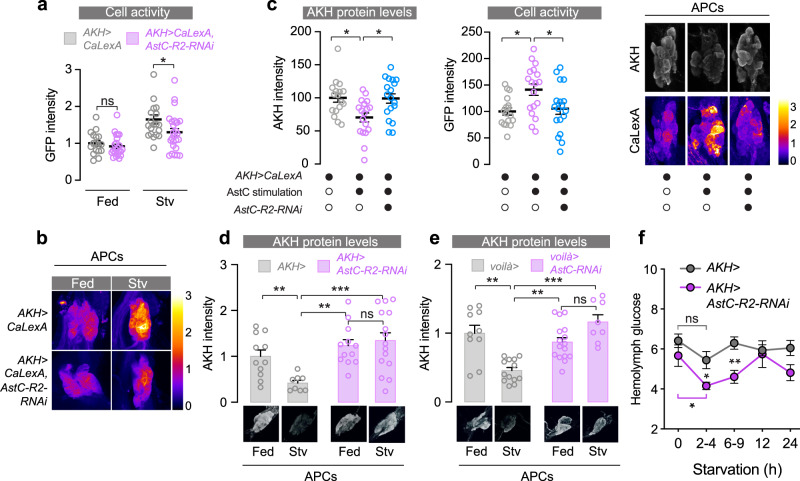
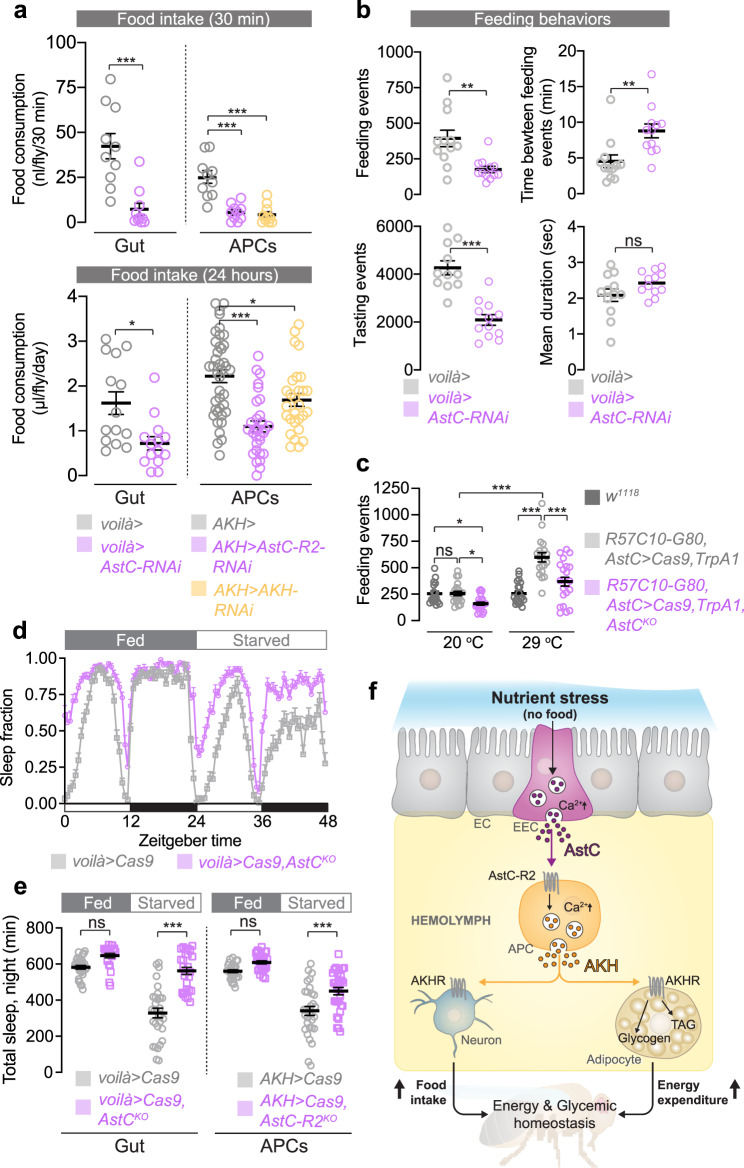
The intestine is a central regulator of metabolic homeostasis. Dietary inputs are absorbed through the gut, which senses their nutritional value and relays hormonal information to other organs to coordinate systemic energy balance. However, the gut-derived hormones affecting metabolic and behavioral responses are poorly defined. Here we show that the endocrine cells of the Drosophila gut sense nutrient stress through a mechanism that involves the TOR pathway and in response secrete the peptide hormone allatostatin C, a Drosophila somatostatin homolog. Gut-derived allatostatin C induces secretion of glucagon-like adipokinetic hormone to coordinate food intake and energy mobilization. Loss of gut Allatostatin C or its receptor in the adipokinetic-hormone-producing cells impairs lipid and sugar mobilization during fasting, leading to hypoglycemia. Our findings illustrate a nutrient-responsive endocrine mechanism that maintains energy homeostasis under nutrient-stress conditions, a function that is essential to health and whose failure can lead to metabolic disorders.


Conflict of interest statement

The authors declare no competing interests.

Figures

Fig. 1
Fig. 1. AstC secretion from the gut is nutrient-responsive and regulates organismal resistance to nutrient stress.
a A screen of adult-midgut peptides identified those that affect starvation survival. Color scale indicates the number of standard deviations from the mean of all lines. Adult-restricted EEC-specific RNAi (b) or CRISPR-mediated knockout (c) of AstC prolongs female starvation survival (p < 0.0001). d Starvation induces AstC release from EECs (marked with anti-Pros). AstC staining is prominent in the R3 region (middle midgut) in fed females and is strongly reduced under starvation. AstC expression remains constant, Supplementary Fig. S1d. Representative of nine guts. Scale bars 50 μm. e AstC staining in R3 drops with starvation (p < 0.0001; results represent 9 guts, n = 145 fed and 72 starved cells). f AstC-expressing cells are abundant in female R3 and R4 (AstC > GFP, green) and less common in R2. Bottom: an enlargement of R3, in which calcium-LexA was measured. Image is representative of six guts. Scale bar 100 μm. g Female starvation survival is prolonged (p < 0.0001) with AstC knockdown in the AstC-producing EECs of the gut. h Starvation activates AstC-expressing EECs of R3, as measured by calcium-induced GFP expression. Scale bars 50 μm. These data represent analysis of 6 guts, n = 120 fed and 100 starved cells; p < 0.0001, and are quantified in (i). j TOR activity inhibits EEC AstC release. Expression of TSC1/2 in EECs for 6 h leads to a strong reduction in R3 AstC staining (results represent analysis of guts from at least 8 animals, n = 85 voilà> and voilà>TSC1/2 cells; p < 0.0001), despite an increase in AstC transcript levels (Supplementary Fig. S1h). k Inhibition of TOR in the AstC-producing cells alone using AstC> to conditionally express TSC1/2 also strongly reduced R3 EEC AstC staining, quantified in (l) (at least 9 guts, n = 99 AstC > and 99 AstC>TSC1/2 cells; p < 0.0001). Scale bars 50 μm. Error bars indicate SEM. ***p < 0.001. Statistical significance was determined using Kaplan–Meier log-rank tests (b, c, g) or two-tailed Mann–Whitney U test (e, i, j, l). Source data are provided as a Source data file.
Fig. 2
Fig. 2. Gut-derived AstC is required for energy mobilization in response to nutritional challenges.
a Adult-female-EEC-restricted AstC RNAi prevents mobilization of stored glycogen during fifteen hours’ starvation (column 1 vs. 3, p = 0.0025; column 3 vs. 4, p < 0.0001; two-way ANOVA genotype/diet interaction, p < 0.01). b This manipulation also reduces TAG mobilization during fifteen-hour starvation (column 1 vs. 3, p = 0.029; column 3 vs. 4, p = 0.028). (a, b, n = 15 except n = 14 for fed voilà>AstC-RNAi) c This phenotype is also displayed with longer (30-h) starvation (column 1 vs. 3, p < 0.0001; column 2 vs. 4, p < 0.0001; column 3 vs. 4, p = 0.0056; n = 10 samples except n = 9 for fed voilà>). d Adult-restricted CRISPR knockout of AstC phenocopies AstC knockdown (column 1 vs. 3, p = 0.0010; column 3 vs. 4, p = 0.045; n = 10). e voilà>AstC-RNAi depletes midgut AstC transcripts (p = 0.0001) without affecting neuronal AstC expression. CNS: central nervous system, consisting of brain and ventral nerve cord (VNC). n = 7 voilà> and voilà>AstC-RNAi midgut samples, n = 6 voilà> CNS samples, n = 5 voilà>AstC-RNAi CNS samples. f Brain and VNC AstC immunostaining is not obviously reduced by voilà>AstC-RNAi, whereas AstC staining in R3 EECs (marked with anti-Prospero) is strongly reduced. CNS staining is quantified in Supplementary Fig. 1o. Images representative of five CNSes and six guts. Scale bars 50 μm. g voilà>GFP expression in female R3 shows overlap with AstC-positive EECs. Images are representative of five guts. Scale bars 50 μm. h, i RNAi against AstC specifically in the AstC-producing EECs (without brain expression) reduces energy mobilization in adult females under starvation (two-way ANOVA genotype/diet interaction, p < 0.05; h: column 1 vs. 3, p < 0.0001; column 2 vs. 4, p = 0.0060; column 3 vs. 4, p = 0.0003; all n = 10 samples except n = 9 for starved R57C10-G80, AstC; i: column 1 vs. 3, p < 0.0001; column 2 vs. 4, p = 0.0010; column 3 vs. 4, p = 0.0059; all n = 10). j Blue (475 nm) illumination of abdomens, but not heads, leads to reduced glycogen levels in AstC>ChR2XXL animals, an effect abrogated by loss of AstC (AstC>ChR2XXL, AstC-RNAi): ChR2XXL-induced AstC release from the gut promotes glycogen mobilization. (p = 0.0026; n = 10 head-lit AstC>ChR2XXL, n = 12 abdomen-lit AstC>ChR2XXL, n = 11 for both regions in AstC>ChR2XXL, AstC-RNAi). Error bars indicate SEM. ns, non-significant; *p < 0.05; **p < 0.01; and ***p < 0.001. Statistical significance was determined using two-way ANOVA with Bonferroni’s post hoc test (ad, h, i) or two-tailed Student’s t-test or two-tailed Mann–Whitney U test (e, j). Source data are provided as a Source data file.
Fig. 3
Fig. 3. AstC acts via AstC-R2 in the APCs to regulate AKH signaling, which mediates the metabolic effects of AstC signaling.
a AstC-R2::2A::GAL4-driven UAS-GFP expression (left, green) is apparent in the AKH-producing cells (APCs) of the CC, marked with anti-AKH (magenta). Images are representative of 8 tissues. Scale bars 20 μm. b Knockdown of AstC-R2 in the APCs phenocopies the starvation-survival effect of AstC knockdown in the gut; knockdown of AKH in these cells also reproduces this phenotype (p < 0.0001 by Kaplan–Meier log-rank test). c, d APC-specific knockdown of AstC-R2 reduces the consumption of TAGs (c) and glycogen (d) during starvation (two-way ANOVA genotype/diet interaction, p < 0.05; c: column 1 vs. 3, p < 0.0001; column 2 vs. 4, p < 0.0001; column 3 vs. 4, p = 0.0009; d: column 1 vs. 3, p < 0.0001; column 2 vs. 4, p < 0.0001; column 3 vs. 4, p < 0.0001). e, f Likewise, APC knockdown of AKH itself induces similar reductions in starvation-induced mobilization of TAGs (e) and glycogen (f). (e: column 1 vs. 3, p < 0.0001; column 2 vs. 4, p = 0.0002; column 3 vs. 4, p < 0.0001; f: column 1 vs. 3, p < 0.0001; column 2 vs. 4, p = 0.0002; column 3 vs. 4, p < 0.0001; all n = 10 except n = 9 for fed AKH>Dcr-2, n = 8 for starved AKH>Dcr-2. g The effects of AstC signaling are mediated by AKH: overexpressing AKH restores normal starvation sensitivity in animals with APC-specific knockdown of AstC-R2. h Likewise, overexpression of AKH in animals with APC-specific knockdown of AstC-R2 rescues their deficiency in lipid mobilization during starvation (column 1 vs. 3, p < 0.0001; column 3 vs. 4, p = 0.0055; all n = 10 except n = 9 for AKH > ). Error bars indicate standard error of the mean (SEM). ns, non-significant; and ***p < 0.001. Statistical significance was determined using Kaplan–Meier log-rank tests (b, g) or two-way ANOVA with Bonferroni’s post hoc test (cf) or one-way ANOVA with Kruskal–Wallis test (h). Source data are provided as a Source data file.
Fig. 4
Fig. 4. AstC acts on the APCs to promote AKH release and thereby maintain glycemic levels.
a AstC potentiates the starvation-induced activation of the APCs. Calcium-induced CaLexA-GFP in the APCs is increased by starvation in AKH>CaLexA control animals (gray); this increase is attenuated by AstC-R2 knockdown (p = 0.030; n = 17, n = 24, n = 20, and n = 26). b Illustrative images of calcium-induced GFP expression in the APCs. c AstC application to ex vivo cultured APCs from AKH>CaLexA females increased CaLexA-GFP and reduced AKH staining. These effects of AstC were abolished by APC-specific knockdown of AstC-R2 (AKH>CaLexA, AstC-R2-RNAi). Representative images of calcium-induced GFP expression and AKH release in the APCs are shown at right. (left panel, column 1 vs. 2, p = 0.031; column 2 vs. 3, p = 0.018; right panel, column 1 vs. 2, p = 0.019; column 2 vs. 3, p = 0.042; left to right, n = 17, n = 18, n = 18). d Immunostaining of the processed AKH peptide shows that starvation induces peptide release in AKH> control animals; this effect is blocked by AstC-R2 knockdown in the APCs (column 1 vs. 2, p = 0.0077; column 2 vs. 3, p = 0.0019; column 2 vs. 4, p = 0.0008; left to right, n = 11, n = 8, n = 12, n = 15). See also Supplementary Fig. 8b. e Likewise, AstC from the gut is required for starvation-induced AKH release (column 1 vs. 2, p = 0.0012; column 2 vs. 3, p = 0.0062; column 2 vs. 4, p < 0.0001; left to right, n = 10, n = 13, n = 16, n = 8). Illustrative anti-AKH images of the APCs are shown below each bar. f AstC signaling in the APCs is required for the maintenance of circulating sugar levels in the hemolymph during starvation (p = 0.024; left to right, n = 4, n = 8, n = 7, n = 4, n = 4). Error bars indicate SEM. ns, non-significant; *p < 0.05; **p < 0.01; and ***p < 0.001. Statistical significance was determined using one-way ANOVA with Kruskal–Wallis test (ce) or two-tailed Mann–Whitney U test (a, f). Source data are provided as a Source data file.
Fig. 5
Fig. 5. AstC promotes food-seeking behaviors.
a AstC knockdown in EECs or AstC-R2 or AKH knockdown in APCs reduces feeding in dye assays (top: gut p = 0.0002; APCs column 1 vs. 2, p < 0.0001; column 1 vs. 3, p < 0.0001; all n = 10) and in longer-term CAFE assays (bottom: gut p = 0.029; APCs column 1 vs. 2, p < 0.0001; column 1 vs. 3, p = 0.016; all n = 10). b EEC AstC knockdown reduces feeding and tasting events recorded by the FLIC system and increases the interval between feeding events; the duration of individual events is unaltered (feeding events, p = 0.0022; time between events, p = 0.0023; tasting events, p < 0.0001; all n = 12 except n = 11 for voilà> tasting events). c TrpA1-mediated activation of AstC-producing EECs leads to increased feeding behaviors, an effect diminished by AstC knockout (column 1 vs. 3, p = 0.042; column 2 vs. 3, p = 0.022; column 2 vs. 5, p < 0.0001; column 4 vs. 5, p < 0.0001, column 5 vs. 6, p < 0.0001; two-way ANOVA genotype/temperature interaction, p < 0.05. Left to right, n = 17, n = 21, n = 23; n = 20, n = 19, n = 22.). Full genotype: R57C10-GAL80; AstC::T2A::GAL4/UAS-TrpA1, UAS-GAL4; tub-GAL80ts, UAS-Cas9, with or without UAS-AstCKO on the third chromosome. Because KO disrupts the AstC::T2A::GAL4 locus, UAS-GAL4 continues GAL4 expression after this event. d EEC knockout of AstC does not strongly affect sleep architecture in fed females; starvation suppresses sleep, an effect attenuated by AstC knockout. e Starvation suppresses nighttime sleep in voilà>Cas9 and AKH>Cas9 animals, an effect attenuated by AstC KO in the EECs or AstC-R2 KO in the APCs. (gut, p < 0.0001; APCs, p < 0.0001; left to right in e: n = 31 animals, n = 24, n = 31, n = 28; n = 31, n = 31, n = 31, n = 31. N values apply to d also). f A model of AstC-mediated nutritional signaling from the gut. Reduced nutritional levels induce the EECs to release AstC into the hemolymph. Although the APCs can autonomously sense circulating sugar levels, they also require AstC input via AstC-R2 to potentiate their activity during starvation, promoting AKH expression and release into the hemolymph. AKH acts via AkhR (1) on the fat body to induce the mobilization of stored energy and (2) on neurons modulating feeding and arousal to suppress sleep, upregulate locomotion, and promote feeding behaviors. Through these effects, gut-derived AstC promotes energetic and nutritional homeostasis. Error bars indicate standard error of the mean (SEM). ns, non-significant; *p < 0.05; **p < 0.01; and ***p < 0.001. Statistical significance was determined using two-way ANOVA with Bonferroni’s post hoc test (c), one-way ANOVA with Dunnett’s test or with Kruskal–Wallis test (a), or two-tailed Mann–Whitney U test (a, b, e). Source data are provided as a Source data file.

References

    1. Koyama T, Texada MJ, Halberg KA, Rewitz K. Metabolism and growth adaptation to environmental conditions in Drosophila. Cell Mol. Life Sci. 2020 doi: 10.1007/s00018-020-03547-2. - DOI - PMC - PubMed
    1. Rehfeld JF. The new biology of gastrointestinal hormones. Physiol. Rev. 1998;78:1087–1108. - PubMed
    1. Gribble FM, Reimann F. Function and mechanisms of enteroendocrine cells and gut hormones in metabolism. Nat. Rev. Endocrinol. 2019;15:226–237. - PubMed
    1. Inui A. Ghrelin: an orexigenic and somatotrophic signal from the stomach. Nat. Rev. Neurosci. 2001;2:551–560. - PubMed
    1. Nauck MA, Meier JJ. Incretin hormones: their role in health and disease. Diabetes Obes. Metab. 2018;20:5–21. - PubMed

Publication types

MeSH terms