Comparative Study
. 2022 Feb 4;12(1):1919.
doi: 10.1038/s41598-022-05179-x.

Spontaneous and TMS-related EEG changes as new biomarkers to measure anti-epileptic drug effects

Affiliations
Comparative Study

Spontaneous and TMS-related EEG changes as new biomarkers to measure anti-epileptic drug effects

Andrea Biondi et al. Sci Rep. .

Abstract

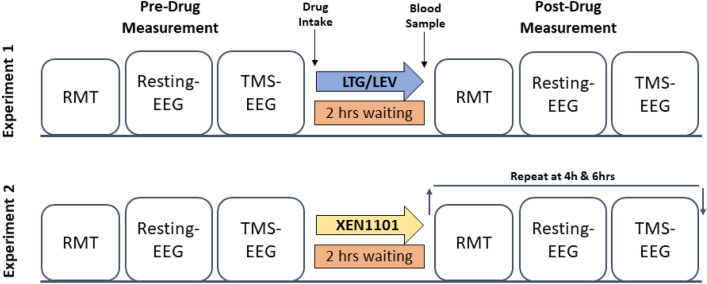
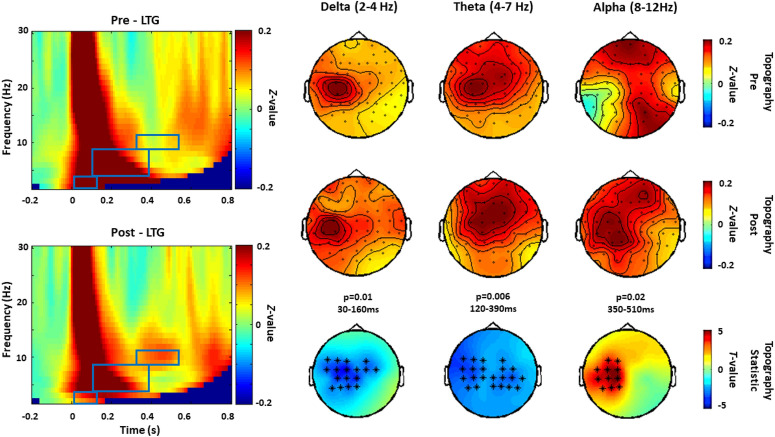
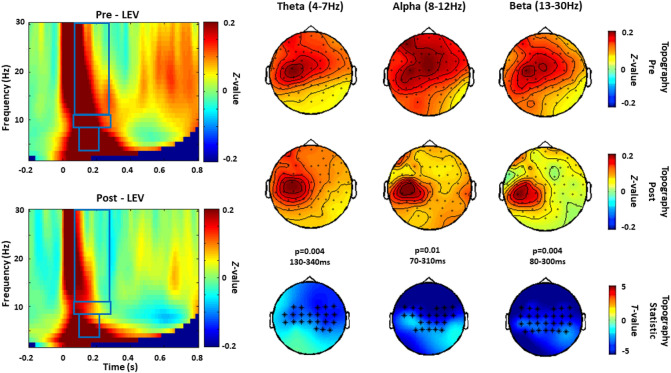
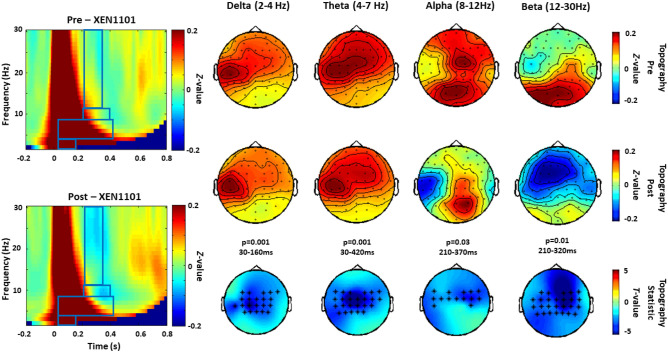
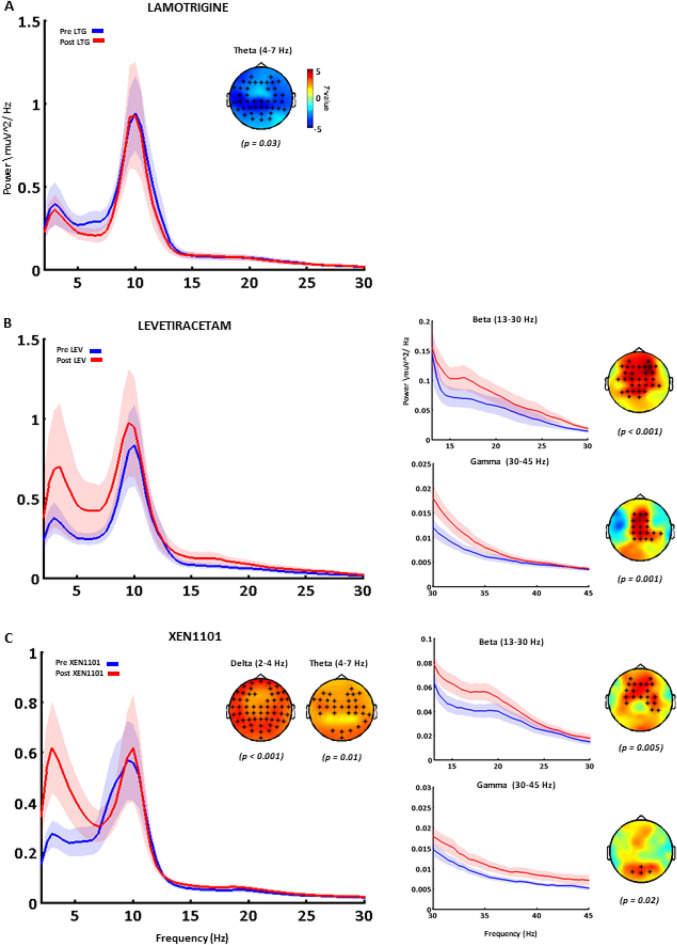
Robust biomarkers for anti-epileptic drugs (AEDs) activity in the human brain are essential to increase the probability of successful drug development. The frequency analysis of electroencephalographic (EEG) activity, either spontaneous or evoked by transcranial magnetic stimulation (TMS-EEG) can provide cortical readouts for AEDs. However, a systematic evaluation of the effect of AEDs on spontaneous oscillations and TMS-related spectral perturbation (TRSP) has not yet been provided. We studied the effects of Lamotrigine, Levetiracetam, and of a novel potassium channel opener (XEN1101) in two groups of healthy volunteers. Levetiracetam suppressed TRSP theta, alpha and beta power, whereas Lamotrigine decreased delta and theta but increased the alpha power. Finally, XEN1101 decreased TRSP delta, theta, alpha and beta power. Resting-state EEG showed a decrease of theta band power after Lamotrigine intake. Levetiracetam increased theta, beta and gamma power, while XEN1101 produced an increase of delta, theta, beta and gamma power. Spontaneous and TMS-related cortical oscillations represent a powerful tool to characterize the effect of AEDs on in vivo brain activity. Spectral fingerprints of specific AEDs should be further investigated to provide robust and objective biomarkers of biological effect in human clinical trials.


Conflict of interest statement

The author GNB declares a conflict of interest, as an employee of Xenon Pharmaceuticals. Inc. Burnaby Canada (https://www.xenon-pharma.com/) and having been granted incentive stock options in the company. The other authors have not conflict of interest to disclose. We confirm that we have read the Journal's position on issues involved in ethical publication and affirm that this report is consistent with those guidelines.

Figures

Figure 1
Figure 1
Experimental protocol and timeline. Lamotrigine, Levetiracetam and placebo were administered on separate occasions in experiment 1 and XEN1101 and placebo on separate occasions in experiment 2. Both studies followed a randomized and crossover design. RMT, Resting-state EEG and TMS-EEG sessions were recorded for each subject at baseline (pre-drug measurement) and at 2 (experiment 1 and 2), 4 and 6 h (experiment 2) after drug intake. Five minutes before each post-drug measurement a blood sample was taken to measure drug plasma concentration.
Figure 2
Figure 2
TRSP modulated by Lamotrigine (experiment 1). Grand averages of the time–frequency representation (TFR averaged over ROI channels) of TRSP recorded before (pre) and after (post) the intake of Lamotrigine are shown on the left panel. The blue boxes correspond to the time window when comparison between pre and post conditions showed significant drug effects. Topographical distributions of drug-related effects on delta (p = 0.01, 30–160 ms), theta (p = 0.006, 120–390 ms) and alpha band power (p = 0.02, 350–510 ms) are reported for pre and post drug conditions on the right panel. Significant electrodes within the bilateral 27 electrode ROIs are represented with asterisks in the t-statistic map.
Figure 3
Figure 3
TRSP modulated by Levetiracetam (experiment 1). Grand averages of the time–frequency representation (TFR averaged over ROI channels) of TMS-related oscillations recorded before (pre) and after (post) the intake of Levetiracetam are shown on the left panel. The blue boxes correspond to the time and frequency windows when comparisons between pre and post conditions showed significant drug effects. Topographical distribution of drug-related effects on theta (p = 0.004, 130–340 ms) and alpha (p = 0.01, 70–310 ms) and the beta (p = 0.004, 80–300 ms) band power are reported for pre and post drug conditions on the right panel. Significant electrodes within the bilateral 27 electrode ROIs are represented with asterisks in the t statistic maps.
Figure 4
Figure 4
TRSP modulated by XEN1101 (experiment 2). Grand averages of the time–frequency representation (TFR averaged over ROI channels) of TRSP oscillations recorded before (pre) and after (post) the intake of XEN1101 are shown on the left panel. The blue boxes correspond to the time and frequency windows when comparisons between pre and post conditions showed significant drug effects. Topographical distribution of drug-related effects on the of delta (p = 0.001, 30–160 ms), theta (p = 0.001, 30–420 ms), alpha (p = 0.03, 210–370 ms) and beta (p = 0.01, 210–320 ms) band power are reported for pre and post drug conditions on the right panel. Significant electrodes within the bilateral 27 electrode ROIs are represented with asterisks in the t-statistic maps.
Figure 5
Figure 5
The effects of antiepileptic drugs on resting-state EEG oscillations. Grand-averaged power spectrums calculated on the average of all channels are reported before (pre, blue) and after (post, red) the intake of Lamotrigine (a), Levetiracetam (b) and XEN1101 (c). For each drug condition, significant differences are indicated with the respective topographical distribution of t-values where significant channels are indicated with asterisks. Lamotrigine (a) decreases theta power (p = 0.03); Levetiracetam (b) increases theta (p = 0.03), beta (p < 0.001) and gamma (p = 0.001) power; XEN1101 increases delta (p < 0.001), theta (p = 0.01), beta (p = 0.005) and gamma (p = 0.02) power. The significant modulation of beta and gamma power are shown for each drug in a zoomed power spectrum (panels on the right; averaged over significant channels for Levetiracetam and XEN1101, respectively).

References

    1. Gribkoff VK, Kaczmarek LK. The need for new approaches in CNS drug discovery: Why drugs have failed, and what can be done to improve outcomes. Neuropharmacology. 2017;120:11–19. doi: 10.1016/j.neuropharm.2016.03.021. - DOI - PMC - PubMed
    1. Ilmoniemi RJ, Virtanen J, Ruohonen J, Karhu J, Aronen HJ, Naatanen R, et al. Neuronal responses to magnetic stimulation reveal cortical reactivity and connectivity. NeuroReport. 1997;8:3537–3540. doi: 10.1097/00001756-199711100-00024. - DOI - PubMed
    1. Casula EP, Maiella M, Pellicciari MC, Porrazzini F, D'Acunto A, Rocchi L, et al. Novel TMS-EEG indexes to investigate interhemispheric dynamics in humans. Clin. Neurophysiol. 2020;131:70–77. doi: 10.1016/j.clinph.2019.09.013. - DOI - PubMed
    1. Tremblay S, Rogasch NC, Premoli I, Blumberger DM, Casarotto S, Chen R, et al. Clinical utility and prospective of TMS-EEG. Clin. Neurophysiol. 2019 doi: 10.1016/j.clinph.2019.01.001. - DOI - PubMed
    1. Lioumis P, Kicic D, Savolainen P, Makela JP, Kahkonen S. Reproducibility of TMS-evoked EEG responses. Hum. Brain Mapp. 2009;30:1387–1396. doi: 10.1002/hbm.20608. - DOI - PMC - PubMed

Publication types