. 2022 Feb 4;9(1):39.
doi: 10.1038/s41597-021-01113-4.

A 24-hour population distribution dataset based on mobile phone data from Helsinki Metropolitan Area, Finland

Affiliations

A 24-hour population distribution dataset based on mobile phone data from Helsinki Metropolitan Area, Finland

Claudia Bergroth et al. Sci Data. .

Abstract

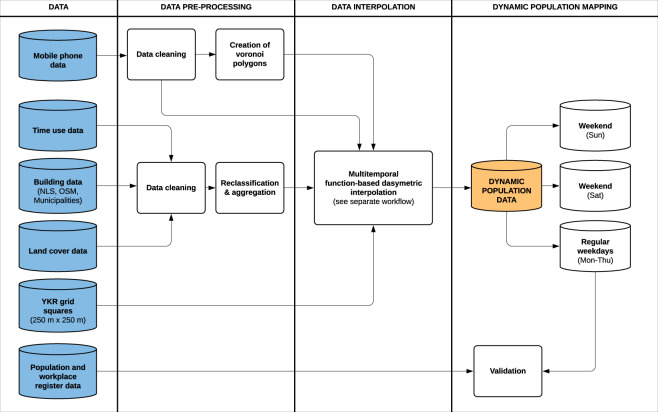
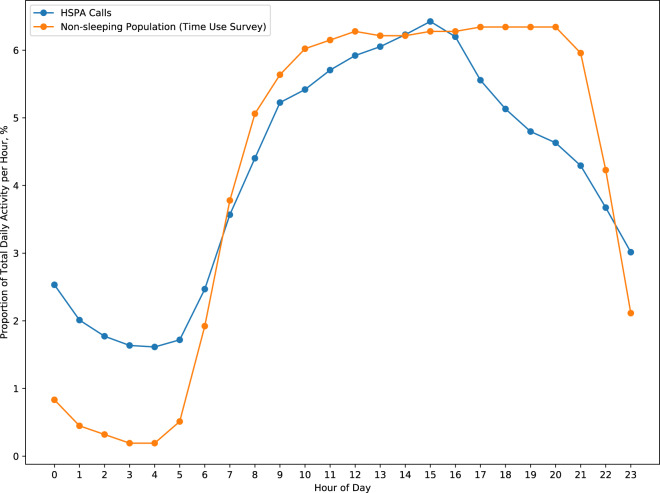
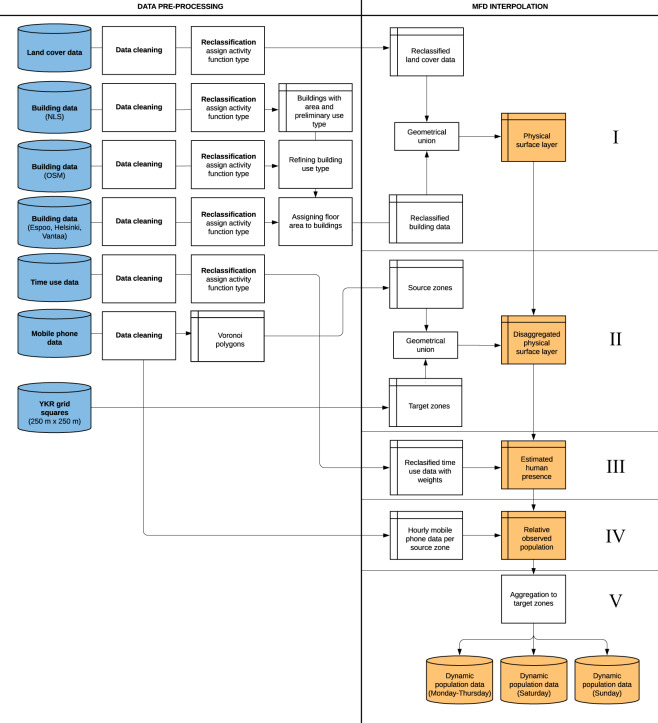
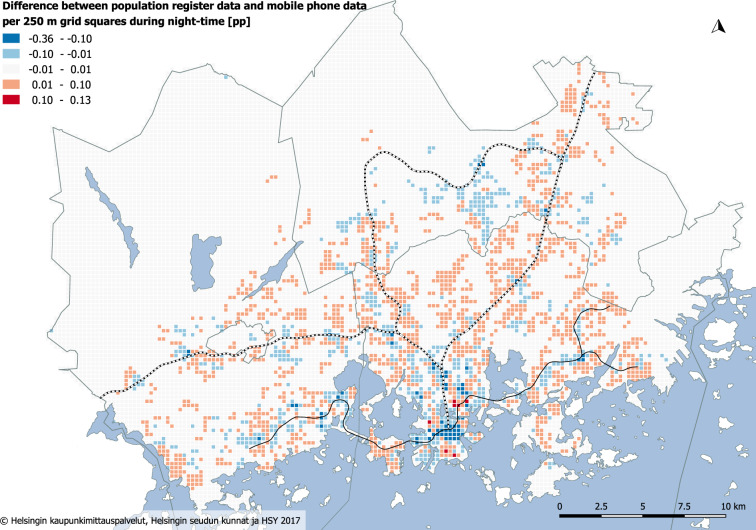
In this article, we present temporally dynamic population distribution data from the Helsinki Metropolitan Area, Finland, at the level of 250 m by 250 m statistical grid cells. An hourly population distribution dataset is provided for regular workdays (Mon - Thu), Saturdays and Sundays. The data are based on aggregated mobile phone data collected by the biggest mobile network operator in Finland. Mobile phone data are assigned to statistical grid cells using an advanced dasymetric interpolation method based on ancillary data about land cover, buildings and a time use survey. The dataset is validated by comparing population register data from Statistics Finland for night hours and a daytime workplace registry. The resulting 24-hour population data can be used to reveal the temporal dynamics of the city, and examine population variations relevant to spatial accessibility analyses, crisis management, planning and beyond.


Conflict of interest statement

The authors declare no competing interests.

Figures

Fig. 1
Fig. 1
The study area and the number of residents per inhabited 250 m × 250 m statistical grid squares (n = 8,253) in 2015. The data for the background map were obtained from the open Helsinki Region Map dataset.
Fig. 2
Fig. 2
The general workflow of the study. The steps of the multi-temporal function-based dasymetric (MFD) interpolation method are presented in more detail in Fig. 5.
Fig. 3
Fig. 3
Daily mean number of HSPA calls during the study period. The values have been rescaled using min-max normalization. Blue markers indicate Mondays. Days with abnormal data are highlighted (indicated with orange markers) and excluded in producing the dynamic population dataset.
Fig. 4
Fig. 4
Daily temporal patterns of mobile phone data use and statistical non-sleeping population on an average weekday (Monday–Thursday) in HMA.
Fig. 5
Fig. 5
General workflow of the multi-temporal function-based dasymetric (MFD) interpolation method. Steps I–V indicate the phases of the MFD interpolation method. Original input data sources are shown in blue and study outputs in yellow.
Fig. 6
Fig. 6
Workflow of the MFD interpolation (adopted from Järv et al.). The (a) mobile phone data as points representing the base stations, (b) Voronoi polygons as theoretical coverage areas of the base stations (c) aggregation to the target zones based on their relative size, (d) integration of ancillary data and (e) final interpolated data.
Fig. 7
Fig. 7
The reclassified land cover dataset based on CORINE Land Cover 2012.
Fig. 8
Fig. 8
The reclassified buildings dataset (n = 153,357) based on their primary activity function type.
Fig. 9
Fig. 9
Time use by location and activity per hour on weekdays (Monday-Thursday) of over 10-year-olds in the Finnish Capital Region 2009–2010.
Fig. 10
Fig. 10
Absolute differences in regular workday population distribution (percentage points, pp) between population register and mobile phone data during night-time (02:00–04:59). Blue colour indicates grid cells, where the population register underestimates the actual population compared to the mobile phone data.
Fig. 11
Fig. 11
Hourly correlation coefficients of a regular workday (Monday – Thursday) between population distribution from interpolated mobile phone data and official register data – population register (blue) and workplace register (orange). All correlations are significant at the 0.001 level (2-tailed).
Fig. 12
Fig. 12
Population distribution of the reallocated population by activity function type during night-time and daytime compared to the original time use survey data.
Fig. 13
Fig. 13
Map of hourly distribution of the population between 12:00–13:00 in HMA during a regular workday. Graphs a, b, c and d represent the variation of the population in a given statistical grid cell at different hours of the day from the daily average.
Fig. 14
Fig. 14
Population accessing grocery Shop 1 (above) and Shop 2 (below) in 15 minutes by public transport between 17:00–18:00. The number of reached population is proportional to the number of inhabitants in the HMA (1,154,967 on 31.12.2017). In the case of Shop 1, the static population data underestimates the number of people reaching the shop by approximately 9,000 individuals (a), whereas in the case of Shop 2, the static population overestimates the reached population by approximately 7,000 people (c).
Fig. 15
Fig. 15
Accessibility to the closest grocery shop (n = 418) using public transport between (a) 01:00–02:00, (b) 17:00–18:00, (c) 22:00–23:00, (d) shows the cumulative sum of population reaching the closest grocery shop by public transport.

References

    1. Järv O, Tenkanen H, Toivonen T. Enhancing spatial accuracy of mobile phone data using multi-temporal dasymetric interpolation. Int. J. Geogr. Inf. Sci. 2017;31:1630–1651. doi: 10.1080/13658816.2017.1287369. - DOI
    1. Hägerstrand T. What About People in Regional Science? Pap. Reg. Sci. 1970;24:7–24. doi: 10.1111/j.1435-5597.1970.tb01464.x. - DOI
    1. Sheller M, Urry J. The new mobilities paradigm. Environ. Plan. A. 2006;38:207–226. doi: 10.1068/a37268. - DOI
    1. Kwan M-P. Beyond space (as we knew it): Toward temporally integrated geographies of segregation, health, and accessibility. Ann. Assoc. Am. Geogr. 2013;103:1078–1086. doi: 10.1080/00045608.2013.792177. - DOI
    1. Silm, S., Järv, O. & Masso, A. Tracing human mobilities through mobile phones. in (Edward Elgar Publishing) 10.4337/9781788115469.00025 (2020).

Publication types