. 2022 Feb 4;12(1):1943.
doi: 10.1038/s41598-022-04827-6.

Ionic mitigation of CD4+ T cell metabolic fitness, Th1 central nervous system autoimmunity and Th2 asthmatic airway inflammation by therapeutic zinc

Affiliations

Ionic mitigation of CD4+ T cell metabolic fitness, Th1 central nervous system autoimmunity and Th2 asthmatic airway inflammation by therapeutic zinc

Anna Krone et al. Sci Rep. .

Abstract

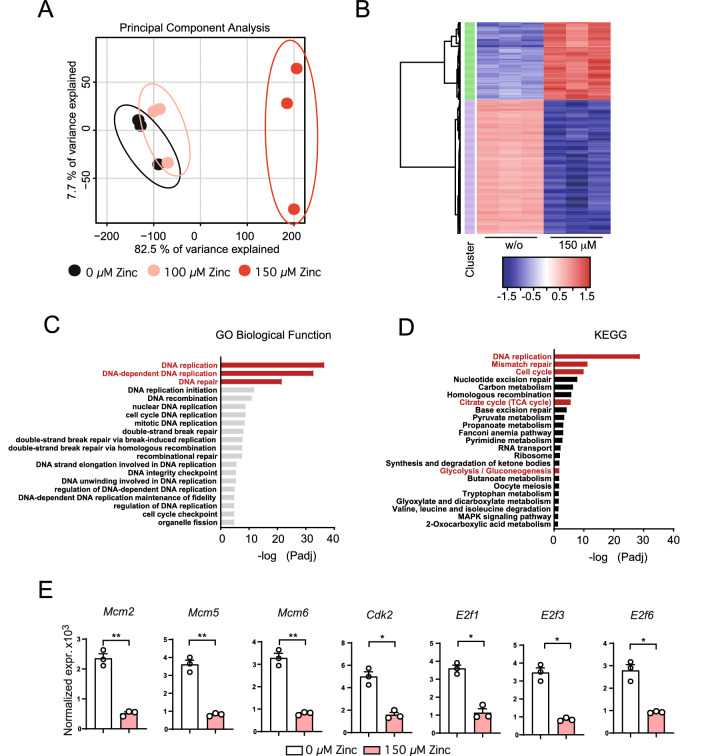
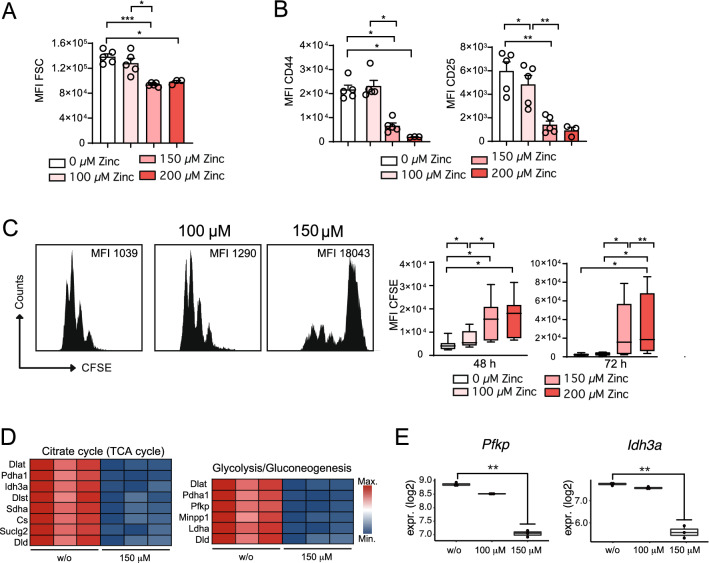
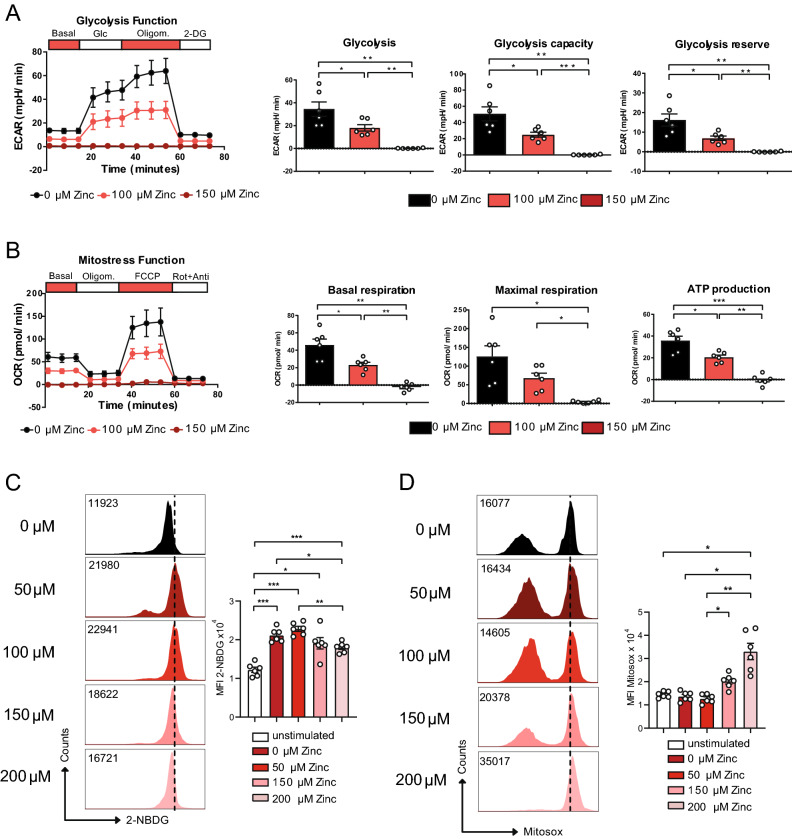
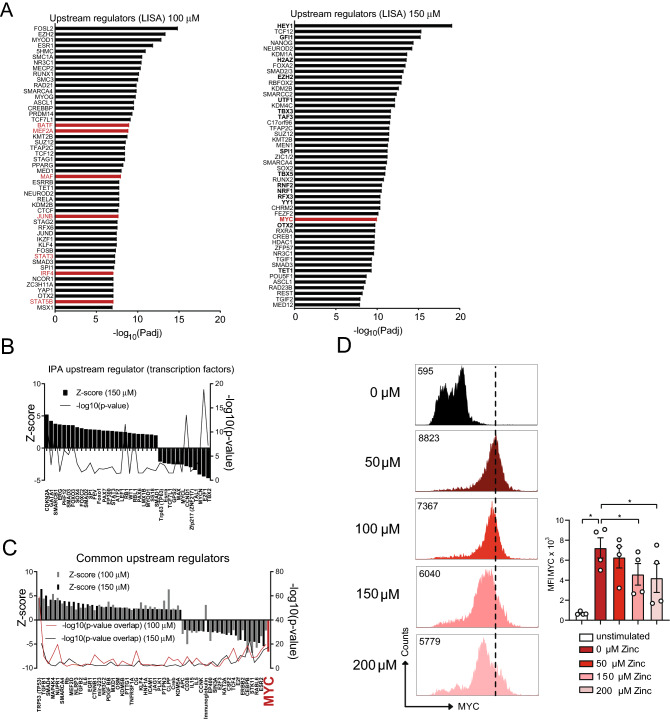
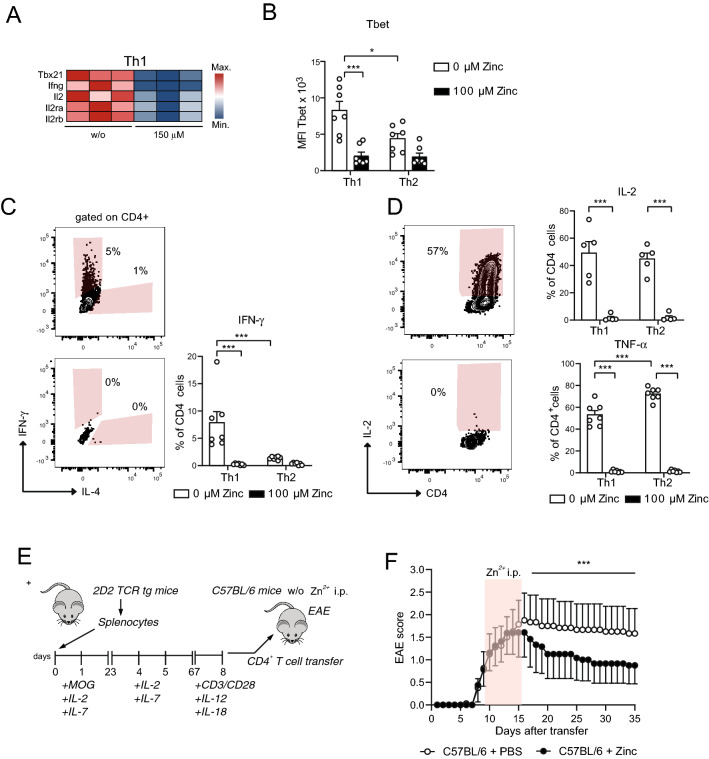
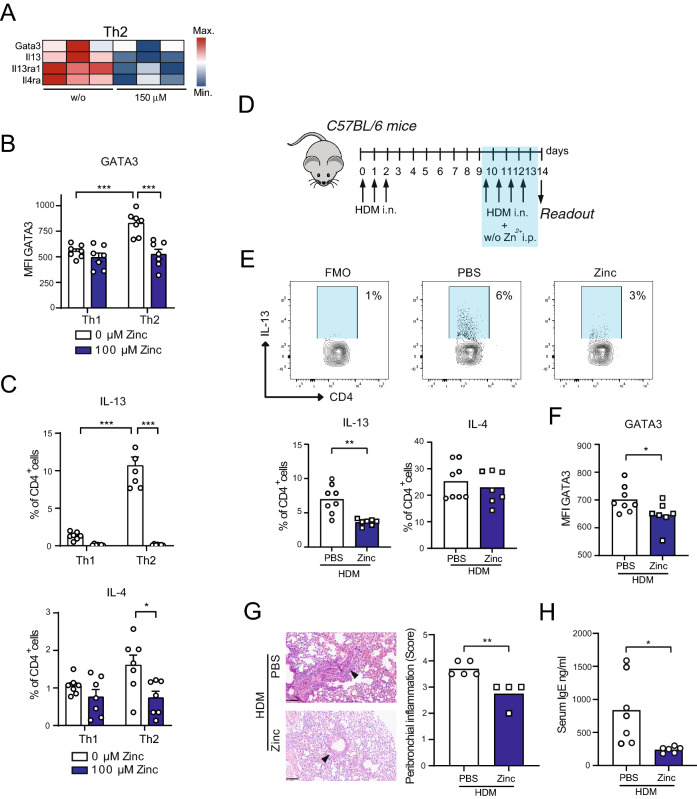
T helper (Th) cells provide immunity to pathogens but also contribute to detrimental immune responses during allergy and autoimmunity. Th2 cells mediate asthmatic airway inflammation and Th1 cells are involved in the pathogenesis of multiple sclerosis. T cell activation involves complex transcriptional networks and metabolic reprogramming, which enable proliferation and differentiation into Th1 and Th2 cells. The essential trace element zinc has reported immunomodulatory capacity and high zinc concentrations interfere with T cell function. However, how high doses of zinc affect T cell gene networks and metabolism remained so far elusive. Herein, we demonstrate by means of transcriptomic analysis that zinc aspartate (UNIZINK), a registered pharmaceutical infusion solution with high bioavailability, negatively regulates gene networks controlling DNA replication and the energy metabolism of murine CD3/CD28-activated CD4+ T cells. Specifically, in the presence of zinc, CD4+ T cells show impaired expression of cell cycle, glycolytic and tricarboxylic acid cycle genes, which functionally cumulates in reduced glycolysis, oxidative phosphorylation, metabolic fitness and viability. Moreover, high zinc concentrations impaired nuclear expression of the metabolic transcription factor MYC, prevented Th1 and Th2 differentiation in vitro and reduced Th1 autoimmune central nervous system (CNS) inflammation and Th2 asthmatic airway inflammation induced by house dust mites in vivo. Together, we find that higher zinc doses impair the metabolic fitness of CD4+ T cells and prevent Th1 CNS autoimmunity and Th2 allergy.


Conflict of interest statement

The authors declare no competing interests.

Figures

Figure 1
Figure 1
High dose zinc aspartate negatively regulates genes controlling cell cycle entry and progression in CD4+ T cells. (A) Principal component analysis (PCA) of the individual biological samples used for bulk RNA sequencing. (B) Unsupervised clustering heatmap showing differentially expressed genes (DEG) between individual biological samples. (C) TOP Gene ontology (GO) Biology Function pathways based on p-value. Shown is the –log10 of the p-values of the individual pathways. (D) TOP KEGG pathways based on p-value. Shown is the –log10 of the p-values of the individual pathways. (E) Normalized gene expression of Mcm2, Mcm5, Mcm6, Cdk2, E2f1, E2f3, and E2f6 determined by RNA sequencing. Statistical analysis in (E) by unpaired student’s t test. Dots represent individual mice used to isolate OT-II TCR tg CD4+ T cells. RNA sequencing data was generated in biological triplicates from 3 mice. KEGG was used for pathway analysis. p* < 0.05, **p < 0.01, ***p < 0.001.
Figure 2
Figure 2
High concentrations of zinc inhibit blast formation, activation, proliferation and the metabolic fitness of CD4+ T cells. (A) Blast formation of OT-II TCR tg CD4+ T cells in the absence and presence of 100 μM, 150 μM, and 200 μM zinc aspartate analyzed by determining the FSC using FACS after 24 h. (B) MFI of CD44 and CD25 expression of OT-II TCR tg CD4+ T cell activation after 48 h. (C) CFSE dilution of OT-II TCR tg CD4+ T cells in the absence and presence of 100 μM, 150 μM, and 200 μM zinc aspartate after 72 h of stimulation. (D) Heatmap showing significant genes out of the KEGG pathways ‘Glycolysis/Gluconeogenesis’ and ‘Citrate cycle (TCA cycle)’ identified in Fig. 1D. (E) Normalized gene expression of Pfkp and Idh3a determined by RNA sequencing. Statistical analysis in (AC) by one-way ANOVA followed by Tukey’s honestly significant difference (HSD) post hoc test for multiple comparisons. Data in (AC) are from 3 experiments and dots represent individual mice used to isolate OT-II TCR tg CD4+ T cells. Data in (C) are from 8 mice per group. RNA sequencing data in (D,E) was generated in biological triplicates from 3 mice. KEGG was used for pathway analysis. *p < 0.05, **p < 0.01, ***p < 0.001.
Figure 3
Figure 3
Zinc aspartate reduces glycolysis and OXPHOS in CD4+ T cells. (A) Extracellular acidification rate (ECAR) of OT-II TCR tg CD4+ T cells in the absence and presence of 100 and 150 μM zinc aspartate after 24 h of stimulation and adding glucose, oligomycin, and 2-DG. Bar graphs show glycolysis, glycolysis capacity, and glycolysis reserve. (B) Oxygen consumption rate (OCR) of OT-II TCR tg CD4+ T cells in the absence and presence of 100 and 150 μM zinc aspartate after 24 h of stimulation and adding oligomycin, FCCP, and rotenone/antimycin. Bar graphs show basal respiration, maximal respiration and ATP production. (C) Glucose uptake determined using 2-NBDG and measured by FACS for the indicated groups. (D) Mitochondrial ROS production determined using Mitosox and measured by FACS for the indicated groups. Statistical analysis in (AD) by one-way ANOVA followed by Tukey’s honestly significant difference (HSD) post hoc test for multiple comparisons. Data in (AD) are from 3 experiments. Dots represent individual mice used to isolate OT-II TCR tg CD4+ T cells. *p < 0.05, **p < 0.01, ***p < 0.001.
Figure 4
Figure 4
High zinc concentrations inhibit MYC as a transcriptional regulator of metabolic gene expression in CD4+ T cells. (A) Upstream regulator anaylsis using Landscape in silico analysis (Lisa; http://lisa.cistrome.org/) of the RNA sequencing data from OT-II TCR tg CD4+ T cells in the presence of 100 μM or 150 μM zinc aspartate 24 h after activation. (B) Upstream regulators specific to OT-II TCR tg CD4+ T cells in the presence of 150 μM zinc aspartate identified by IPA. (C) Shared upstream regulators between OT-II TCR tg CD4+ T cells in the presence of 100 μM and 150 μM zinc aspartate identified by Ingenuity Pathway Analysis (IPA). (D) Histograms show nuclear MYC expression in OT-II CD4+ T cells activated for 24 h in the absence or presence of the indicated zinc concentrations. Graphs show cumulated data from 4 mice. RNA sequencing data (AC) was generated in biological triplicates from 3 mice. Statistical analysis in (D) by one-way ANOVA followed by Tukey’s honestly significant difference (HSD) post hoc test for multiple comparisons. Data in (D) are from 4 mice. *p < 0.05, **p < 0.01, ***p < 0.001.
Figure 5
Figure 5
Zinc aspartate prevents Th1 CNS autoimmunity. (A) Heatmap showing Th1 genes of OT-II TCR tg CD4+ T cells in the absence and presence of 150 μM zinc aspartate. (B) MFI of Tbet measured by FACS of OT-II TCR tg CD4+ T cells differentiated into Th1 and Th2 cells in the absence and presence of 100 μM zinc aspartate. (C) Frequencies of CD4+IFN-γ+ cells measured by FACS after Th1 and Th2 differentiation in the absence and presence of 100 μM zinc aspartate. (D) Frequencies of CD4+IL-2+ and CD4+TNF-α+ cells measured by FACS after Th1 and Th2 differentiation in the absence and presence of 100 μM zinc aspartate. (E) Splenic T cells of 2D2 mice were stimulated in vitro with MOG35-55 in the presence of IL-2 and IL-7 and were reactivated with plate bound anti-CD3 and anti-CD28 in the presence of IL-12 and IL-18. Fully activated transgenic 2D2 T cells were adoptively transferred into C57BL/6 recipients. Zinc aspartate was administered daily i.p. (15 µg/animal) starting at day 8 after the appearance of first clinical signs. Zinc treatment was continued for 7 days. The control group received PBS. (F) The clinical score of passive EAE was assessed for 35 days after transfer. Data are shown as mean ± SEM. RNA sequencing data in (A) was generated in biological triplicates from 3 mice. Statistical analysis in (BD) by unpaired student’s t test and in (F) by non-parametric Wilcoxon matched pairs test. Dots represent individual mice used to isolate OT-II TCR tg CD4+ T cells for Th differentiation. Data in (BD) are from 3 experiments. Data in (F) are from 8 mice per group. *p < 0.05, **p < 0.01, ***p < 0.001.
Figure 6
Figure 6
Zinc impairs Th2 house dust mite-induced asthmatic airway inflammation. (A) Heatmap showing Th2 genes of OT-II TCR tg CD4+ T cells in the absence and presence of 150 μM zinc. (B) MFI of GATA3 measured by FACS of OT-II TCR tg CD4+ T cells differentiated into Th1 and Th2 cells in the absence and presence of 100 μM zinc aspartate. (C) Frequencies of CD4+IL-13+ and CD4+IL-4+cells measured by FACS after Th1 and Th2 differentiation in the absence and presence of 100 μM zinc aspartate. (D) Mouse model of Th2 asthmatic airway inflammation induced by house dust mite (HDM) extract. (E) Frequencies of lung CD4+IL-13+ and CD4+IL-4+cells measured by FACS in the mouse model shown in Fig. 3D at day 14. (F) MFI of GATA3 in lung CD4+ T cells measured by FACS in the mouse model shown in Fig. 3D at day 14. (G) Peribronchial inflammation in the lungs from mice of the HDM asthma model shown in Fig. 3D ad day 14. (H) Total IgE serum levels of mice from the HDM asthma model shown in Fig. 3D ad day 14. RNA sequencing data in (A) was generated in biological triplicates from 3 mice. Statistical analysis in in (B) and (C) and (EH) by unpaired student’s t test. Dots represent individual mice. Data are from 3 (B,C) and 2 (EH) experiments. *p < 0.05, **p < 0.01, ***p < 0.001.

References

    1. Ruterbusch M, et al. In vivo CD4(+) T cell differentiation and function: Revisiting the Th1/Th2 paradigm. Annu. Rev. Immunol. 2020;38:705–725. - PubMed
    1. Hammad H, Lambrecht BN. The basic immunology of asthma. Cell. 2021;184(9):2521–2522. - PubMed
    1. Mattiuzzi C, Lippi G. Worldwide asthma epidemiology: insights from the global health data exchange database. Int. Forum Allergy Rhinol. 2020;10(1):75–80. - PubMed
    1. Willame C, et al. Incidence rates of autoimmune diseases in European Healthcare Databases: a contribution of the advance project. Drug Saf. 2021;44(3):383–395. - PMC - PubMed
    1. Anzilotti C, et al. An essential role for the Zn2+ transporter ZIP7 in B cell development. Nat. Immunol. 2019;20(3):350–361. - PMC - PubMed

Publication types

MeSH terms