. 2022 Jun;16(6):1512-1522.
doi: 10.1038/s41396-022-01198-8. Epub 2022 Feb 5.

Founder cell configuration drives competitive outcome within colony biofilms

Affiliations

Founder cell configuration drives competitive outcome within colony biofilms

Lukas Eigentler et al. ISME J. 2022 Jun.

Abstract

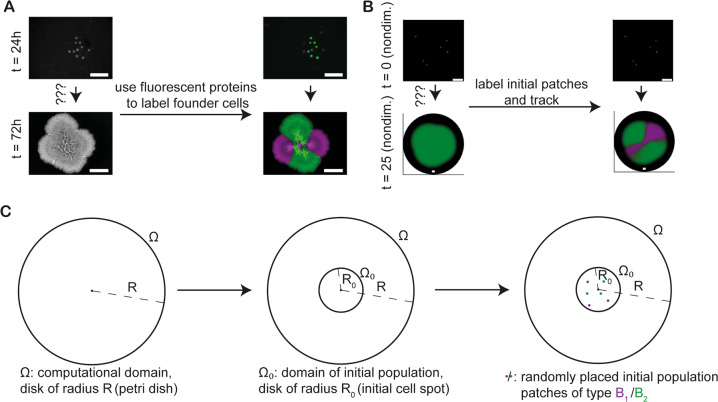
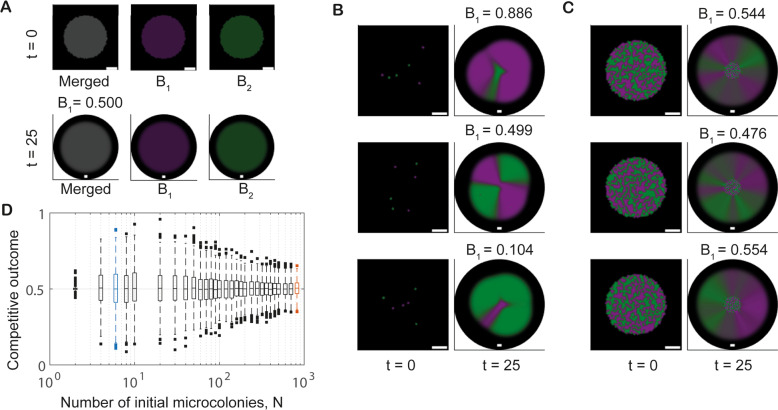
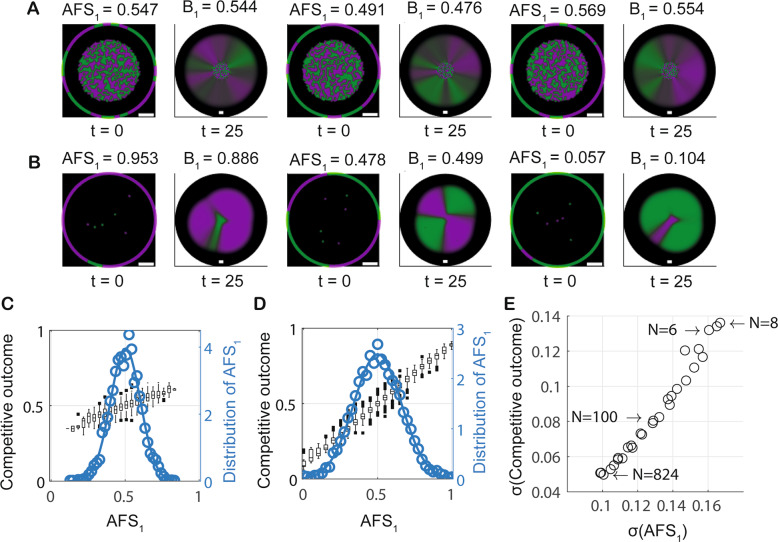
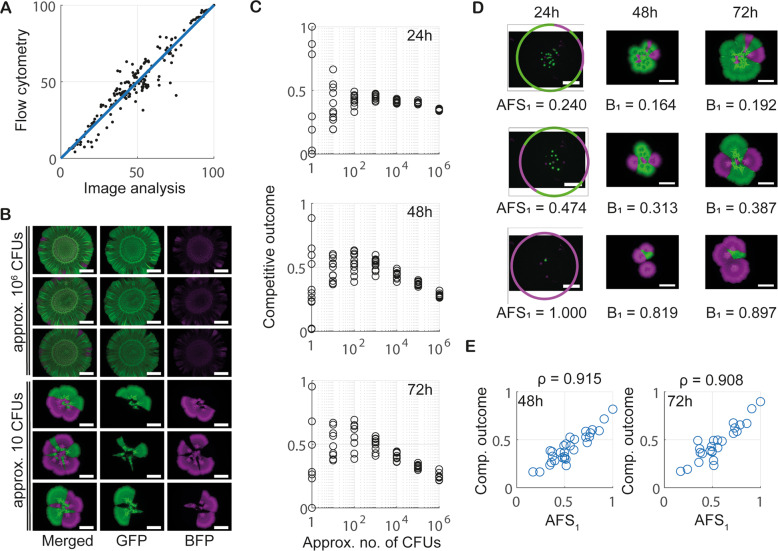
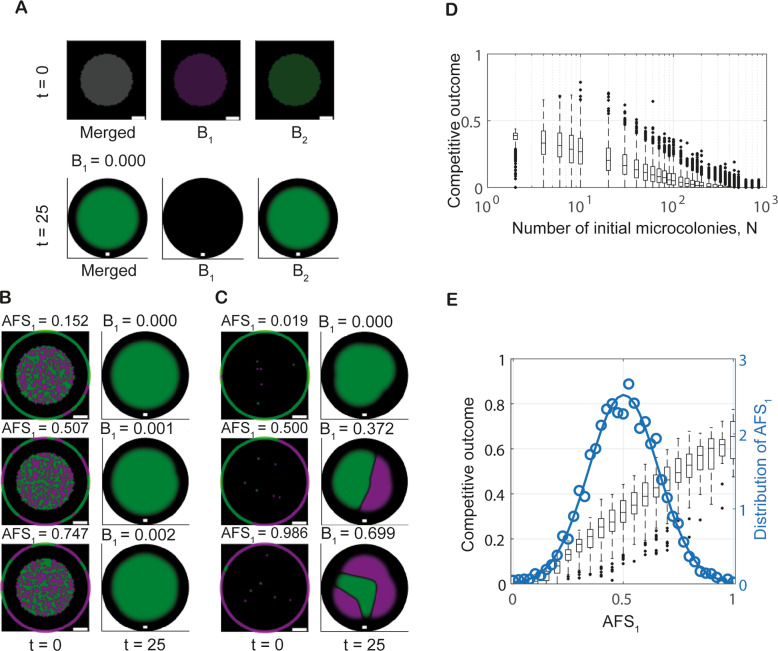
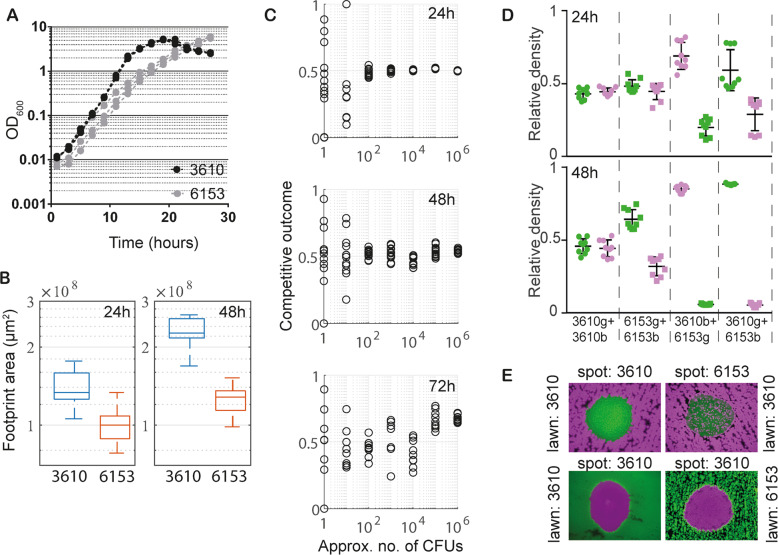
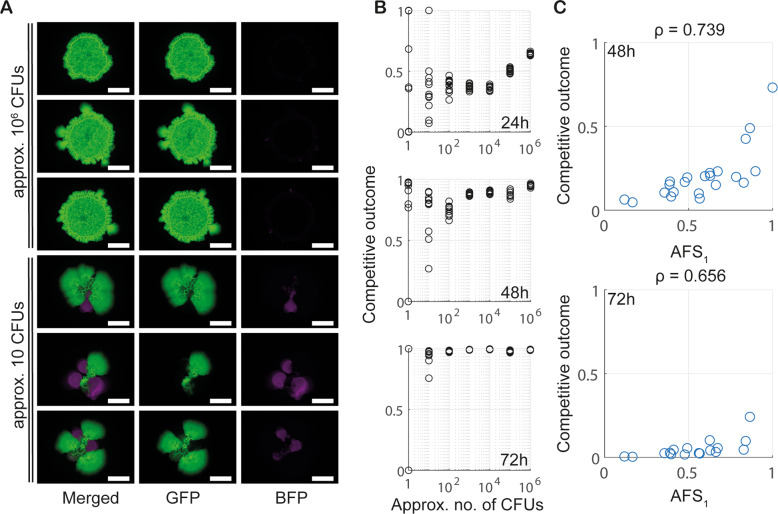
Bacteria can form dense communities called biofilms, where cells are embedded in a self-produced extracellular matrix. Exploiting competitive interactions between strains within the biofilm context can have potential applications in biological, medical, and industrial systems. By combining mathematical modelling with experimental assays, we reveal that spatial structure and competitive dynamics within biofilms are significantly affected by the location and density of the founder cells used to inoculate the biofilm. Using a species-independent theoretical framework describing colony biofilm formation, we show that the observed spatial structure and relative strain biomass in a mature biofilm comprising two isogenic strains can be mapped directly to the geographical distributions of founder cells. Moreover, we define a predictor of competitive outcome that accurately forecasts relative abundance of strains based solely on the founder cells' potential for radial expansion. Consequently, we reveal that variability of competitive outcome in biofilms inoculated at low founder density is a natural consequence of the random positioning of founding cells in the inoculum. Extension of our study to non-isogenic strains that interact through local antagonisms, shows that even for strains with different competition strengths, a race for space remains the dominant mode of competition in low founder density biofilms. Our results, verified by experimental assays using Bacillus subtilis, highlight the importance of spatial dynamics on competitive interactions within biofilms and hence to related applications.


Conflict of interest statement

The authors declare no competing interests.

Figures

Fig. 1
Fig. 1. Experimental and modelling set-up.
A An example of the experimental assay. Founder cells carry either a constitutively produced copy of GFP (green) or mTagBFP (magenta). The bacteria were mixed in a 1:1 ratio and images taken after 24 h and 72 h of incubation. The number of founder cells was approx. 10 CFUs. The scalebars are 5 mm long. B An example realisation of the mathematical model. In the right-hand plots green and magenta are used to differentiate two subsets of the initial patches (t=0, top) and their subsequent development (t=25, bottom). Black areas indicate the computational domain, Ω. The plot of initial condition is a blow-up of the centre of the whole domain. The scalebars represent 7 nondimensional space units. C Schematic of model initial condition. Initial populations (filled coloured circles) are placed in Ω0, a small subdomain of the whole computational domain Ω (both centred at the origin O).
Fig. 2
Fig. 2. Spatial structure and variability in competitive outcome depend on founder density.
AC Example model realisations for different founder densities. All plots show the system’s initial conditions (t=0) and the outcomes after 25 time units. Plots visualising the systems’ states at t=0 show a blow-up of the subdomain Ω0; plots visualising outcomes at t=25 show the full computational domain Ω (black background). The scalebars are seven unit lengths long. A The outcome of simulations initialised with piecewise spatially homogeneous populations representing high founder density. The ‘Merged’ image channel shows both strains (grey colour corresponds to overlap); the B1(green) and B2 (magenta) channels only show single strain filters of the plot. B The range of outcomes observed for low founder density (number of initial cell patches N=6). C The range of outcomes for intermediate founder densities (N=824). In (B, C) only the ‘Merged’ channel is shown. D Variability in competitive outcome increases with decreasing founder density. Each boxplot contains data from 1000 model realisations. Blue and red boxplots correspond to the founder densities in B and C, respectively.
Fig. 3
Fig. 3. Access to free space determines competitive outcome.
A, B Example model realisations for different founder densities. All plots show system initial conditions (t=0) with the reference circle used to compute the AFS score (the circle is rescaled for visualisation purposes) and outcomes after 25 time units. The founder densities are N=824 and N=6 in A and B, respectively. Plots visualising system states at t=0 show a blow-up of the subdomain Ω0; plots visualising outcomes at t=25 show the full computational domain Ω (black background). The scalebars are seven unit lengths long. C, D The relation between the AFS score AFS1, and competitive outcome is shown for intermediate founder density (N=824) and low founder density (N=6) in C and D, respectively. Data were obtained from 5000 model realisations and cover the continuum of AFS1. The observed probability density function for AFS is shown (circular markers); along with the density function of a fitted normal distribution (μ0.5,σ0.10 in C, μ0.5,σ0.16 in D) (solid line). E The relation between the standard deviations of the AFS score AFS1 and the competitive outcome. Each data point (circle) represents a different founder density and contains information from 1000 model realisations.
Fig. 4
Fig. 4. Experimental data confirm modelling hypotheses.
A Comparison of image analysis with flow cytometry. A scatter plot comparing measurements of relative density of the mTagBFP-labelled strain obtained from image analysis and flow cytometry is shown. Each data point corresponds to one biofilm, which was imaged before being analysed by flow cytometry. The data contains measurements taken from all strain pairs, all founder densities, and all time points. The solid blue line shows the identity x=y, with the coefficient of determination being R2=0.91. B Example images of single-strain biofilms consisting of GFP (green,B1) and mTagBFP (magenta, B2) labelled copies of 3610. Taken after 72 h of incubation and shown for two different founder densities (scalebar 5 mm). C Strain density data. Competitive outcome measurements taken after 24 h, 48 h and 72 h of biofilm incubation. Plotted are technical repeats from one biological repeat of the experiment. The full data set is presented in Fig. S5A. D Example visualisations of AFS score calculations. Three example biofilms images at 24 h (left), 48 h (middle) and 72 h (right). The strains are as described in B. Images at 24 h show the reference circle used for the AFS1 score. E The relationship between AFS1 and competitive outcome for B1. AFS was calculated from images taken at 24 h, and competitive outcome for B1 after 48 h (left, n=30) and 72 h (right, n=25). The linear correlation coefficient ρ is indicated.
Fig. 5
Fig. 5. Modelling data for a non-isogenic strain pair with local antagonistic interactions.
AC Example model realisations for high (A), intermediate (B) and low (C) founder density are shown. A the Merged image channel shows both strains (grey colour corresponds to overlap), the B1 and B2 channels only show single strain filters of the plot. In B, C only the Merged channel is shown. Plots visualising system states at t=0 show a blow-up of the subdomain Ω0 and the circles used to calculate the AFS scores around the initial conditions are not to scale. Plots visualising outcomes at t=25 show the full computational domain Ω (black background). The scalebars are seven unit lengths long. D The relation between founder density and competitive outcome. Each boxplot contains data from 1000 model realisations. E The relation between the AFS score AFS1, and competitive outcome for one fixed founder density (N=6). Data were obtained from 5000 model realisations and covers the continuum of AFS1. The observed probability density function for AFS is shown (circular markers); the density function of a fitted normal distribution (μ0.5,σ0.16) as a solid line.
Fig. 6
Fig. 6. Selection of a competitive strain.
A Growth curves of 3610 (black) and 6153 (grey) in MSgg cultures at 30 °C. The three lines shown for each isolate represent separate biological repeats. B Biofilm footprint area of single-strain 3610 and 6153 biofilms. Data from 18 and 16 biofilms are shown for the 24 h and 48 h timepoint, respectively. C Competitive outcome data from colony biofilm assays of isogenic 6153 biofilms are shown after 24 h, 48 h and 72 h of incubation. Plotted are the technical repeats from one biological repeat. The full data set is presented in Supplementary Fig. S8A. D Flow cytometry data of mixed biofilms grown for 24, 48, and 72 h at 30 °C on MSgg media. Isolate names followed by ‘g’ represent strains constitutively producing  GFP, (green on the graph). Isolate names followed by ‘b’ indicate strains constitutively producing mTagBFP, (magenta on the graph). Three biological and three technical replicates were performed for each strain mix and timepoint and all data points are shown. The error bars represent the mean standard deviation. E Halo formation assays on MSgg agar plates at 24 h of growth. Strains producing mTagBFP (magenta) and GFP (green) are shown.
Fig. 7
Fig. 7. Experimental data for a non-isogenic strain pair with local antagonistic interactions.
A Example dual-strain biofilms (3610 labelled with GFP (green), 6153 labelled with mTagBFP (magenta)). Images taken after 72 h of incubation for two different founder densities. Scalebars as in Fig. 2. B Competitive outcome data for 3610 in the 3610/6153 pair after 24 h, 48 h and 72 h of biofilm incubation. Plotted are technical repeats from one biological repeat of the experiment. The full data set is presented in Supplementary Fig. S8B. C The relationship between AFS and competitive outcome for 6153. AFS1 was calculated based on images taken after 24 h of biofilm incubation, and competitive outcome after 48 h (top, n=22) and 72 h (bottom, n=17).

References

    1. Lopez D, Vlamakis H, Kolter R. Biofilms. Cold Spring Harb Perspect Biol. 2010;2:a000398. doi: 10.1101/cshperspect.a000398. - DOI - PMC - PubMed
    1. Flemming HC, Wingender J. The biofilm matrix. Nat Rev Microbiol. 2010;8:623–33. doi: 10.1038/nrmicro2415. - DOI - PubMed
    1. Branda SS, Vik S, Friedman L, Kolter R. Biofilms: the matrix revisited. Trends Microbiol. 2005;13:20–6. doi: 10.1016/j.tim.2004.11.006. - DOI - PubMed
    1. Davey ME, O’Toole GA. Microbial biofilms: from ecology to molecular genetics. Microbiol Mol Biol Rev. 2000;64:847–67. doi: 10.1128/MMBR.64.4.847-867.2000. - DOI - PMC - PubMed
    1. Hall-Stoodley L, Costerton JW, Stoodley P. Bacterial biofilms: from the natural environment to infectious diseases. Nat Rev Microbiol. 2004;2:95–108. doi: 10.1038/nrmicro821. - DOI - PubMed

Publication types