. 2021 Sep;2(9):932-949.
doi: 10.1038/s43018-021-00238-0. Epub 2021 Aug 16.

Targeting PUS7 suppresses tRNA pseudouridylation and glioblastoma tumorigenesis

Affiliations

Targeting PUS7 suppresses tRNA pseudouridylation and glioblastoma tumorigenesis

Qi Cui et al. Nat Cancer. 2021 Sep.

Abstract

Pseudouridine is the most frequent epitranscriptomic modification. However, its cellular functions remain largely unknown. Here, we show that pseudouridine synthase 7 (PUS7) is highly expressed in glioblastoma versus normal brain tissues, and high PUS7 expression levels are associated with worse survival in patients with glioblastoma. PUS7 expression and catalytic activity are required for glioblastoma stem cell (GSC) tumorigenesis. Mechanistically, we identify PUS7 targets in GSCs through small RNA pseudouridine sequencing and show that pseudouridylation of PUS7-regulated transfer RNA is critical for codon-specific translational control of key regulators of GSCs. Moreover, we identify chemical inhibitors for PUS7 and show that these compounds prevent PUS7-mediated pseudouridine modification, suppress tumorigenesis and extend the life span of tumor-bearing mice. Overall, we identify an epitranscriptomic regulatory mechanism in glioblastoma and provide preclinical evidence of a potential therapeutic strategy for glioblastoma.


Conflict of interest statement

Conflict of interest statement

C. H is a scientific founder and a member of the scientific advisory board of Accent Therapeutics Inc. The other authors declare no conflict of interest.

Figures
Extended Data Fig. 1
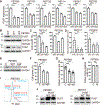
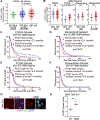
Extended Data Fig. 1. High level of PUS7 expression correlates with poor prognosis in GBM patients
(A) The expression of PUS7 in all glioma patients stratified by the IDH mutation status and 1p19q chromosome co-deletion status from the CGGA dataset (n=182 IDH mut 1p19q codel patients, n=315 IDH mut 1p19q noncodel patients, n=392 IDH WT patients). (B) The expressions of PUS7 in GBM patients stratified by IDH mutation status or GCIMP status from the CGGA (n=90 Mut patients and n=288 WT patients), TCGA (n=8 Mut patients and n=142 WT patients), Gravendeel (n=33 Mut patients and n=95 WT patients), and Rembrandt (n=11 GCIMP patients and n=208 Non-GCIMP patients) datasets. (C-F) Kaplan-Meier survival curves with log-rank analysis to assess the correlation between PUS7 expression and overall survival of IDH WT GBM patients in the CGGA dataset (C), TCGA dataset (E), and Gravendeel dataset (F) or non GCIMP GBM patients in the REMBRANDT dataset (D). (G) The expression of SOX2 and PUS7 in GBM patients and in non-tumor control samples in GBM tissue microarray analyzed by immunohistochemistry (IHC). Scale bar: 10 μm. (H) Quantification of the expression level of PUS7 in GBM patients and in non-tumor control samples analyzed by IHC. n = 34 individuals for GBM patients and 5 individuals for non-tumor control group. Error bars represent SD of the mean for panels A and B. Error bars represent SE of the mean for panel H. Two-tailed Student’s t test for panels A and B (ns: not statistically significant. p=0.2844 for CGGA, p=0.1533 for Gravendeel, and p=0.1095 for Rembrandt). **p<0.01 (p=0.002) by one-tailed Student’s t-test for panel H.
Extended Data Fig. 2
Extended Data Fig. 2. PUS7 regulates GSC growth and self-renewal
(A) RT-PCR analysis of PUS7 knock down (KD) in GSCs (PBT003, PBT707, PBT726, PBT111, PBT017, and PBT030) transduced with lentivirus expressing control shRNA (shC) or PUS7 shRNA (sh1 and sh2). n=3 technical replicates. p=0.0002 for sh1 and p=0.0002 for sh2 in PBT003; p=0.0005 for sh1 and p=0.0004 for sh2 in PBT707; p=0.0008 for sh1 and p=0.0066 for sh2 in PBT726; p=0.0003 for sh1 and p<0.0001 for sh2 in PBT111; p=0.0009 for sh1 and p=0.0004 for sh2 in PBT017; p<0.0001 for sh1 and p<0.0001 for sh2 in PBT030. (B) Western blot analysis of PUS7 KD in GSCs (PBT003 and PBT726). The uncropped blot images for the cropped images shown here are in the source data. Repeated twice with similar results. (C) Cell growth of GSCs (PBT017 and PBT030) transduced with lentivirus expressing control shRNA (shC) or PUS7 shRNA (sh1 and sh2). n=4 cell culture replicates. p<0.0001 for sh1 and p<0.0001 for sh2 in PBT017; p<0.0001 for sh1 and p=0.0013 for sh2 in PBT030. (D) Sphere formation of GSCs (PBT017 and PBT030) transduced with lentivirus expressing shC or PUS7 shRNA (sh1 and sh2). n=4 cell culture replicates. p=0.006 for sh1 and p=0.006 for sh2 in PBT017; p=0.0063 for sh1 and p=0.0063 for sh2 in PBT030. (E) Western blot analysis of PUS7 in PBT003 GSCs transduced with lentivirus expressing control sgRNA or sgRNA for PUS7 (sg1 and sg2). The uncropped blot images for the cropped images shown here are in the source data. Repeated four times with similar results. (F) Cell growth of PBT003 GSCs transduced with lentivirus expressing control sgRNA or sgRNA for PUS7. n=4 cell culture replicates. p=0.0043 for sg1 and p=0.0009 for sg2. (G) Sphere formation of PBT003 GSCs transduced with lentivirus expressing control sgRNA or sgRNA for PUS7. n=20 sphere-forming culture replicates. (H) Active Caspase 3 (Cas3) analysis of PBT003 GSCs transduced with lentivirus expressing control sgRNA or sgRNA for PUS7. p<0.0001 for sg1 and p<0.0001 for sg2. n=5 cell culture replicates. (I) Cell cycle analysis of PBT003 GSCs transduced with lentivirus expressing control sgRNA or sgRNA for PUS7. (J) Western blot analysis showing overexpression of the WT and the mutant PUS7 in PBT003 and PBT707 GSCs. The uncropped blot images for the cropped images shown here are in the source data. Repeated three times with similar results. Error bars are SE of the mean for this figure. **p<0.01 and ***p<0.001 by One-way ANOVA and Dunnett’s multiple comparisons test for panels A, C, D, F, and G. ns: not statistically significant (p=0.1372) by one-tailed Student’s t-test for panel H.
Extended Data Fig. 3
Extended Data Fig. 3. PUS7 regulates GSC growth in a catalytic activity dependent manner
The WT but not the mutant (Mut) PUS7 rescued PUS KD-induced growth inhibition in PBT003 and PBT707 GSCs. n=4 cell culture replicates. p<0.0001 for shPUS7 (−) and PUS7 (−) vs shPUS7 (+) and PUS7 (−), p<0.0001 for shPUS7 (+) and PUS7 (−) vs shPUS7 (+) and WT PUS7 (+), ns: p=0.7179 for shPUS7 (+) and PUS7 (−) vs shPUS7 (+) and Mut PUS7 (+) in PBT003; p<0.0001 for shPUS7 (−) and PUS7(−) vs shPUS7 (+) and PUS7(−), p<0.0001 for shPUS7 (+) and PUS7 (−) vs shPUS7 (+) and WT PUS7 (+), ns: p=0.9976 for shPUS7 (+) and PUS7 (−) vs shPUS7 (+) and Mut PUS7 (+) in PBT707. Error bars are SE of the mean for this figure. ***p<0.001 and ns: not statistically significant (p>0.05, defined above) by One-way ANOVA and Dunnett’s multiple comparisons test for this figure.
Extended Data Fig. 4
Extended Data Fig. 4. Inhibition of PUS7 suppresses tumor progression
(A) Bioluminescent images of brain tumors in NSG mice transplanted with PBT003 GSCs that were transduced with control sgRNA (Control-sg) or PUS7 sgRNA (PUS7-sg). (B) Quantification of the bioluminescence intensity of tumors after PBT003 GSC transplantation. n=5 mice for each group. Error bars represent SE of the mean. *p<0.05 (p=0.037) by one-tailed Student’s t-test. (C) The survival curves of NSG mice transplanted with PBT003 GSCs transduced with control sgRNA or PUS7 sgRNA. n=5 mice for each group. The X axis represents days after GSC transplantation. Log-rank test for mice survival.
Extended Data Fig. 5
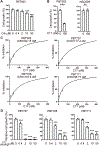
Extended Data Fig. 5. PUS7 inhibitors suppress GSC growth
(A) Cell growth of PBT003 GSCs treated with the C4 PUS7 inhibitor. n=4 cell culture replicates. p=0.0009 for 10 μM and p<0.0001 for 50 μM condition. (B) Cell growth of PBT003 GSCs or NSC009 NSCs treated with the C17 PUS7 inhibitor. n=4 cell culture replicates. p<0.0001 for PBT003 and ns: p=0.2831 for NSC009. (C) IC50 test for C17 compound in GSCs (PBT003, PBT707, PBT726, and PBT111). For each GSC, n=4 cell culture replicates for each treatment condition. (D) Cell growth of GSC (PBT707, PBT726, and PBT111) treated with the C17 analog compound. n=4 cell culture replicates. p=0.0002, <0.0001, <0.0001, <0.0001 for 0.4, 2, 10, 50 μM conditions respectively in PBT707; p<0.0001 for 2, 10, 50 μM conditions in PBT726; p<0.0001 for 2, 10, 50 μM conditions in PBT111. Error bars are SE of the mean. ***p<0.001 by One-way ANOVA and Dunnett’s multiple comparisons test for panels A and D. ***p<0.001 and ns: not statistically significant (p>0.05, defined above) by one-tailed Student’s test for panel B.
Extended Data Fig. 6
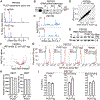
Extended Data Fig. 6. The pseudouridine modification profile in GSCs
(A) A representative PUS7-dependent pseudouridine site identified by small RNA DM-Ψ-seq in PBT003 GSCs. (B) Validation of the PUS7-dependent pseudouridine site in tRNA-Arg-CCG-2–1 in PUS7 KO PBT003 GSCs by primer extension assay. The uncropped blot images for the cropped images shown here are in the source data. Repeated twice with similar results. (C) A representative PUS7-dependent pseudouridine site in tRNA-Glu-TTC-4–1 in control or C17-treated PBT003 GSCs. (D) Pearson correlation analysis for global tRNA abundance in control and PUS7 KO PBT003 GSCs. (E) Expression of tRNA-Arg-CCG in control and PUS7 KO PBT003 GSCs examined by Northern blot analysis. U6 was used as a loading control. The uncropped blot images for the cropped images shown here are in the source data. Repeated twice with similar results. (F) Analysis of tRF abundance in control and PUS7 KO PBT003 GSCs. Red dots: tRFs derived from tRNAs with PUS7-dependent pseudouridine sites. The q value was calculated by Cochran Mantel Haenszel test and adjusted by BH methods. (G) The OP-puro incorporation analysis of control and PUS7 KO PBT707 GSCs. (H) Nascent protein synthesis and total protein level analysis of control and PUS7 KO 293T cells. (I) A luciferase reporter assay to test tRNA translation efficiency in control and PUS7 KO PBT707 cells. n=3 cell culture replicates. Error bars are SE of the mean. *p<0.05 (p=0.0251), and ns: not statistically significant [p>0.05, p=0.0921 for control, p=0.0251 for 6x(CGG)Arg, and p=0.1238 for 6x(CGA)Arg] by one-tailed Student’s t-test.
Extended Data Fig. 7
Extended Data Fig. 7. PUS7 regulates IFN pathway in GSC
(A) Correlation analysis of PUS7 expression and IFN gene signature (IFN alpha response gene signature and IFN gamma response gene signature) analyzed by ssGSEA in GBM patients from the TCGA dataset. (B) The growth of PBT003 and PBT707 GSCs treated with IFNα. n=4 cell culture replicates. p=0.0093 for 20 ng/ml and p=0.0002 for 100 ng/ml in PBT003; p=0.0064, <0.0001, <0.0001 for 4, 20, 100 ng/ml conditions, respectively, in PBT707. (C) RT-PCR of ISGs in C17 compound-treated PBT003 GSCs. n=3 technical replicates. p=0.0041 for ISG15 and p=0.0015 for XAF1. (D) RT-PCR of ISGs in C17 compound-treated tumor derived from PBT003 GSCs. n=3 technical replicates. p=0.0004 for ISG15 and p=0.0001 for XAF1. Error bars are SE of the mean. **p<0.01 and ***p<0.001 by One-way ANOVA and Dunnett’s multiple comparisons test for panels B, and by one-tailed Student’s t-test for panels C and D.
Extended Data Fig. 8
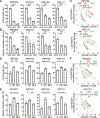
Extended Data Fig. 8. PUS7 regulates GSC growth through controlling TYK2-mediated IFN pathway
(A) RT-PCR analysis of WT or mutant TYK2 in PUS7 KO PBT003 GSCs. n=3 technical replicates. p=0.1533 for WT and p=0.0719 for Mut. (B) RT-PCR analysis of WT or mutant TYK2 in PUS7 KO PBT707 GSCs. n=3 technical replicates. p=0.0617 for WT and p=0.0625 for Mut. (C) Western blot analysis of WT or mutant TYK2 in PUS7 KO PBT707 GSCs. The uncropped blot images for the cropped images shown here are in the source data. Repeated twice with similar results. (D) Western blot analysis of TYK2 in TYK2 KO PBT003 and PBT707 GSCs. The uncropped blot images for the cropped images shown here are in the source data. Repeated twice with similar results. (E) Western blot analysis of STAT1 and phosphorylated STAT1 (pSTAT1) in STAT1 KO PBT003 and PBT707 GSCs. The uncropped blot images for the cropped images shown here are in the source data. Repeated twice with similar results. (F) Western blot of PUS7 and TYK2 in PBT003 GSCs transduced with lentivirus expressing PUS7 sgRNA and/or lentivirus expressing sgRNA for TYK2. The uncropped blot images for the cropped images shown here are in the source data. Repeated twice with similar results. (G) The growth of PBT003 and PBT707 GSCs treated by the STAT1 inhibitor fludarabine with or without lentivirus expressing PUS7 sgRNA. n=4 cell culture replicates. p=0.0003 for PUS7sg (−) and STAT1 inhibitor (−) vs PUS7sg (+) and STAT1 inhibitor (−), p=0.0144 for PUS7sg (+) and STAT1 inhibitor (+) vs PUS7sg (+) and STAT1 inhibitor (−) in PBT003; p=0.0004 for PUS7sg (−) and STAT1 inhibitor (−) vs PUS7sg (+) and STAT1 inhibitor (−), p=0.0114 for PUS7sg (+) and STAT1 inhibitor (+) vs PUS7sg (+) and STAT1 inhibitor (−) in PBT707. Error bars are SE of the mean. *p<0.05, ***p<0.001, and ns: not statistically significant (p>0.05) by One-way ANOVA and Dunnett’s multiple comparisons test for panels G, and by one-tailed Student’s t-test for panels A and B.
Figure 1
Figure 1. PUS7 is highly expressed in GBM patients.
(A) The expression of PUS7 in GBM patients and non-tumor control samples from the REMBRANDT (n=28 non-tumor samples and n=219 GBM samples), TCGA (n=4 non-tumor samples and n=156 GBM samples), and Gravendeel (n=8 non-tumor samples and n=159 GBM samples) datasets. (B) The expression of PUS7 in all glioma patients stratified by IDH mutation status and 1p19q chromosome co-deletion status from the TCGA dataset (n=169 IDH mut 1p19q codel patients, n=258 IDH mut 1p19q noncodel patients, n=229 IDH WT patients). (C) The expression of PUS7 in GBM patients stratified by the status of PUS7 copy number variation (n=26 diploid patients and n=120 gain patients), gain of chromosome 7 and loss of chromosome 10 (n=50 patients for negative group and n=96 patients for positive group), or gain of chromosome 19 and 20 (n=127 patients for negative group and n=19 patients for positive group) in the TCGA dataset. (D) The expression of PUS7 in GBM patients and in non-tumor control samples analyzed by Western blot. The uncropped blot images for the cropped images shown here are in the source data. Repeated twice with similar results. (E) The expressions of PUS7 in GSCs, NSCs, established GBM lines, and astrocytes (hAS: primary human astrocytes; iPSC1-AS and iPSC2-AS: human iPSC-derived astrocytes) analyzed by Western blot. The uncropped blot images for the cropped images shown here are in the source data. Repeated twice with similar results. (F) Quantification of PUS7 expression in GBM patients and in non-tumor control samples analyzed by Western blot. n = 9 GBM patients and 10 non-tumor control subjects. p=0.0001. (G) Quantification of the expression level of PUS7 in 4 lines of GSCs, 2 lines of NSCs, 3 established GBM lines, and 3 lines of astrocytes analyzed by Western blot. Error bars are SD of the mean for A-C. p=0.0212 for GSCs vs NSCs, p=0.0226 for GSCs vs astrocytes. p value was determined by two-tailed Student’s t-test for A-C. ns: not statistically significant (p=0.2626 for gain of chromosome 19 and 20 in C). Error bars represent SE of the mean for panels F and G. ***p<0.001 by one-tailed Student’s t-test for panel F. *p<0.05 by One-way ANOVA and Dunnett’s multiple comparisons test for panel G. See also Extended Data Figure 1.
Figure 2
Figure 2. PUS7 regulates GSC growth and self-renewal.
(A) Cell growth of GSCs (PBT003, PBT707, PBT726, and PBT111) transduced with lentivirus expressing control shRNA (shC) or PUS7 shRNA (sh-1 and sh-2). n=4 cell culture replicates. p<0.0001 for PBT003, PBT707, and PBT111; p=0.0003 for PBT726-sh1, and p<0.0001 for PBT726-sh2. (B) Sphere formation of GSCs transduced with lentivirus expressing control shRNA (shC) or PUS7 shRNA (sh1 and sh2). n=4 cell culture replicates. p<0.0001 for PBT003; p=0.0428 for PBT707-sh1, p=0.0231 for PBT707-sh2; p=0.0002 for PBT726-sh1, p<0.0001 for PBT726-sh2; p=0.0005 for PBT111-sh1, and p=0.0002 for PBT111-sh2. (C) Limiting dilution assay (LDA) of GSCs transduced with lentivirus expressing control shRNA (shC) or PUS7 shRNA (sh1 and sh2). (D) The growth of GSCs transduced with lentivirus expressing the WT or the mutant PUS7. n=4 cell culture replicates. p=0.0015 for PBT003-C, p=0.0067 for PBT003-Mut; p<0.0001 for PBT707 and PBT726; p=0.0002 for PBT111-C, and p=0.0011 for PBT111-Mut. (E) Sphere formation of GSCs transduced with lentivirus expressing the WT or the mutant PUS7. n=4 cell culture replicates. p<0.0001 for PBT003; p=0.0145 for PBT707-C, p=0.0018 for PBT707-Mut; p=0.0002 for PBT726-C, p=0.0007 for PBT726-Mut; p=0.0001 for PBT111-C, and p<0.0001 for PBT111-Mut. (F) LDA of GSCs transduced with lentivirus expressing the WT or the mutant PUS7 controls. Error bars are SE of the mean for panels A, B, D and E. *p<0.05, **p<0.01, and ***p<0.001 by One-way ANOVA and Dunnett’s multiple comparisons test for panels A, B, D and E. p value for the LDA assay in panels C and F was provided by the ELDA webtool analysis. See also Extended Data Figure 2 and 3.
Figure 3
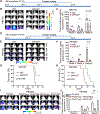
Figure 3. Reduction of PUS7 expression suppresses tumor progression.
(A) Schematic of the experimental design, including PBT707 GSC transplantation and bioluminescent imaging of xenografted tumors. (B) Bioluminescent images of brain tumors in NSG mice transplanted with PBT707 GSCs that were transduced with control shRNA (shC) or PUS7 shRNA (shPUS7). (C) Quantification of the bioluminescence intensity of tumors after PBT707 GSC transplantation. n=7 mice per group. p=0.0025 for week 4, p=0.0284 for week 6. (D) Schematic of the experimental design, including PBT003 GSC transplantation and bioluminescent imaging of xenografted tumors. (E) Bioluminescent images of brain tumors in NSG mice transplanted with PBT003 GSCs that were transduced with shC or shPUS7. (F) Quantification of the bioluminescence intensity of tumors after PBT003 GSC transplantation. n=7 mice for shC control and n=6 mice for shPUS7 group. p=0.0124 for week 4, p=0.0039 for week 5, and p=0.0002 for week 6. (G, H) The survival curve of NSG mice transplanted with PBT707 GSCs (G) or PBT003 GSCs (H) transduced with shC or shPUS7. The X axis represents days after GSC transplantation. n=7 mice for shC control and n=6 mice for shPUS7 group for panels G and H. (I) Bioluminescent images of brain tumors in NSG mice transplanted with PBT003 GSCs transduced with control sgRNA, or PUS7 sgRNA (PUS7-sg) with the WT or mutant PUS7. (J) Quantification of the bioluminescence intensity of tumors after PBT003 GSC transplantation. n=5 mice per group. p=0.0141 for PUS7-sg + PUS7 Mut group and p=0.9293 (ns) for PUS7-sg + PUS7 WT group for week 6. *p<0.05 by two-way ANOVA and Dunnett’s multiple comparisons test. Error bars are SE of the mean for panels C, F and J. *p<0.05, **p<0.01, and ***p<0.001 by one-tailed Student’s t test for panels C and F. Log-rank test for panels G and H. See also Extended Data Figure 4.
Figure 4
Figure 4. PUS7 inhibitors suppress GSC growth.
(A) Mass spectrometry (MS)-based PUS7 activity assay for screening PUS7 inhibitors. PseU: pseudouridine. (B) The dose effect of the C17 PUS7 inhibitor on the growth of PBT003 GSCs. A dose range of 0 to 50 μM was tested. n=4 cell culture replicates. p<0.0001 for all doses tested compared to 0 μM condition. (C) The effect of the C17 PUS7 inhibitor on the growth of multiple GSC lines (PBT003, PBT707, PBT726, and PBT111) in nM dose range. A dose range of 0 to 400 nM was tested. n=4 cell culture replicates. p=0.0143, 0.0004, and <0.0001 for 4, 40, and 400 nM conditions, respectively, in PBT003; p=0.0001, <0.0001 for 40, 400 nM conditions, respectively, in PBT707; p=0.0005, <0.0001, <0.0001 for 4, 40, and 400 nM conditions, respectively, in PBT726; p<0.0001, <0.0001, and <0.0001 for 4, 40, and 400 nM conditions, respectively, in PBT111. (D) The effect of the C17 PUS7 inhibitor on the growth of NSC006 cells. n=4 cell culture replicates. p<0.0001 for 400 nM condition in NSC006. (E) The growth of PBT707 GSCs treated with the C17 compound and lentivirus expressing control sgRNA or sgRNA for PUS7. n=4 cell culture replicates. p<0.0001 for all conditions compared to C17 (−) and PUS7-sg (−) condition. ns: p=0.6619. (F) Rescue of the growth inhibitory effect of C17 by the WT but not the mutant PUS7. n=4 cell culture replicates. p=0.0004 for C17 (−) and PUS7(−) vs C17 (+) and PUS7(−), p=0.0001 for C17 (+) and PUS7 (−) vs C17 (+) and WT PUS7 (+), p=0.9383 for C17 (+) and PUS7 (−) vs C17 (+) and Mut PUS7 (+), p<0.0001 for C17 (+) and WT PUS7 (+) vs C17 (+) and Mut PUS7 (+). (G) The dose effect of the C17 analog on the growth of PBT003 GSCs. n=4 cell culture replicates. p<0.0001 for 2, 10, and 50 μM conditions. (H) Pseudouridine levels in GSCs treated by C17 measured by MS. n=3 RNA sample replicates. p=0.0035 for PBT003, p=0.0006 for PBT707, p=0.0042 for PBT726, and p=0.0014 for PBT111. (I) Pseudouridine levels in GSCs treated by the C17 analog measured by MS. n=3 RNA sample replicates. p=0.0008 for PBT003 and p=0.0032 for PBT111. Error bars are SE of the mean. *p<0.05, **p<0.01, and ***p<0.001 by One-way ANOVA and Dunnett’s multiple comparisons test for panels B-D and G, by One-way ANOVA and Tukey’s multiple comparisons test for panels E-F, by one-tailed Student’s t test for panels H and I. See also Extended Data Figure 5.
Figure 5
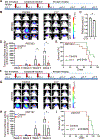
Figure 5. The PUS7 inhibitor suppresses tumor progression.
(A) Schematic of the experimental design, including PBT003 GSC transplantation, C17 compound treatment, and bioluminescent imaging of xenografted tumors. (B) Bioluminescent images of brain tumors in NSG mice treated with the C17 compound or vehicle control. (C) Quantification of the bioluminescence intensity of tumors in NSG mice treated with C17 or vehicle control. n=5 mice for control and n=8 mice for the C17 group. p=0.0323 for week 6 and p=0.0269 for week 7. (D) Pseudouridine levels in GSC-derived tumors treated by C17 measured by MS. n=3 RNA sample replicates. p=0.0398. (E) The survival curve of NSG mice treated with C17 or vehicle control. The X axis represents days after treatment. n=11 mice per group. (F) Schematic of the experimental design, including PBT707 GSC transplantation, C17 compound treatment, and bioluminescent imaging of xenografted tumors. (G) Bioluminescent images of brain tumors in NSG mice treated with vehicle control or the C17 compound. (H) Quantification of the bioluminescence intensity of tumors in NSG mice treated with vehicle control or the C17 compound. n=5 mice per group. p=0.0267 for week 9. (I) The survival curve of NSG mice treated with vehicle control or the C17 compound. The X axis represents days after treatment. n=5 mice per group. Error bars are SE of the mean for panels C, D and H. *p<0.05 by one-tailed Student’s t test for panels C, D and H. Log-rank test for panels E and I.
Figure 6
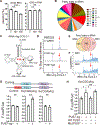
Figure 6. Pseudouridine modification profile in small RNAs.
(A) The pseudouridine (pseU) levels in small RNAs and >200 nt RNAs in PBT003 GSCs transduced with lentivirus expressing Cas9 and control sgRNA (C) or PUS7 sgRNA (sg1 and sg2). n=3 RNA sample replicates. p=0.0025 for sg1 and p<0.0001 for sg2. (B) Pseudouridine (PseU) sites in tRNAs in GSCs. ns: p=0.9341 for sg1 and p=0.966 for sg2. (C) Schematics of tRNA-Arg-CCG showing pseudouridine sites Ψ 27, Ψ 55 and PUS7-dependent pseudouridine site Ψ 50 (red). (D) A representative PUS7-dependent pseudouridine site identified by small RNA DM-Ψ-seq in GSCs. (E) PseU sites in tRNAs in GSCs and NSCs. (F) A representative PUS7-dependent pseudouridine site in GSCs compared to NSCs. (G) KO of PUS7 induces Arg (CGG) codon-dependent increase of translation revealed by firefly luciferase (F-luc) assay. Renilla luciferase (R-luc) was included as a normalization control. n=3 cell culture replicates. p=0.0852 (ns) for control, p=0.0011 for 6x(CGG)Arg, and p=0.2183 (ns) for 6x(CGA)Arg. (H) The WT but not the mutant (mut) PUS7 could reverse PUS KO-induced Arg (CGG) codon-dependent translation. n=3 cell culture replicates. p=0.0379 for PUS7 sg (−) and PUS7 (−) vs PUS7 sg (+) and PUS7 (−), p=0.0415 for PUS7 sg (+) and PUS7 (−) vs PUS7 sg (+) and WT PUS7 (+), and p=0.762 (ns) for PUS7 sg (+) and PUS7 (−) vs PUS7 sg (+) and Mut PUS7 (+). Error bars are SE of the mean for panels A,G, and H. *p<0.05, **p<0.01, and ***p<0.001, and ns: not statistically significant (p>0.05) by One-way ANOVA and Dunnett’s multiple comparisons test for panels A and H, by one-tailed Student’s t test for panel G. See also Extended Data Figure 6.
Figure 7
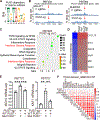
Figure 7. PUS7 regulates IFN pathway in GSC.
(A) A putative motif for PUS7-dependent pseudouridine sites in mRNAs in PBT003 GSCs. (B) Representative PUS7-dependent pseudouridine sites identified in mRNAs in PBT003 GSCs. (C) Gene set enrichment analysis of hallmark pathways enriched in PUS7 KO PBT003 GSCs from RNA-seq. (D) Heatmap showing ISG mRNA expression level change in PUS7 KO PBT003 GSCs. (E) RT-PCR of ISGs in PUS7 KO PBT707 cells with overexpression of the WT or the mutant PUS7. n=6 technical replicates for ISG15 and n=3 technical replicates for XAF1. p<0.0001 for PUS7 sg (−) and PUS7 (−) vs PUS7 sg (+) and Mut PUS7 (+), p=0.0009 for PUS7 sg (+) and WT PUS7 (+) vs PUS7 sg (+) and Mut PUS7 (+) for ISG15; p=0.0031 for PUS7 sg (−) and PUS7 (−) vs PUS7 sg (+) and Mut PUS7 (+), and p=0.0098 for PUS7 sg (+) and WT PUS7 (+) vs PUS7 sg (+) and Mut PUS7 (+) for XAF1. Error bars are SE of the mean. **p<0.01 and ***p<0.001 by One-way ANOVA and Dunnett’s multiple comparisons. (F) Correlation analysis of PUS7 expression and ISG gene expression in GBM IDH WT patients from the TCGA dataset. The degree of correlation was indicated by the size and color of the dots with bigger dots of higher intensity indicating a higher degree of correlation. Wells with dots indicate a significant (p<0.05) correlation, whereas blank wells indicate a non-significant (p>0.05) correlation. See also Extended Data Figure 7.
Figure 8
Figure 8. PUS7 regulates GSC growth through controlling TYK2-mediated IFN pathway.
(A) TMT mass spectrometry analysis of gene expression change at the protein level in PUS7 KO PBT003 GSCs. TYK2 (red dot), a regulator of IFN pathway, was up-regulated in PUS7 (blue dot) KO PBT003 GSCs, among significantly changed proteins (green dots). The IFN-TYK2 pathway was illustrated on the right. (B) Heatmap showing TMT mass spectrometry analysis of gene expression change at the protein level in PUS7 KO PBT003 GSCs. (C) RT-PCR of TYK2 in PUS7 KO GSCs. n=3 technical replicates. ns: not statistically significant (p=0.3967 for PBT003 and p=0.3445 for PBT707) by one-tailed Student’s t test. (D) Western blot of TYK2 in PUS7 KO GSCs. The uncropped blot images for the cropped images shown here are in the source data. Repeated three times with similar results. (E) Western blot of STAT1 and phosphorylated STAT1 (pSTAT1) in PUS7 KO GSCs. The uncropped blot images for the cropped images shown here are in the source data. Repeated twice with similar results. (F) Codon bias analysis of tRNA usage for TYK2 gene. (G) Polysome profiling analysis for TYK2 in PUS7 KO PBT003 GSCs. n=3 technical replicates. p=0.000538, 0.000069, and 0.001196 for fractions 10, 11, 12 respectively. (H) Western blot of the Flag-tagged WT or mutant TYK2 fragment in PUS7 KO GSCs. The uncropped blot images for the cropped images shown here are in the source data. Repeated twice with similar results. (I) Cell growth of GSCs transduced with lentivirus expressing control sgRNA (−) or sgRNA for TYK2 (TYK2-sg) or STAT1 (STAT1-sg). n=4 cell culture replicates. p=0.0025 for TYK2-sg in PBT003, p=0.0101 for STAT1-sg in PBT003; p<0.0001 for TYK2-sg in PBT707, and <0.0001 for STAT1-sg in PBT707. (J) Cell growth of GSCs transduced with lentivirus expressing sgRNA for PUS7 and transduced with lentivirus expressing sgRNA for TYK2 or STAT1. n=3 cell culture replicates for PBT003, n=4 cell culture replicates for PBT707. p=0.0012 for PUS7 sg (−) vs PUS7 sg (+), p=0.004 for PUS7 sg (+) vs PUS7 sg (+) and TYK2 sg (+), p=0.0005 for PUS7 sg (+) vs PUS7 sg (+) and STAT1 sg (+) in PBT003. p<0.0001 for PUS7 sg (−) vs PUS7 sg (+), PUS7 sg (+) vs PUS7 sg (+) and TYK2 sg (+), and PUS7 sg (+) vs PUS7 sg (+) and STAT1 sg (+) in PBT707. Error bars are SE of the mean for panels C, G, I, and J. *p<0.05, **p<0.01, and ***p<0.001by One-way ANOVA and Dunnett’s multiple comparisons test for I and J, by multiple Student’s t test for panel G. See also Extended Data Figure 8.

Comment in

  • A therapy PUSh for GBM.
    Morón-Calvente V, Blanco S. Morón-Calvente V, et al. Nat Cancer. 2021 Sep;2(9):876-878. doi: 10.1038/s43018-021-00255-z. Nat Cancer. 2021. PMID: 35121866 No abstract available.

References

    1. Machnicka MA, et al. MODOMICS: a database of RNA modification pathways−−2013 update. Nucleic acids research 41, D262–267 (2013). - PMC - PubMed
    1. Nachtergaele S. & He C. Chemical Modifications in the Life of an mRNA Transcript. Annu Rev Genet 52, 349–372 (2018). - PMC - PubMed
    1. Wu G, Yu AT, Kantartzis A. & Yu YT Functions and mechanisms of spliceosomal small nuclear RNA pseudouridylation. Wiley Interdiscip Rev RNA 2, 571–581 (2011). - PMC - PubMed
    1. Charette M. & Gray MW Pseudouridine in RNA: what, where, how, and why. IUBMB life 49, 341–351 (2000). - PubMed
    1. Davis FF & Allen FW Ribonucleic acids from yeast which contain a fifth nucleotide. The Journal of biological chemistry 227, 907–915 (1957). - PubMed

Publication types