. 2021 Oct;2(10):1018-1038.
doi: 10.1038/s43018-021-00263-z. Epub 2021 Oct 22.

RNF2 ablation reprograms the tumor-immune microenvironment and stimulates durable NK and CD4+ T-cell-dependent antitumor immunity

Affiliations

RNF2 ablation reprograms the tumor-immune microenvironment and stimulates durable NK and CD4+ T-cell-dependent antitumor immunity

Zhuo Zhang et al. Nat Cancer. 2021 Oct.

Abstract

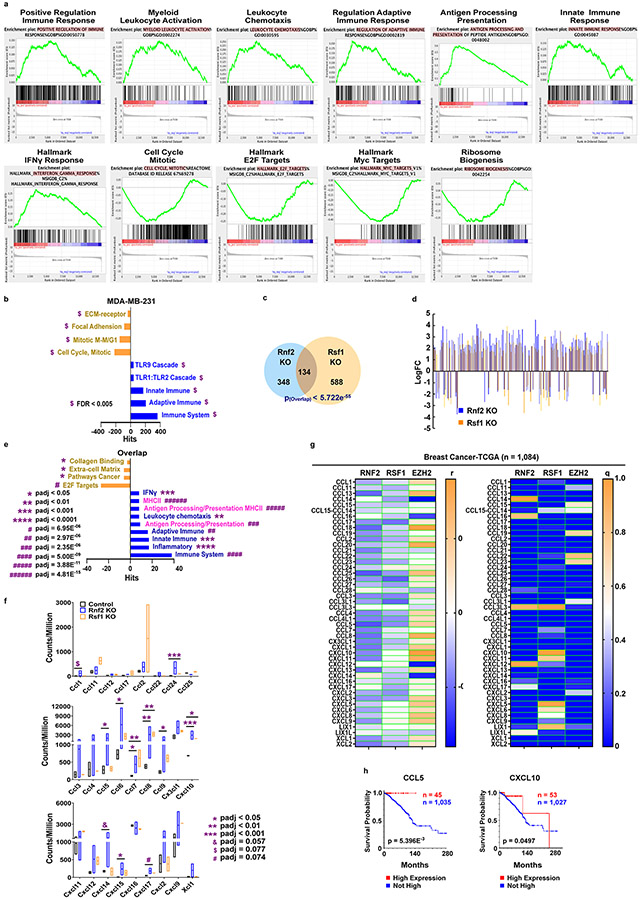
Expanding the utility of immune-based cancer treatments is a clinical challenge due to tumor-intrinsic factors that suppress the immune response. Here we report the identification of tumoral ring finger protein 2 (RNF2), the core subunit of polycomb repressor complex 1, as a negative regulator of antitumor immunity in various human cancers, including breast cancer. In syngeneic murine models of triple-negative breast cancer, we found that deleting genes encoding the polycomb repressor complex 1 subunits Rnf2, BMI1 proto-oncogene, polycomb ring finger (Bmi1), or the downstream effector of Rnf2, remodeling and spacing factor 1 (Rsf1), was sufficient by itself to induce durable tumor rejection and establish immune memory by enhancing infiltration and activation of natural killer and CD4+ T cells, but not CD8+ T cells, into the tumor and enabled their cooperativity. These findings uncover an epigenetic reprogramming of the tumor-immune microenvironment, which fosters durable antitumor immunity and memory.


Figures

Extended Data Fig. 1
Extended Data Fig. 1. RNF2 marks the signature of immunologically cold tumors and is negatively associated with cytotoxicity of immune cells.
a. GSEA analysis of the gene signature of cold tumor (noted as T cell exclusion) revealed in single cell RNAseq of tumor cells from melanoma patients using oncogenic gene sets (C6). Gene sets related to epigenetic pathways are shown. n = 7,186 single tumor cells from 33 human melanoma tumors (from 31 patients). b-c. The ranking of 248 (b) or 524 (c) epigenetic regulators based on their median expression levels in relation to the high and low expression of “cold” gene signature, extracted from the dataset in panel a via the Single Cell Portal. Each value at the y-axis for each gene is defined as its median expression level in the single tumor cells with high expression of cold gene signature minus that in the tumor cells with low expression of cold gene signature. These values were used to sort and plot corresponding genes on a two-dimensional plane. The x-axis denotes the rank of these genes. RNF2 is ranked as the top 4th/3rd gene. The number (n) of single tumor cells included in this single cell RNAseq is noted. d-f. Analysis of genes extracted from TCGA datasets. Heatmaps (Left) with the top parts zoomed in (Right) show correlations between expression levels of 248 epigenetic genes with the immune cell cytotoxicity gene signature, GZMA and PRF1, in diverse human cancers. The expression levels of these genes are extracted from TCGA. The coefficients (r) (d), and p values of these correlations (e) are shown. The zoomed in images of the top parts of the graph are shown in the right. f. The volcano plot shows the correlation of RNF2 to GZMA and PRF1 in human cancers. The y-axis and x-axis denote Log10(FDR) and coefficients (r) of correlations, respectively. The case numbers (n) are noted. n = 11,160 patients.
Extended Data Fig. 2
Extended Data Fig. 2. RNF2/CBX2/CBX8/RSF1 is amplified/overexpressed in human breast cancer patients, and associated with shorter survival time.
a. The box plot shows the expression levels of RNF2 in human normal breast tissue, invasive breast cancer tissues (Left) and triple negative breast cancer (TNBC) tissues (Right). Log2 fold change (Log2Fold) of cancer tissues relative to normal tissues and significance (p) of the correlations are displayed. The lower and upper bound of box plot represent the first quartile (Q1, 25% of data) and third quartile (Q3, 75% of data) of the data. Center line within the box represents the median value (also the second quartile). The whisker marks 1.5*IQR (Inter Quartile Range, the distance between Q1 and Q3) at both side of the box. Dots are the outliers, which are the values outside the whiskers (> Q3 + 1.5*IQR or < Q1 - 1.5*IQR). Normal controls for breast cancer patients: n = 125; breast cancer patients: n = 1,097; normal controls for TNBC patients: n = 112; TNBC patients: n = 123. b. The percentages of primary invasive breast cancer (BRCA), primary TNBC and metastatic breast cancer patients with RNF2 amplification. The numbers of patients (n) are indicated. c. Images with patient IDs from The Human Protein Atlas (http://www.proteinatlas.org) display the expression of RNF2 protein in normal breast tissues and human breast cancer tissues by immunohistochemistry staining. Scale bars: 100 (Upper)/50 (Bottom) μm. The website link for each image is provided in the Resources Table. d. The percentages of invasive breast cancer patients (n = 1,981) with the gain and amplification of RSF1, obtained from the METABRIC dataset via cBioPortal. e. Images with patient IDs from The Human Protein Atlas (http://www.proteinatlas.org) display the expression of RSF1 protein in normal breast tissues and human breast cancer tissues by immunohistochemistry staining. Scale bars: 100 (Upper)/50 (Bottom) μm. The website link for each image is provided in the Resources Table. f. The percentages of breast cancer patients with the amplification of CBX2 and CBX8 obtained from METABRIC dataset via cBioPortal. The numbers of patients (n) are indicated. g-i. The correlations of amplification of RNF2 (g) or Rsf1 (h) or CBX2/CBX8 (i) to the survival of invasive breast cancer patients (PanCancer Atlas) (g), or breast cancer patients (METABRIC dataset) (h, i) obtained from cBioPortal. P values are generated using two-tailed LogRank Test. The numbers of BRCA patients (n) with (red color) or without (blue color) amplification/amplification + gain of indicated gene are shown.
Extended Data Fig. 3
Extended Data Fig. 3. Targeting Rnf2/Rsf1 results in tumor rejection in syngeneic murine breast cancer models.
a-c. a. Immunoblots of indicated proteins in 4T1 cells transduced with the scrambled shRNA or two independent shRNAs targeting Rnf2 gene, which represents two independent experiments with similar results. The knockdown efficiency has been independently confirmed. b-c. The volumes (b) and representative BLIs at day 28 after inoculation (c) of tumors transduced with shRNAs as described in panel a (mean ± SEM, n = 5 mice/group, each mouse harboring one tumor) in mice. d. Immunoblots of indicated proteins in Ctrl and Rnf2 KO (two independent gRNAs, g1 and g2) EMT6 cells. The knockout efficiency was independently confirmed at least twice. e-h. e. Treating regimen. f. Tumor volumes of doxycycline inducible Rnf2 KO tumors at the indicated days after implantation in BALB/c mice. Tumor volumes were calculated by length X width2/2. g, h. The weights (g) and images (h) of the tumors at the end of the study. n = 4 mice for - Dox, n = 5 mice for + Dox, each mouse harboring one tumor. i-j. Immunoblots show the selective subunits of PRC1 complex interacting with Rnf2 that was immunoprecipitated from chromatin of 4T1 cells (i) or Rnf2 interacting with Cbx4 that was immunoprecipitated from whole cell lysates of 4T1 cells (j). Ft, Flowthrough, E, Elute, which represents two independent experiments with similar results. k. Immunoblots of Rsf1/β-actin in Ctrl and Rsf1 KO (two independent gRNAs, g1 and g2) 4T1 cells. The knockout efficiency was independently confirmed at least twice. l-q. l, m. The tumor volumes (mean ± SEM) in mice implanted with control or Rsf1 KO 4T1 tumor cells (guide 1 (n = 4 mice/group) (l) or guide 2 (n = 5 mice in control group, n = 4 mice in Rsf1 KO group) (each mouse harboring one tumor). (m). n-q. Representative tumor BLIs of tumors at day 22/47 after inoculation (n, o) or at longer time points (p, q). X, mice were sacrificed because of the big tumor burdens at the day when images were taken. r. The proliferation (mean of quadruplicates, n = 4 for technical replicates), (fold changes in cell numbers), of control or Rnf2 KO (g1 and g2) or Rsf1 KO (g1 and g2) 4T1 cells in vitro. Cell numbers at day 0 are set as 1. s-u. s. The volumes of control or Rnf2 KO 4T1 tumors (g1 and g2) implanted into the 4th mammary pads of the immuno-compromised NOD-Prkdcem26Cd52Il2rgem26Cd22/NjuCrl (NCG) mice. Mean ± SEM (n = 5 mice/group, each mouse harboring one tumor). t-u. The volumes of control tumors or Rnf2 KO 4T1 tumors ((g1) (t) or (g2) (u)) implanted into the immuno-compromised NCG mice (as in panel s) or immune competent BALB/c mice (as in Fig. 1b-c). Mean ± SEM (n = 5 mice/group, each mouse harboring one tumor). v. Numbers of total cells and of intratumoral immune cells of 4T1 tumors (Ctrl, Rnf2 KO and Rsf1 KO) displayed in Fig. 2a-b. n = 6 mice for Ctrl /Rnf2 KO; n = 5 mice for Rsf1 KO, each mouse harboring one tumor. Symbols, individual mouse (bars, mean ± SEM). Two-way ANOVA with Tukey’s test in b, s, t, u; unpaired two tailed Student’s t test in f, g, r; two-way ANOVA with Sidak’s test in l, m.
Extended Data Fig. 4
Extended Data Fig. 4. Rnf2/Rsf1 is negatively correlated to infiltration/activation of NK and CD4+ T-cells.
a-b. BALB/c mice were inoculated with control 4T1 tumor into the left 4th mammary fat pads or simultaneously with control tumor into the left 4th mammary fat pads and Rnf2 KO 4T1 tumors (Rnf2 KO g2) into the right 4th mammary pads. a. Tumor volumes (mean ± SEM, n = 5 mice in the group of 4T1 tumor injected into the left 4th mammary fat pads (Control Tumor), each mouse harboring one tumor; n = 4 mice in the group of simultaneously injected with control tumor into the left 4th mammary fat pads (Control Tumor-Abscopal) and Rnf2 KO 4T1 tumors into the right 4th mammary pads (Rnf2 KO-Abscopal)), each mouse harboring two tumors: one is control tumor injected in the left mammary fat pad, the other one is Rnf2 KO tumor injected into the right mammary fat pad. p < 0.0001 (control tumors injected alone (Control Tumor) vs. Rnf2 KO tumors injected into the right mammary pads of the mice in which control tumors were injected simultaneously into the left mammary pads (Rnf2 KO-Abscopal)); p<0.0001 (control tumor injected into the left mammary pads of the mice in which Rnf2 KO tumors were injected simultaneously into the right mammary pads (Control Tumor-Abscopal) vs. Rnf2 KO tumors injected into the right mammary pads of the mice in which control tumors were injected simultaneously into the left mammary pads (Rnf2 KO-Abscopal)); not statistically significant (control tumors injected alone (Control Tumor) vs. Control tumor injected into the left mammary pads of the mice in which Rnf2 KO tumors were injected simultaneously into the right mammary pads (Control Tumor-Abscopal)) (two-way ANOVA with Tukey’s test). b. Representative BLIs of tumors at indicated days. c-d. The counts of genes encoding granzymes (GZMB, GZMC, GZMD, GZME, GZMF) and mast cell proteases (MCPT1, MCP2, MCPT8), revealed in RNAseq of FACS-sorted NK cells from control 4T1 tumors compared to those in Rnf2 KO tumors (Upper) or Rsf1 KO tumors (Bottom), at day 7 after implantation. The RNAseq was performed in control tumors (n = 2, two groups of cells, each group of cells pooled from 25 mice, each mouse harboring one tumor), Rnf2 KO tumors (n = 2, two groups of cells, one group of cells pooled from 25 mice, each mouse harboring one tumor of Rnf2 KO g1, the other group of cells pooled from another 25 mice, each mouse harboring one tumor of Rnf2 KO g2), Rsf1 KO tumors (n = 2, two groups of cells, one group of cells pooled from 25 mice, each mouse harboring one tumor of Rsf1 KO g1, the other group of cells pooled from another 25 mice, each mouse harboring one tumor of Rsf1 KOg2). The full list of p values can be found in the source data for this figure (two-tailed Wald test). e. The volumes of 4T1 control tumors in BALB/c mice treated with/without α-asialo GM1 at days 2, 5, 10 post-implantation. Mean ± SEM (n = 5 mice/group, each mouse harboring one tumor. Two-way ANOVA with Sidak’s test. f. The correlation of expression of NKG2D with the overall survival of invasive breast cancer patients (TCGA dataset) via cBioPortal. High, expression level > 1.5 SD above the mean. P value is generated using two-tailed LogRank test. Numbers of BRCA patients (n) with (red color)/without (blue color) high expression of NKG2D are indicated. g. The correlation of RNF2 expression to the published NK cell signature in TNBC was analyzed by Pearson correlation (two-tailed, no adjustment for multiple comparisons because of one correlation test for a gene pair). The expression levels of these genes are extracted from the TCGA dataset. The values of the coefficients (r) and significance (p) are indicated. Shaded area, 95% confidential interval. n = TNBC patient numbers. h-j. The expression levels of RNF2 and indicated genes from the published NK cell gene signature are extracted from TCGA RNAseq datasets of various cancer types (n = 11,160 patients). The correlations of RNF2 expression to the levels of these genes as a whole (h), or individually (r in i; p values in j) are shown. k. The volumes of control 4T1 tumors in BALB/c mice treated with α-CD4 (GK1.5) or its isotype control antibody at days 2, 5 post-implantation. Mean ± SEM (n = 5 mice/group, each mouse harboring one tumor.). Two-way ANOVA with Sidak’s test. l. The correlation of RNF2 to CD4 expression level in TNBC was analyzed by Pearson correlation (two-tailed, no adjustment for multiple comparisons because of one correlation test for a gene pair). The expression levels of these genes are extracted from the TCGA dataset. The values of the coefficients (r) and significance (p) of the correlations are displayed. Shaded area, 95% confidential interval. n = TNBC patient numbers. m.The correlation of CD4 expression with the overall survival of invasive breast cancer patients (TCGA dataset) via cBioPortal. P value is generated using LogRank test. High, the expression level > 2 SD above the mean. P value is generated using two-tailed LogRank test. Numbers of BRCA patients (n) with (red color)/without (blue color) high expression of CD4 are indicated. n-p. The expression levels of RNF2 and genes encoding T cell markers and MHCII are extracted from TCGA RNAseq datasets of various cancer types (n = 11,160 patients). The correlations of RNF2 expression to the levels of these genes as a whole (n) or individually (r in o; p values in p) are shown. q. Frequencies of peripheral blood CD8+ T-cells in mice bearing control or Rnf2 KO tumors at day 10 after injection of anti-CD8 (2.43) or control antibody. Symbols depict individual mouse (bars, mean ± SEM). n = 5 mice/group, each mouse harboring one tumor. One-way ANOVA with Tukey’s test.
Extended Data Fig. 5
Extended Data Fig. 5. Tumoral NKG2DL and NK/CD4+ T cell-expressed IFNγR are required for the activation of these immune cells by Rnf2 KO tumors.
a. The frequencies of NKG2DL+CD45 tumor cells isolated from Ctrl/Rnf2 KO/Rsf1 KO 4T1 tumors (Left, n = 5 mice for Ctrl, n = 4 mice for Rnf2 KO and Rsf1 KO, each mouse harboring one tumor) or EMT6 tumors (Right, n = 5 mice for Ctrl and Rnf2 KO g1, n = 4 mice for Rnf2 KO g2, each mouse harboring one tumor) at day 7 post-implantation. Symbols, individual mouse (bars, mean ± SEM). b. Tumor cells (CD45) were isolated and enriched from indicated tumors, co-cultured with NK/CD4+ T-cells/both. The coculture setup is similar to that described in Fig. 3c. Anti-NKG2DL/control antibody was added into the co-culture. Each group has 3/4 replicates of co-culture. Tumor cells (Ctrl/Rnf2 KO) in each replicate of co-culture were pooled from 2-3 tumors from 2-3 mice (each mouse harboring one tumor). Frequencies of IFNγ+NK cells (Left) or IFNγ+CD4+ T-cells (Right) are shown as mean ± SEM of triplicates. c. Frequencies of intratumoral NKG2D+ cells of CD4+ T effector cells of control, Rnf2 KO and Rsf1 KO 4T1 tumors at day 7 post-implantation. Symbols, individual mouse (bars, mean ± SEM). n = 5 mice/group, each mouse harboring one tumor. d. In vitro co-culture experiment was set up as that shown in panel b, except the addition of anti-NKG2DL antibody. Instead, CD4+ T-cells were pre-incubated with anti-NKG2D antibody for 30 min before being added into the co-culture. Each group has 3/4 replicates of co-culture. Tumor cells (Ctrl/Rnf2 KO) in each replicate of co-culture were pooled from 2-3 tumors from 2-3 mice (each mouse harboring one tumor). Frequencies of IFNγ+CD4+ T-cells (Left) or IFNγ+NK cells (Right) are shown as mean ± SEM of triplicates. e. Tumor cells (GFP+) were isolated and enriched by FACS for GFP positive populations from indicated 4T1 tumors in mice. They were co-cultured with NK/CD4+ T cells/both. The coculture setup is similar to that described in Fig. 3c. Each group has 3/4 replicates of co-culture. Tumor cells (Ctrl/Rnf2 KO) in each replicate of co-culture were pooled from 2-3 tumors from 2-3 mice (each mouse harboring one tumor). Frequencies of IFNγ+NK cells (Left) or IFNγ+CD4+ T cells (Right) are shown as mean ± SEM of triplicates. f. Tumor cells (CD45) were enriched from indicated 4T1 tumors in mice and co-cultured with pre-activated NK/CD4+ T-cells/both. CD4+ T-cells were pre-incubated with anti-NKG2D antibody for 30 min before being added into the co-culture. The coculture setup is similar to that described in Fig. 3e. Each group has 3/4/5/6 replicates of co-culture. Tumor cells (Ctrl/Rnf2 KO) in each replicate of co-culture were pooled from 2-3 tumors from 2-3 mice (each mouse harboring one tumor). The percent tumor killing is shown as mean ± SEM of triplicates. g-h. The frequencies of MHCI+CD45 tumor cells and/or the MFI of MHCI expression on CD45 tumor cells isolated from control (Ctrl)/Rnf2 KO cells of 4T1 tumors (g, n = 4 mice for Ctrl, n = 5 mice for Rnf2 KO, each mouse harboring one tumor) or EMT6 tumors (h, n = 5/group, each mouse harboring one tumor) at day 7 post-implantation. Symbols depict individual mouse (bars, mean ± SEM). i-j. Tumor cells (CD45) were enriched from indicated 4T1 tumors in mice, co-cultured with NK/CD4+ T-cells/both. The coculture setup is similar to that described in Fig. 3c. CD4+ T-cells (i) or NK cells (j) were pre-incubated with anti-IFNγ receptor (IFNγR) antibody (GR-20) for 30 min before being added into the co-culture. Each group has 3/4 replicates of co-culture. Tumor cells (Ctrl/Rnf2 KO) in each replicate of co-culture were pooled from 2-3 tumors from 2-3 mice (each mouse harboring one tumor). Frequencies of IFNγ+CD4+ T-cells or IFNγ+NK cells are shown as mean ± SEM of triplicates. k-m. Expression levels of IFNγR1 and IFNγR2 in Rnf2 KO plus IFNγR1 KO (DKO1) (k), Rnf2 KO plus IFNγR2 KO (DKO2) (l), and Rnf2 KO plus IFNγR1 KO and IFNγR2 KO (TKO) (m) 4T1 cells, measured by Flowcytometry (Histogram), which represents two independent experiments. n-o. n. The volumes (n) and representative BLIs at day 49 (o) of indicated 4T1 tumors in BALB/c mice. Mean ± SEM (n = 5 mice/group, each mouse harboring one tumor). DKO 1: Rnf2 KO + IFNγR1 KO; DKO 2: Rnf2 KO + IFNγR2 KO. TKO: Rnf2 KO + IFNγR1 KO + IFNγR2 KO. ****, control tumor vs. Rnf2 KO + IFNγR1 KO tumor; ****, control tumor vs. Rnf2 KO + IFNγR2 KO tumor; ****, control tumor vs. Rnf2 KO + IFNγR1 KO + IFNγR2 KO tumor; ****, control tumor vs. Rnf2 KO tumor. p. Tumor cells (CD45) were enriched from indicated tumors in mice, co-cultured with NK/CD4+ T-cells/both. The coculture setup is similar to that described in Fig. 3c. Each group has 3 replicates of co-culture. Tumor cells (Ctrl/Rnf2 KO) in each replicate of co-culture were pooled from 2-3 tumors from 2-3 mice (each mouse harboring one tumor). Frequencies of IFNγ+CD4+ T-cells (Left) or IFNγ+NK cells (Right) are shown as mean ± SEM of triplicates. q-r. q. The volumes of control 4T1 tumors in BALB/c mice treated with control/anti-IFNγ antibody at day 2, 5 post-implantation. Mean ± SEM (n = 5 mice/group, each mouse harboring one tumor). r. The relative ratio of the fold changes in the tumor volumes (=Average of Fold Changes in tumor volumes of the group of anti-IFNγ divided by Average of Fold Changes in tumor volumes of the group of Control antibody) in control 4T1 tumors (panel q) or Rnf2 KO tumors (shown in Fig. 3h) at the end of the study. n = 5 mice for Ctrl Tumor treated with Ctrl Antibody; n = 4 mice for Ctrl Tumor treated with IFNγ Antibody; n = 4 mice for Rnf2 KO treated with Ctrl Antibody; n = 5 mice for Rnf2 KO treated with IFNγ Antibody. Each mouse harbored one tumor. s. Tumor cells (CD45) were enriched from indicated 4T1 tumors in mice, co-cultured with NK/CD4+ T-cells/both. The coculture setup is similar to that described in Fig. 3c. Control/anti-IL-2 antibody (JES6-1A12) was supplemented in the co-culture. Each group has 3/4 replicates of co-culture. Tumor cells (Ctrl/Rnf2 KO) in each replicate of co-culture were pooled from 2-3 tumors from 2-3 mice (each mouse harboring one tumor). Frequencies of IFNγ+CD4+ T-cells (Left) or IFNγ+NK cells (Right) are shown as mean ± SEM of triplicates. *p<0.05, **p<0.01, ***p<0.001,****p<0.0001, n.s., not statistically significant (unpaired two-tailed Student’s t test in a, b, c, f, g, h, p; one-way ANOVA with Tukey’s test in d, e, i, j, s; two-way ANOVA with Tukey’s test in n; two-way ANOVA with Sidak’s test in q). The full list of p values can be found in the source data for this figure.
Extended Data Fig. 6
Extended Data Fig. 6. Rnf2/Rsf1 KO tumors upregulate genes related to immunity.
a. Log2FC (fold change) (Left) and adjusted p values (padj) (Right) of the upregulated immune cell markers expressed in Rnf2 KO 4T1 tumor cells (n = 2, two groups of tumor cells, one group of cells was from Rnf2 KO g1, the other group was from Rnf2 KO g2, each group of cells were pooled from 25 mice, each mouse harboring one tumor) compared to those in control tumor cells (n = 2, two groups of cells, each group of cells pooled from 25 mice, each mouse harboring one tumor) isolated and sorted from in vivo tumors at day 7 post-implantation followed by RNAseq analysis, as in Fig. 4a. b-e. Analysis of differentially expressed genes revealed in RNAseq of FACS-sorted Rnf2 KO 4T1 tumor cells (as described in panel a) (n = 2, two groups of cells, one group of cells was from Rnf2 KO g1, the other group was from Rnf2 KO g2, each group of cells pooled from 25 mice) (b), or Rsf1 KO 4T1 tumor cells (similar to that described in panel a) (n = 2, two groups of cells, one group of cells was from Rsf1 KO g1, the other group was from Rsf1 KO g2, each group of cells pooled from 25 mice) (c) compared to control 4T1 tumors cells (n = 2, two groups of cells, each group of cells pooled from 25 mice, each mouse harboring one tumor) isolated from in vivo tumors at day 7 post-tumor implantation, using Network Analyst. The representative enriched gene sets with FDR q values are shown (b, c). Heatmaps display these DEGs and representative genes related to immunity are noted (d, e). f. GSEA analysis of differentially expressed genes (DEGs) revealed in RNAseq of FACS-sorted Rsf1 KO 4T1 tumor cells (as described in panel c) (n = 2, Rsf1 KO g1 and g2, two groups of cells, each group of cells pooled from 25 mice) compared to control 4T1 tumors cells (n = 2, two groups of cells, each group of cells pooled from 25 mice)isolated from corresponding tumors implanted in mice at day 7 post-tumor implantation. The representative enriched gene sets with FDR q values are shown. g. Representative GSEA Enrichment plots (score curves) of DEGs determined by RNAseq in Rnf2 KO compared to control tumors. GSEA analysis of DEGs revealed in RNAseq of 4T1 tumors is performed as in Fig. 4a. The representative Enrichment plots of positively or negatively regulated genes in Rnf2 KO tumor cells compared to control tumor cells are shown.
Extended Data Fig. 7
Extended Data Fig. 7. Rsf1 regulates expression of an overlapping group of immune-related genes with Rnf2.
a. Representative GSEA Enrichment plots (score curves) of DEGs in Rsf1 KO compared to control tumors. GSEA analysis of DEGs revealed in RNAseq of 4T1 tumors is performed as in Extended-Fig. 6f. The representative Enrichment plots are shown. b. Analysis of DEGs revealed in a published RNAseq of control siRNA- compared to RNF2 siRNA-treated human TNBC cell line MDA-MB-231 (log2FC≥ 1 and log2FC≤ −1) using Network Analyst. The representative enriched gene sets with FDR q values are shown. c. The overlap of DEGs in Rnf2 KO and Rsf1 KO 4T1 tumor cells compared to control 4T1 tumors cells, which were isolated by FACS from in vivo tumors. DEGs are determined and described in Fig. 4a and Extended-Fig. 6f. P value of overlap is calculated using web tool SSOTGNB (http://nemates.org/MA/progs/overlap_stats.html), similar to that described in Fig. 5c. d. The log2FC (Fold Change) of overlapping DEGs in Rnf2 KO tumors and Rsf1 KO tumors. DEGs are determined and described in Fig. 4a and Extended-Fig. 6f. e. g:Profiler analysis of the 134 overlapped DEGs in panel c. The adjust p value (padj) is indicated (one-tailed hypergeometric test with adjustment for multiple comparisons). f. A floating bars graph (min, max and line at mean) depicts the counts of genes encoding chemokines revealed in RNAseq of FACS-sorted tumors cells, as in Fig. 4a and Extended Fig. 6f. These Rnf2 KO (n = 2, two groups of cells, one group was from Rnf2 KO g1, the other group was from Rnf2 KO g2, each group of cells pooled from 25 mice, each mouse harboring one tumor), Rsf1 KO (n = 2, two groups of cells, one group was from Rsf1 KO g1, the other group was from Rsf1 KO g2, each group of cells pooled from 25 mice, each mouse harboring one tumor) and control (n = 2, two groups of cells, each group of cells pooled from 25 mice, each mouse harboring one tumor) 4T1 tumors cells were isolated by FACS from corresponding in vivo tumors. The adjust p values (padj) are determined by the two-tailed Wald test and can be found in the source data for this figure. g. The correlations of expressions of RNF2, RSF1 or EZH2 to the levels of human chemokine genes were analyzed using the RNAseq data extracted from invasive breast cancer TCGA dataset. Heatmaps show the correlation coefficients (Left) and q values of each correlation (Right). n = 1,084 BRCA patients. h. The correlations of the chemokine gene CCL5 or CXCL10 to the overall survival of invasive breast cancer patients, extracted from the TCGA dataset via cBioPortal. High expression is defined as the expression levels greater than 2 SD above the mean. P values are generated using two-tailed LogRank test. Numbers (n) of BRCA patients with (red color)/without (blue color) high expression of CCL5 (left)/CXCL10 (right) are indicated.
Extended Data Fig. 8
Extended Data Fig. 8. Rnf2 binds to immune related genes in mouse and human breast cancer cells.
a-b. The overlap of Rnf2 target genes in cultured 4T1 cells determined by Rnf2 CHIPseq with genes displaying significantly more/less accessible chromatin sites in Rnf2 KO 4T1 tumors determined by ATACseq as in Fig. 5a (a) or with DEGs (determined by RNAseq shown in Fig. 4a) in Rnf2 KO 4T1 tumors (compared to control 4T1 tumors) (b). P values of the overlap are calculated using web tool SSOTGNB (http://nemates.org/MA/progs/overlap_stats.html), similar to that described in Fig. 5c. c-d. Screenshots of genes H2-Ab1 and H2-Eb1 in both control and Rnf2 KO 4T1 tumor cells obtained from RNAseq (determined and described in Fig. 4a) and ATACseq (determined and described in Fig. 5a) (c) or of gene H2-Ab1 in mouse embryonic stem cells (mES) obtained by reanalyzing published datasets of Rnf2 CHIPseq (GSE34520) (d). e. Expression level of gene H2-Ab1 in control and Rnf2 KO mES cells obtained by reanalyzing published dataset of RNA microarray (GSE10573). f. Genes occupied by RNF2 were identified by CHIPseq analysis of human TNBC cell line MDA-MB-231 using anti-RNF2 antibody compared to Input (GSE107176). g. Integrative genomics viewer (IGV) screenshots of Input or RNF2 ChIPseq (as in panel f) tracks (scale bar, 40) of HLA-DPA1, HLA-DPB1, CCL20 and CXCL8. h. GSEA analysis (REACTOME) of genes occupied by RNF2 revealed in published CHIPseq of human TNBC cell line MDA-MB-231 using anti-RNF2 antibody compared to Input (as in panel f). The representative enriched pathways with FDR q values are shown. The full list of q values is provided in the Source Data File associated with this panel. i. The correlations of RNF2 expression in BRCA patients to the levels of its bound genes that were determined as in panel f. The correlation analyses were performed similar to that described in Fig. 5h. The expression levels of these RNF2 bound genes and of RNF2 were extracted from the invasive breast cancer TCGA dataset. The coefficient (yellow) and q value (purple) of each correlation are indicated at the y-axis (two-tailed Spearman correlation analysis). The number (n) of RNF2 bound genes with FDR q values (indicative of the significance of the correlations of these genes to RNF2 expression) < 0.05, and the percentages of these genes (q < 0.05) among the total RNF2 bound genes are noted in blue. The blue vertical bars mark the q value at 0.05. Totally 1,070 BRCA patient samples were included.
Extended Data Fig. 9
Extended Data Fig. 9. Ablation of Rnf2/Rsf1 induces anti-tumor memory response.
a. BALB/c mice were inoculated with Rnf2 KO 4T1 tumors (Rnf2 KO g2) or Rsf1 KO 4T1 tumors (Rsf1 KO g1) in the left 4th mammary pads. At day 45 after the primary tumors were rejected, wildtype 4T1 tumors were implanted into the right 4th mammary pads or naïve mice. n = 5 mice /group, each mouse harboring one tumor. Representative BLIs of wildtype 4T1 tumors at days 97, 131, 182 and 307 after the 2nd challenge are shown. X, mice were sacrificed because of the big tumor burdens at the day when images were taken. b. BALB/c mice were inoculated with Rnf2 KO 4T1 tumors (Rnf2 KO g2) in the left 4th mammary pads. At day 45 after the Rnf2 KO tumors were rejected, TSA tumors were implanted into the right 4th mammary pads or naïve mice. The tumor volumes were measured by caliper (mean ± SEM, n = 5 mice for naïve, n=4 mice for Rnf2 KO, each mouse harboring one tumor). c. Frequencies of intratumoral indicated immune cells in wildtype 4T1 tumors at day 7 after the 2nd challenge, measured similar to that described in Fig. 8e. Symbols, individual mouse (bars, mean ± SEM). n = 3 mice for naïve and Rsf1 KO, n = 4 mice for Rnf2 KO, each mouse harboring one tumor. d-e. Mice were inoculated with Rnf2 KO 4T1 tumors and re-challenged with wildtype 4T1 tumors on the contralateral, as in panel a and Fig. 8a. α-asialo GM1 antibody was injected at days −1, +1, +4 relative to the 2nd challenge. d. Volumes (Left, luminescence intensities, mean ± SEM, n = 5 mice/group, each mouse harboring one tumor; Right, individual mouse) of wildtype 4T1 tumors. e. Representative BLIs of wildtype 4T1 tumors at indicated days after the 2nd challenge. f. Frequencies of peripheral blood CD8+ T-cells in Rnf2 KO mice at day 10 after injection of anti-CD8 (2.43) or control antibody. Symbols, individual mouse (bars, mean ± SEM). n = 5 mice/group, each mouse harboring one tumor. g-h. g. Mice were inoculated with Rnf2 KO 4T1 tumors (Rnf2 KO g2) and re-challenged with wildtype 4T1 tumors on the contralateral, as in panel a and Fig. 8a. Anti-CD8 or control antibody was injected at days −1 and +1 relative to the 2nd challenge. g. Volumes (Left, luminescence intensities, mean ± SEM, n = 5 mice/group, each mouse harboring one tumor; Right, individual mouse) of wildtype 4T1 tumors. h. Representative BLIs of wildtype 4T1 tumors at day 26 or day 96 after the 2nd challenge. i. Frequencies of peripheral blood CD4+ T-cells in Rnf2 KO mice at day 10 after injection of anti-CD4 (GK1.5) or control antibody. Symbols, anti-tumor memory response. individual mouse (bars, mean ± SEM). n = 5 mice/group, each mouse harboring one tumor. Unpaired two-tailed Student’s t test in c, f, i; two-way ANOVA with Sidak’s test in b, d, g.
Extended Data Fig. 10
Extended Data Fig. 10. Gating Strategy used for flow cytometry.
a. Gating Strategy used for analysis of immune cells from tumors isolated from tumor-bearing mice presented on Fig. 2a-e, Fig. 3a-b, Fig. 4c, Fig. 7e, Fig. 8e, Extended Fig. 3v, Extended Fig. 5a,c,g-h, Extended Fig. 9c. b. Gating Strategy used for analysis of each subset of CD4+ T-cells in a (5-2). c. Gating Strategy used for analysis of each subset or marker of NK cells in a (5-3). d. Gating Strategy used for analysis of each subset or marker of CD45–tumor cells in a. e. Gating Strategy used for analysis of CD4+ T-cells or NK cells from the in vitro co-culture assays presented on Fig. 3c-d, f-g, Fig. 4j-k, Extended Fig. 5b, d-e, Extended Fig. 5i-j, p, s. f. Gating Strategy used for analysis of dead tumors in the in vitro killing assays presented on Fig. 3e, Fig 4l, Extended Fig. 5f. g. Gating Strategy used for sorting of tumor cells (CD45–) and NK cells (CD45+NKp46+CD3−) for RNA-Seq and ATAC-Seq presented on Fig. 4a-b, Fig. 5a-f, Fig. 6, Fig. 7f-j, Extended Fig. 4c-d, Extended Fig. 6, Extended Fig. 7a, c-f, Extended Fig. 8a-c.
Figure 1.
Figure 1.. Rnf2/Bmi1 KO induces durable tumor rejection in syngeneic murine models of breast cancer.
a. Immunoblots show the levels of selected proteins in control (Ctrl) and Rnf2 KO (two independent guide RNAs (gRNAs), g1 and g2) 4T1 cells, which represents at least 3 independent experiments. b-e. The volumes (luminescence intensities) of control or Rnf2 KO 4T1 tumors (two independent gRNAs, g1 (b) and g2 (c)) implanted into the 4th mammary pads of the syngeneic BALB/c mice. d, e. Representative tumor bioluminescence images (BLIs) at indicated days after inoculation. Rnf2 KO tumor phenotypes were repeated at least three times. Mean ± SEM (n = 5 mice [for Ctrl, Rnf2 KO g1 and g2 groups, each mouse harbored one tumor). f-g. The volumes (f) (luminescence intensities) and representative tumor BLIs (g) at longer time points of panel c. Mean ± SEM. n= 5 mice/group, each mouse harbored one tumor. X, control mice were sacrificed because of the big tumor burdens at the day when images were taken. h-i. Tumor growth of control and Rnf2 KO EMT6 tumors (two independent gRNAs, g1 (h) and g2 (i)) implanted into the 4th mammary pads of the BALB/c mice. Tumor volumes = length X width2/2. Mean ± SEM (n = 5 mice/group, each mouse harbored one tumor). j-l. j. Immunoblots show the levels of selected proteins in vehicle or doxycycline treated doxycycline inducible Rnf2 KO 4T1 cells, which represents 2 independent experiments. k-l. Tumor growth (k) of doxycycline inducible Rnf2 KO 4T1 tumors in immunocompetent BALB/c mice treated with doxycycline or vehicle (treatment started 1 day before tumor cells were injected). Tumor volumes = length X width2/2. Mean ± SEM (n = 5 mice/group, each mouse harbored one tumor). i. Tumor volumes shown in panel k were displayed in individual mice. m-p. m. Immunoblots show the levels of selected proteins in Ctrl and Bmi1 KO (two independent gRNAs, g1 and g2) 4T1 cells, which represents 2 independent experiments with similar results. n-p. The volumes (luminescence intensities) of control or Bmi1 KO 4T1 tumors (induced by two independent gRNAs, g1 (n) and g2 (o)) implanted into the 4th mammary pads of BALB/c mice. p. Representative tumor BLIs at indicated days after inoculation. Mean ± SEM (n = 5 mice/group, each mouse harbored one tumor). Two-way ANOVA with Sidak’s test, in b, c, f, h, i, k, n, o.
Figure 2.
Figure 2.. Rnf2/Rsf1 KO mobilizes NK and CD4+ T-cells.
a. Frequencies of indicated intratumoral immune cells in Ctrl, Rnf2 KO or Rsf1 KO 4T1 tumors at day 7 post-implantation. n = 10 mice for ctrl and Rsf1 KO for the first 4 panels, n=6 mice for Rsf1 KO in the fifth panel, n = 6 mice for Rnf2 KO. Each mouse harbored one tumor, bars, mean ± SEM. Symbols depict individual mouse. b. The mean fluorescence intensity (MFI) of NKG2D expression on NK cells in Ctrl, Rnf2 KO or Rsf1 KO 4T1 tumors at day 7 post-implantation. n = 4 mice for Ctrl, n = 5 mice for Rnf2 KO/Rsf1 KO. Each mouse harbored one tumor, bars, mean ± SEM. Symbols depict individual mouse. c-d. Frequencies of IFNγ+, GzmB+, TNFα+ -NK or -CD4+ T-cells in Ctrl, Rnf2 KO (c) or Rsf1 KO (d) 4T1 tumors at day 7 post-implantation. n = 6/7 mice for Ctrl, n = 7 mice for Rnf2 KO, n = 6/7 mice for Rsf1 KO. Each mouse harbored one tumor, bars, mean ± SEM. Symbols depict individual mouse. e. Frequencies of indicated intratumoral immune cells in Ctrl, Rnf2 KO (two independent gRNAs, g1 and g2) EMT6 tumors at day 7 post-implantation. n= 5 mice for Ctrl or Rnf2 KO g1, n = 4 mice for Rnf2 KO g2. Each mouse harbored one tumor, bars, mean ± SEM. Symbols depict individual mouse. f-i. The volumes (f, h) of 4T1 Rnf2 KO tumors (Rnf2 KO g2) (f) or Rsf1 KO tumors (Rsf1 KO g1) (h) in BALB/c mice treated with/without α-asialo GM1 at days 2, 5, 10 post-implantation. Mean ± SEM (n = 5 mice/group, each mouse harbored one tumor.). g, i. Representative tumor BLIs at the indicated day. j-k. The volumes (j) of 4T1 Rnf2 KO tumors (Rnf2 KO g2) in BALB/c mice treated with α-CD4 (GK1.5) or control antibody at days 2, 5 post-implantation. Mean ± SEM (n = 5 mice/group, each mouse harbored one tumor.). k. Representative BLIs of tumors at day 45. l-m. The volumes (l) of control or 4T1 Rnf2 KO tumors (Rnf2 KO g2) in BALB/c mice treated with α-CD8 antibody (Ab) or control Ab at days 2, 5 after tumor implantation. Mean ± SEM (n = 5 mice/group, each mouse harbored one tumor.). m. Representative tumor bioluminescence images (BLIs) at indicated day after inoculation. Unpaired two-tailed Student’s t test in a, b, c, d, e, two-way ANOVA with Sidak’s test in f, h, j, l.
Figure 3.
Figure 3.. Rnf2 KO/Rsf1 KO induces cooperation between NK and CD4+ T-cells.
a-b. Frequencies of indicated immune cell subsets in 4T1 Rnf2 KO tumors (Rnf2 KO g2) in mice treated with/ without α-asialo GM1 (a) (n = 5 mice/group, each mouse harbored one tumor.) or α-CD4 (GK1.5) (b) (n = 4 mice/group, each mouse harbored one tumor.) at day 7 post-inoculation. Symbols depict individual mouse (bars, mean ± SEM). c-d. Tumor cells (CD45) were isolated and enriched from control/Rnf2 KO 4T1 tumors, co-cultured with CD4+ T-cells, or NK cells or both. The anti-NKG2D/control antibody (30 μg/ml) was pre-incubated with NK cells (c) or anti-MHCII/control antibody was added to the co-cultures with CD4+ T-cells (d). Frequencies of IFNγ+CD4+ T-cells or IFNγ+NK cells are shown as mean ± SEM of triplicates. Each group has 3/4 replicates of co-culture. Tumor cells (Ctrl/Rnf2 KO) in each replicate of co-culture were pooled from 2-3 tumors from 2-3 mice (each mouse harboring one tumor). Data represent one of two independent experiments. e. Tumor cells (CD45) were isolated and enriched from control/Rnf2 KO 4T1 tumors, co-cultured with pre-activated CD4+ T-cells, or NK cells or both. The anti-NKG2D/control antibody (30 μg/ml) was pre-incubated with NK cells for 15 min before co-culture. The percent tumor killing is shown as mean ± SEM of triplicates. Each group has 3/4/5/6 replicates of co-culture. Tumor cells (Ctrl/Rnf2 KO) in each replicate of co-culture were pooled from 2-3 tumors from 2-3 mice (each mouse harboring one tumor). f-g. Tumor cells (CD45) were isolated and enriched from control or Rnf2 KO 4T1 tumors, and co-cultured with CD4+ T-cells, or NK cells or both. Anti-IFNγ (XMG1.2)/control antibody was added to the co-cultures. Frequencies of IFNγ+CD4+ T-cells (f) or IFNγ+NK cells (g) are shown as mean ± SEM of triplicates. Each group has 3/4 replicates of co-culture. Tumor cells (Ctrl/Rnf2 KO) in each replicate of co-culture were pooled from 2-3 tumors from 2-3 mice (each mouse harboring one tumor). Data represent one of two independent experiments. h-k. The volumes of Rnf2 KO tumors (Rnf2 KO g2) (h) or Rsf1 KO tumors (Rsf1 KO g1) (j) in BALB/c mice treated with control/anti-IFNγ antibody (Ab) at day 2, 5 post-implantation. Mean ± SEM (n = 4 mice for control Ab treated Rnf2 KO tumors; n = 5 mice for control Ab treatedRsf1 KO tumors; n = 5 mice for Rnf2 KO or Rsf1 KO tumors treated with anti-IFNγ Ab, each mouse harbored one tumor). i, k, representative tumor BLIs at day 27 after inoculation. *p < 0.05, **p < 0.01, ***p < 0.001, and ****p < 0.0001 (unpaired two-tailed Student’s t test in a, b, c, d; one-way ANOVA with Tukey’s test in e, f, g; two-way ANOVA with Sidak’s test in h, j). The full list of p values can be found in the source data for this figure.
Figure 4.
Figure 4.. Rnf2/Rsf1 KO tumors upregulate MHCII/CD74.
a. GSEA of DEGs revealed in RNAseq of Rnf2 KO (two groups of cells, Rnf2 KO g1 and Rnf2 KO g2, each group of cells pooled from 25 mice) compared to control 4T1 cells (two groups of cells, each group cells pooled from 25 mice) enriched from tumors in mice (each mouse harbored one tumor) at day-7 post-implantation. The representative enriched gene sets with q values are shown. b. A floating bars graph (min, max and line at mean) of the counts of MHCII isoforms and Cd74, revealed in RNAseq as in panel a. Rnf2 KO (two groups of cells, each group of cells pooled from 25 mice)/control 4T1 cells (two groups, each group of cells pooled from 25 mice) were enriched from tumors in mice, each mouse harbored one tumor. c. The MFI of MHCII on CD45 tumor cells and frequencies of CD74+CD45 tumor cells isolated from indicated 4T1 (n = 7/4 mice for Ctrl (7 for Left panel, 4 for Middle panel) , n = 7 mice for Rsf1 KO, n = 6/4 mice for Rnf2 KO (6 for Left panel, 4 for Middle panel)) or EMT6 (n = 5 mice for Ctrl/Rnf2 KO g1, n =4 for Rnf2 KO g2) tumors at day 7 post-implantation. Symbols, individual mouse (bars, mean ± SEM). d-e. The correlations of RNF2/RSF1/EZH2 to the MHCII isoforms/CD74 (d) or the correlations of MHCII isoforms/CD74 to the survival of invasive breast cancer patients (e), derived from invasive breast cancer TCGA dataset through cBioportal. High expression, mRNA > 2 SD above the mean. n = 1084 (d)/1080 (e) patients total. f-i. f. Histogram overlays of MHCII expression on Ctrl, Rnf2 KO and Rnf2 KO with additional deletion of MHCII (Rnf2 KO g2-MHCII KO, DKO) 4T1 cells, which represents two independent experiments. g-h. The volumes of indicated tumors in BALB/c mice. g. Mean ± SEM (n = 5 mice/group, each mouse harboring one tumor). h. Individual mouse. i. Representative tumor BLIs at day 53. j-l. Tumor cells (CD45) were isolated from indicated 4T1 tumors and co-cultured with CD4+ T-cells/NK cells/both (j, k) or pre-activated CD4+ T-cells (l). Frequencies of IFNγ+CD4+ T (j)/IFNγ+NK cells (k)/percent dead tumor cells (CTV+FVD+) (l) are shown as mean ± SEM of triplicates. Each group has 3/4/5 replicates of co-culture. Tumor cells (Ctrl/Rnf2 KO) in each replicate of co-culture were pooled from 2-3 tumors from 2-3 mice (each mouse harboring one tumor). *p < 0.05 **p < 0.01, ***p < 0.001 and ****p < 0.0001 (padj in b). Two-tailed Wald test in b, unpaired two-tailed Student’s t test in c, l, two-tailed LogRank test in e, two-way ANOVA with Sidak’s test in g, one-way ANOVA with Tukey’s test in j, k. Exact p values for b, j-l are listed in the source data.
Figure 5.
Figure 5.. Rnf2 modulates accessibilities of immune-related genes.
a. The numbers of genes with significantly more/less accessible chromatin sites in Rnf2 KO (n = 2, two groups of cells, each group of cells pooled from 25 mice, each mouse harboring one tumor) compared to control 4T1 tumor cells (n = 2, two groups of cells, each group of cells pooled from 25 mice, each mouse harboring one tumor), enriched from the corresponding tumors in mice at day 7 after implantation, were determined by ATACseq. b. Gene ontology analyses of genes determined in panel a were performed through online tool THE GENE ONTOLOGY RESOURCE. The representative enriched gene sets with FDR q values are shown (Fisher Test, one-tailed hypergeometric test). c. The overlap of DEGs (determined by RNAseq in Figure 4a) in Rnf2 KO 4T1 tumors with genes significantly more/less open in Rnf2 KO 4T1 tumors determined in panel a. P values of the overlap are calculated using the web tool Statistical significance of overlap of two groups of genes from Nematode Bioinformatics (SSOTGNB) (http://nemates.org/MA/progs/overlap_stats.html). d-f. Gene ontology analyses of overlapping genes determined in panel c (d) or in Extended-Figure 8a (e) or in Extended-Figure 8b (f) were performed through online tool THE GENE ONTOLOGY RESOURCE. The representative enriched gene sets with FDR q values are shown (Fisher Test, one-tailed hypergeometric test). g. Cut&Run-qPCR analysis of chromatin DNA pulled down by control IgG, or Rnf2 antibody from control or Rnf2 KO 4T1 tumor cell lines. The amplicons are indicated. Data are shown as the percentage of input, n = 3 technical replicates. Fn, Fragment n of the 5’-untranscribed region. h. The correlations of RNF2 to the levels of its bound immune-related genes that were determined as in Extended-Figure 8f in BRCA patients. The expression levels of these RNF2 bound genes and of RNF2 were extracted from the invasive breast cancer TCGA dataset via cBioportal. The coefficient (yellow) and q value (pink) of each correlation are indicated at the y-axis. The number (n) of RNF2 bound immune-related genes with FDR q values < 0.05, and the percentages of these genes (q < 0.05) among the total RNF2 bound immune-related genes are noted in blue. The blue vertical bars mark the q value at 0.05. Representative immune-related genes with coefficients < 0 or > 0 and q < 0.05 are indicated. Totally 1,070 BRCA patient samples were included.
Figure 6.
Figure 6.. Rsf1 modulates accessibilities of an overlapping group of immune-related genes with Rnf2.
a. The numbers of genes with significantly more/less accessible chromatin sites in Rsf1 KO (n = 2, two groups of cells, each group of cells pooled from 25 mice, each mouse harboring one tumor) compared to control 4T1 tumor cells (n = 2, two groups of cells, each group cells pooled from 25 mice, each mouse harboring one tumor), enriched from the corresponding tumors in mice at day 7 after implantation, were determined by ATACseq similar to that described in Figure 5a. b. Overlap of genes with significantly more/less accessible chromatin sites in Rnf2 KO and Rsf1 KO 4T1 tumors measured by ATACseq determined in panel a and Figure 5a, respectively. P values of the overlap were calculated using the web tool SSOTGNB (http://nemates.org/MA/progs/overlap_stats.html) similar to that described in Figure 5c. c. Gene ontology analyses of overlapping genes determined in panel b were performed through online tool THE GENE ONTOLOGY RESOURCE, similar to that described in Figure 5b. The representative enriched gene sets with FDR q values are shown (Fisher Test, one-tailed hypergeometric test). d-e. d. The overlap of shared significantly upregulated (Left)/downregulated (Right) DEGs of Rnf2 KO and Rsf1 KO 4T1 tumors (determined by comparing to control 4T1 tumors shown in Extended-Figure 7c) with genes showing significantly more (Left)/less (Right) accessible chromatin sites in Rnf2 KO and Rsf1 KO 4T1 tumors (determined by ATACseq by comparing to control 4T1 tumors shown in panel a and Figure 5a, respectively). e. Gene ontology analyses of overlapping significantly upregulated and more accessible genes determined in panel d were performed through online tool THE GENE ONTOLOGY RESOURCE. The representative enriched gene sets with FDR q values are shown (Fisher Test, one-tailed hypergeometric test), similar to that in Figure 5b.
Figure 7.
Figure 7.. The E3 ligase activity of Rnf2 is dispensable for its regulation of anti-tumor immunity.
a. The sequencing result of the I53A knockin mutant. The mutated genomic sequence encoding Alanine is highlighted. b. Immunoblots show the protein levels of H2AK119ub1 in control and Rnf2I53A/I53A knockin 4T1 tumor cells. The reduction of H2aK119ub1 level has been independently confirmed twice. c-d. The volumes (c) (luminescence intensities) of control 4T1 tumors or Rnf2I53A/I53A 4T1 tumors implanted into the 4th mammary pads of the syngeneic BALB/c mice and representative tumor bioluminescence images (BLIs) (d) at indicated days after inoculation. Mean ± SEM (n = 5 mice/group, each mouse harbored one tumor, two-way ANOVA with Tukey’s test). The in vivo growing phenotype of Rnf2I53A/I53A 4T1 tumor has been independently confirmed. e. Frequencies of indicated immune cell subsets in 4T1 control and Rnf2I53A/I53A tumors injected into the 4th mammary fat pads of syngeneic BALB/c mice at day 7 after tumor inoculation. Symbols, individual mouse (bars, mean ± SEM, n = 4 mice for Ctrl, n = 5 mice for Rnf2I53A/I53A, each mouse harboring one tumor, unpaired two-tailed Student’s t test). f. The numbers of genes with significantly more/less accessible chromatin sites in 4T1 Rnf2I53A/I53A tumor cells (n = 2, two groups of cells, each group of cells pooled from 25 mice, each mouse harboring one tumor) compared to 4T1 control tumor cells (n = 2, two groups of cells, each group of cells pooled from 25 mice, each mouse harboring one tumor) were determined by ATACseq, similar to that described in Figure 5a. These tumor cells were enriched by FACS from the corresponding tumors implanted into the 4th mammary fat pads of syngeneic BALB/c mice. The tumors were removed at day 7 after implantation. g. Overlap of genes with more/less accessible chromatin sites in Rnf2 KO (determined in Figure 5a) and Rnf2I53A/I53A (panel f) 4T1 tumors, which were measured by ATACseq and determined by compared to control 4T1 tumors. These tumor cells were enriched by FACS from corresponding tumors implanted in BALB/c mice. Both Rnf2 KO and Rnf2I53A/I53A had two group of tumor cells with each group of cells pooled from 25 mice (each mouse harboring one tumor). P values of the overlap were calculated using the web tool SSOTGNB (http://nemates.org/MA/progs/overlap_stats.html), similar to that described in Figure 5c. h-j. Gene ontology analyses of overlap (h) and not overlap genes (I, j) determined in panel g were performed through online tool THE GENE ONTOLOGY RESOURCE. The representative enriched gene sets with FDR q values are shown (Fisher Test, one-tailed hypergeometric test), similar to that described in Figure 5b.
Figure 8.
Figure 8.. Ablation of Rnf2/Rsf1 induces anti-tumor memory response that is dependent of CD4+ T-cells.
a. BALB/c mice were inoculated with Rnf2 KO- (Rnf2 KO g2) (Left) or Rsf1 KO-4T1 tumors (Rsf1 KO g1) (middle) in the left 4th mammary pads. At day 45 after the primary tumors were rejected, wildtype 4T1 tumors were implanted into the right 4th mammary pads of these mice or of naïve mice. n = 5 mice/group, each mouse harboring one tumor. Left/middle, Volumes (luminescence intensities) (mean ± SEM). Right, Representative BLIs of wildtype 4T1 tumors at day 42 after the 2nd challenge. b-d. BALB/c mice were inoculated with Rnf2 KO EMT6 tumors (Rnf2 KO g1 and g2) in the left 4th mammary pads. At day 45 after the primary tumors were rejected, wildtype EMT6 tumors were implanted into the right 4th mammary pads of these mice or of naïve mice. Tumor volumes (b) were calculated by length X width2/2. Mean ± SEM (n = 5 mice in naïve mice group, n = 4 mice for Rnf2 KO g1 or g2 group, each mouse harboring one tumor). The weights (c) and image (d) of the tumors at the end of the study. e. Frequencies of indicated immune cells in wildtype 4T1 tumors at day 7 after the 2nd challenge, as in panel a. Symbols, individual mouse (bars, mean ± SEM). n = 3 mice for naïve and Rsf1 KO, n = 4 mice for Rnf2 KO, each mouse harboring one tumor. f-g. Mice were inoculated with Rnf2 KO 4T1 tumors and re-challenged with wildtype 4T1 tumors on the contralateral, as in panel a. Anti-CD4 (GK1.5) or control antibody was injected at days −1 and +1 relative to tumor implantation. f. Volumes (luminescence intensities) of wildtype 4T1 tumors. Mean ± SEM (n = 4 mice for control antibody, n = 5 mice for GK1.5, each mouse harboring one tumor). g. Representative tumor BLIs at day 48 after the 2nd challenge. h-i. Working models. Two-way ANOVA with Sidak’s test in a, b, f; one-way ANOVA with Tukey’s test in c; unpaired two-tailed Student’s t test in e.

Comment in

  • A PRC1-RNF2 knockout punch for cancer.
    Peeters JGC, DuPage M. Peeters JGC, et al. Nat Cancer. 2021 Oct;2(10):996-997. doi: 10.1038/s43018-021-00270-0. Nat Cancer. 2021. PMID: 35121885 No abstract available.

References

    1. Leach DR, Krummel MF & Allison JP Enhancement of antitumor immunity by CTLA-4 blockade. Science 271, 1734–1736, doi:10.1126/science.271.5256.1734 (1996). - DOI - PubMed
    1. Patel SA & Minn AJ Combination Cancer Therapy with Immune Checkpoint Blockade: Mechanisms and Strategies. Immunity 48, 417–433, doi:10.1016/j.immuni.2018.03.007 (2018). - DOI - PMC - PubMed
    1. Frankel T, Lanfranca MP & Zou W The Role of Tumor Microenvironment in Cancer Immunotherapy. Adv Exp Med Biol 1036, 51–64, doi:10.1007/978-3-319-67577-0_4 (2017). - DOI - PubMed
    1. Benci JL et al. Opposing Functions of Interferon Coordinate Adaptive and Innate Immune Responses to Cancer Immune Checkpoint Blockade. Cell 178, 933–948 e914, doi:10.1016/j.cell.2019.07.019 (2019). - DOI - PMC - PubMed
    1. Hegde PS & Chen DS Top 10 Challenges in Cancer Immunotherapy. Immunity 52, 17–35, doi:10.1016/j.immuni.2019.12.011 (2020). - DOI - PubMed

Methods-only references

    1. Hanna A et al. Inhibition of Hedgehog signaling reprograms the dysfunctional immune microenvironment in breast cancer. Oncoimmunology 8, 1548241, doi:10.1080/2162402X.2018.1548241 (2019). - DOI - PMC - PubMed
    1. Zabala M et al. Optimization of the Tet-on system to regulate interleukin 12 expression in the liver for the treatment of hepatic tumors. Cancer Res 64, 2799–2804, doi:10.1158/0008-5472.can-03-3061 (2004). - DOI - PubMed
    1. Li C et al. Novel HDAd/EBV Reprogramming Vector and Highly Efficient Ad/CRISPR-Cas Sickle Cell Disease Gene Correction. Sci Rep 6, 30422, doi:10.1038/srep30422 (2016). - DOI - PMC - PubMed
    1. Zhang Z et al. USP49 deubiquitinates histone H2B and regulates cotranscriptional pre-mRNA splicing. Genes Dev 27, 1581–1595, doi:10.1101/gad.211037.112 (2013). - DOI - PMC - PubMed
    1. Dobin A et al. STAR: ultrafast universal RNA-seq aligner. Bioinformatics 29, 15–21, doi:10.1093/bioinformatics/bts635 (2013). - DOI - PMC - PubMed

Publication types