. 2021 Jan;2(1):18-33.
doi: 10.1038/s43018-020-00136-x. Epub 2020 Dec 7.

Immune-stimulating antibody conjugates elicit robust myeloid activation and durable antitumor immunity

Affiliations

Immune-stimulating antibody conjugates elicit robust myeloid activation and durable antitumor immunity

Shelley E Ackerman et al. Nat Cancer. 2021 Jan.

Abstract

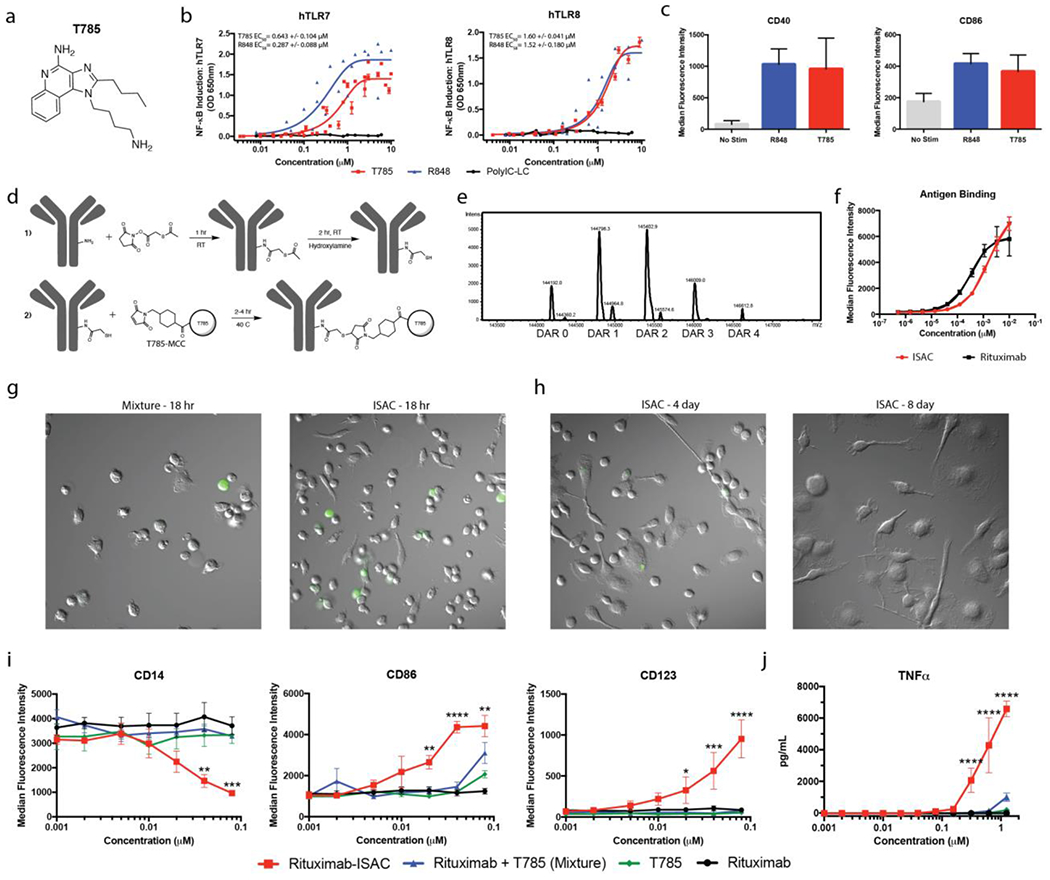
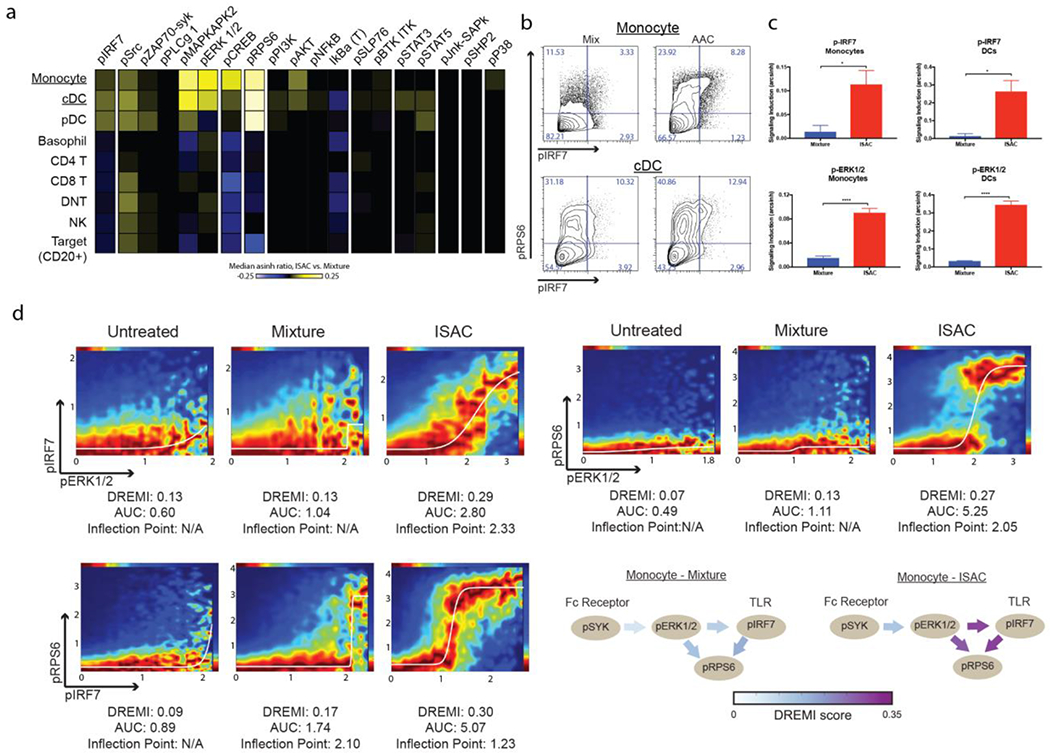
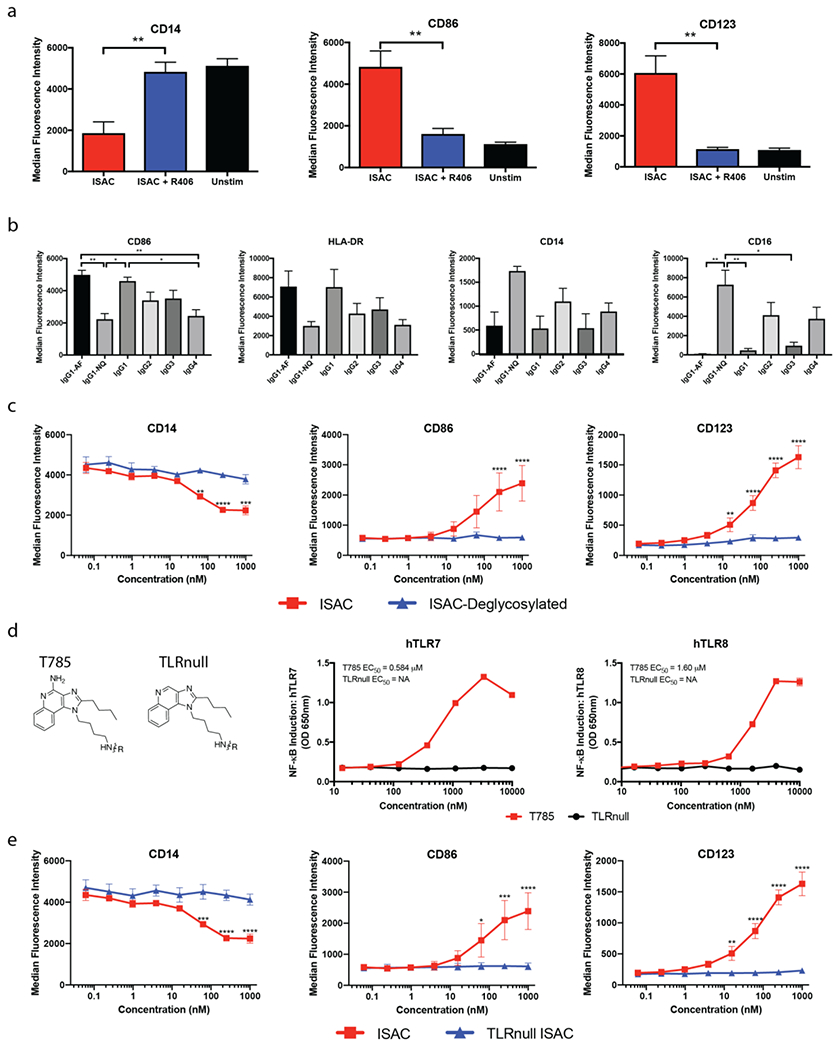
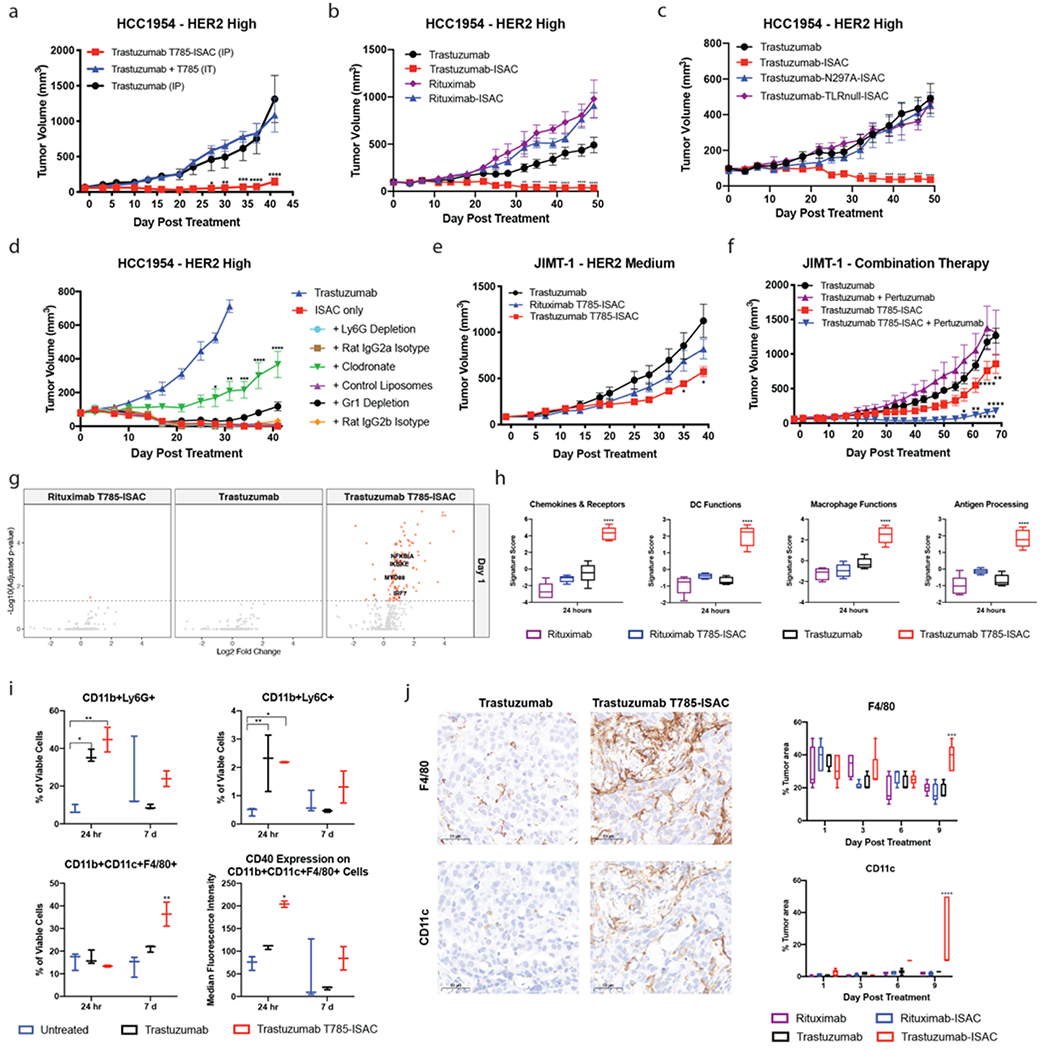
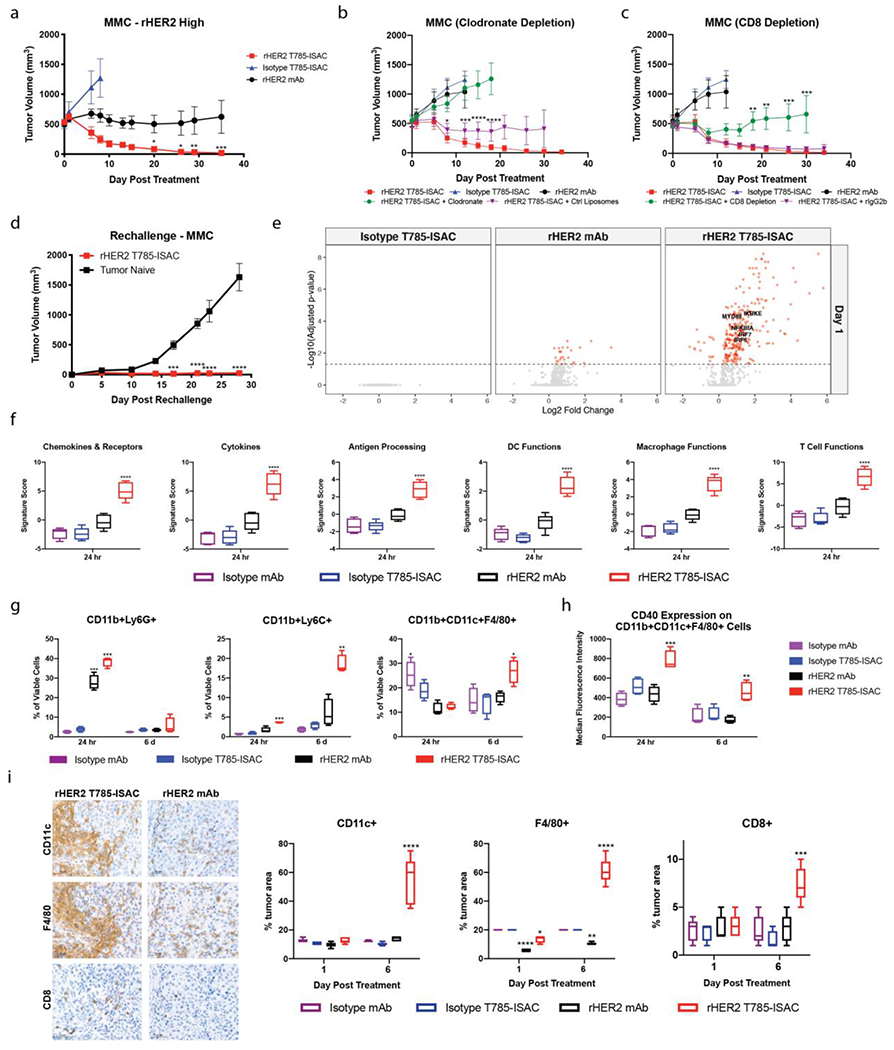
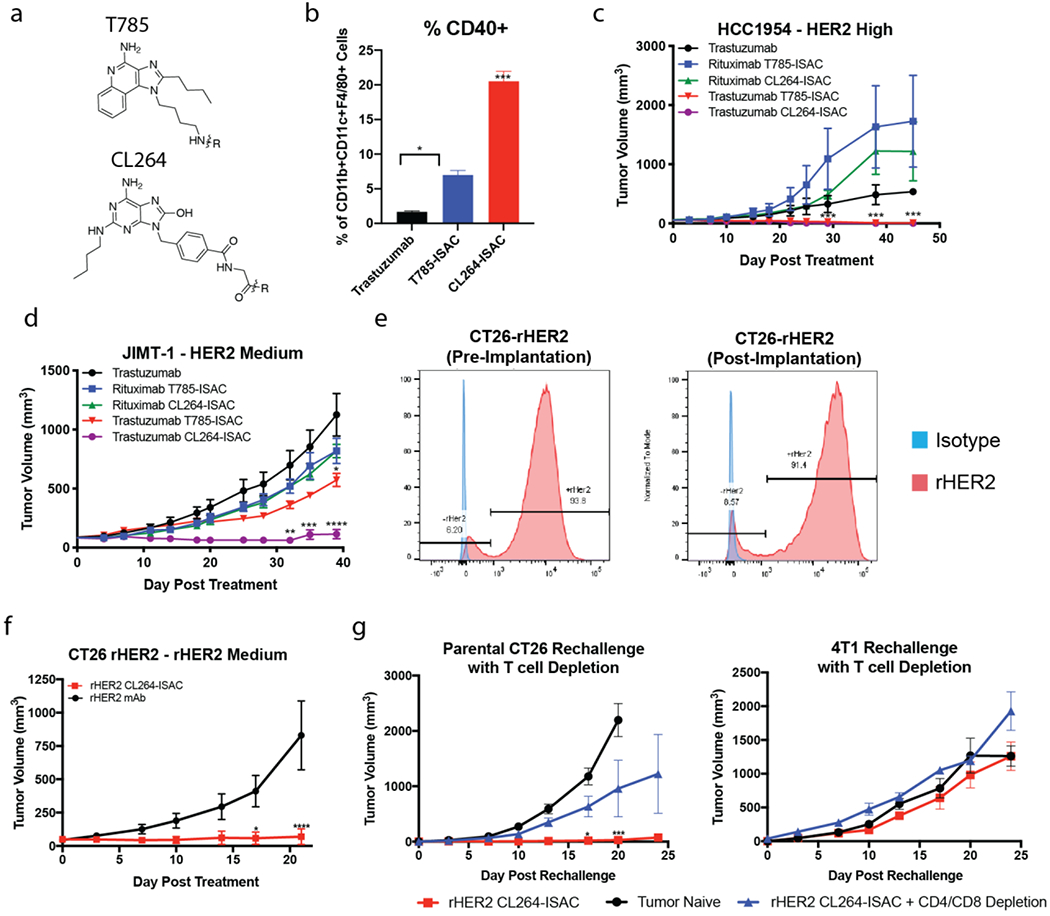
Innate pattern recognition receptor agonists, including Toll-like receptors (TLRs), alter the tumor microenvironment and prime adaptive antitumor immunity. However, TLR agonists present toxicities associated with widespread immune activation after systemic administration. To design a TLR-based therapeutic suitable for systemic delivery and capable of safely eliciting tumor-targeted responses, we developed immune-stimulating antibody conjugates (ISACs) comprising a TLR7/8 dual agonist conjugated to tumor-targeting antibodies. Systemically administered human epidermal growth factor receptor 2 (HER2)-targeted ISACs were well tolerated and triggered a localized immune response in the tumor microenvironment that resulted in tumor clearance and immunological memory. Mechanistically, ISACs required tumor antigen recognition, Fcγ-receptor-dependent phagocytosis and TLR-mediated activation to drive tumor killing by myeloid cells and subsequent T-cell-mediated antitumor immunity. ISAC-mediated immunological memory was not limited to the HER2 ISAC target antigen since ISAC-treated mice were protected from rechallenge with the HER2- parental tumor. These results provide a strong rationale for the clinical development of ISACs.


Conflict of interest statement

Competing Interests: All authors affiliated with Bolt Biotherapeutics, Inc are employees and hold stock options and/or equity in Bolt Biotherapeutics. E.G.E is a co-founder of Bolt Biotherapeutics. S.E.A, J.A.K, A.L, D.Y.J, E.G.E, and M.N.A are Stanford- and/or Bolt Biotherapeutics-affiliated inventors of PCT/US2017/041268.

Figures

Figure 1:
Figure 1:. ISAC Design and Characterization.
(a) Chemical structure of T785 (b) HEK-Blue-TLR7 or TLR8 reporter cells were cultured for 18 hours in the presence of T785, R848 or Poly-ICLC prior to assessment of NF-κB-induced SEAP activity. Data shown are from 8 experiments and EC50 values are calculated as mean with SEM. (c) Freshly isolated human myeloid APCs were stimulated with 1 μM of T785 or R848 for 18 hours prior to assessment of myeloid activation by flow cytometry. Data are from 1 experiment with 3 donors and are representative of >9 donors. (d) Rituximab was reacted with SATA via lysine residues to convert free amines into protected sulfhydryl groups prior to deacetylation with hydroxylamine and subsequent reaction with T785-MCC to yield the rituximab-ISAC. (e) LC-MS analysis of the rituximab-ISAC following PNGase F treatment. DAR was calculated based upon the linker-agonist mass addition of 606 g/mol. (f) Fluorescently labeled rituximab or rituximab-ISAC was incubated with CD20+ Toledo tumor cells at 4°C for 2 hours prior to analysis via flow cytometry. Data are from 1 experiment with triplicate samples and are representative of 2 experiments. (g-h) Freshly isolated human myeloid APCs were cultured with rituximab, T785, rituximab and T785 or the rituximab-ISAC in the presence of CFSE-labeled CD20+ Toledo tumor cells at a 3:1 effector to target ratio. The rituximab concentration is depicted on the X-axis with the concentration of T785 in these assays being consistent with the amount of T785 conjugated to the rituximab-ISAC. (g) Hoffman modulation contrast microscopy shown at 40X magnification after (g) 18 hours following stimulation with 80 nM of rituximab-ISAC. Data are representative of >10 donors. (h) Myeloid APCs were analyzed via flow cytometry 18 hours after stimulation. Data shown are from 3 donors and are representative of >10 donors (mean and SEM); *P<0.05, **P<0.01, ***P<0.001, ****P<0.0001.
Figure 2:
Figure 2:. ISACS elicit distinct signaling patterns in myeloid APCs.
(a-d) Freshly isolated human PBMC were stimulated with 1 μM of the rituximab-ISAC or an equimolar equivalent of the mixture in the presence of CD20+ Toledo tumor cells at a 1:1 ratio for 15 minutes. (a) The median arcsinh ratio of ISAC over signaling measured following mixture stimulation for various phosphoproteins as depicted by a heat map, with yellow indicative of increased signaling and blue indicative of reduced signal. (b) Representative flow cytometry plots for pIRF7 and pRPS6 in monocytes and cDCs. (c) Fold change of signaling induced was computed as the arcsinh ratio over the unstimulated control. IRF7 and ERK1/2 phosphorylation was measured in monocytes and cDCs following ISAC or mixture stimulation. Data are from one experiment with six donors (mean and SEM); *P<0.05, **P<0.01, ***P<0.001, ****P<0.0001. (d) Representative DREVI plots following DREMI analysis with the area under the curve (AUC) and inflection point (IP) denoted. DREVI plots were visually inspected for curve fit and signal-to-noise, and inflection points were calculated for those with proper sigmoidal curve fits (N/A indicates no curve fit).
Figure 3:
Figure 3:. ISACs require Fc effector function and TLR agonism to mediate myeloid activation.
Freshly isolated human myeloid APCs were cultured for 18 hours in the presence of CD20+ Toledo tumor cells at a 3:1 effector to target ratio and (a) 80 nM of the rituximab-ISAC with or without 1 μM R406, (b) rituximab-ISACs on the indicated antibody isotype, (c) rituximab-ISAC or deglycosylated rituximab-ISAC (ISAC-deglycosylated). (a-c) Cells were analyzed by flow cytometry and data is reported as median fluorescence intensity. (d) HEK-Blue-TLR7 or TLR8 reporter cells were cultured for 18 hours in the presence of T785 or TLRnull prior to assessment of NF-κB-induced SEAP activity. Data shown are from 1 experiment and representative of at least 3 experiments. (e) Freshly isolated human myeloid APCs were cultured for 18 hours in the presence of CD20+ Toledo tumor cells and the indicated rituximab-ISACs and analyzed by flow cytometry (data shown as median fluorescence intensity). (a-e) Data shown are representative of 1-4 additional experiments and ≥3 donors for each experiment (mean and SEM). Statistical significance is defined as *P<0.05, **P<0.01, ***P<0.001, ****P<0.0001.
Figure 4:
Figure 4:. T785-ISACs elicit robust anti-tumor immunity in trastuzumab-resistant tumor xenograft models.
(a-d) SCID/Beige or NSG mice were implanted with the HCC1954 tumor cell line and were randomized when the tumor volume reached 50 – 75 mm3. (a) Mice were treated once by intraperitoneal (IP) with 5 mg/kg trastuzumab T785-ISAC or trastuzumab, or with molar equivalent dosing with a mixture of trastuzumab and T785 to the ISAC via intra-tumoral (IT) injection. Data are from one experiment with n=3-5 mice per group. (b) Mice were treated via intraperitoneal injection with 5 mg/kg of trastuzumab, trastuzumab-ISAC, rituximab, or rituximab-ISAC Q5DX6 (n= 5 mice per group). (c) Mice were treated via intraperitoneal injection with 5 mg/kg of trastuzumab, trastuzumab T785-ISAC, trastuzumab N297A-ISAC, or trastuzumab TLRnull-ISAC (n=5 mice per group). (d) HCC1954 tumor cells were implanted into SCID/Beige mice, and cells of interest were depleted prior to and during trastuzumab T785-ISAC treatment (5 mg/kg, Q5DX3) using anti-Ly6G antibody (rat IgG2a control), clodronate liposomes (control liposomes as control) or anti-Gr1 antibody (rat IgG2b control). Data are from one experiment with n=4-6 mice per group. (e, f) NSG or Rag2/IL2rg double knockout mice were implanted with the JIMT-1 tumor cell line and randomized when the tumor volume reached 50 – 75 mm3. Mice were subsequently treated with the indicated treatments at 5 mg/kg intraperitoneally with a frequency of (e) Q5DX6 or (f) Q5DX5 (n=3-6 mice per group). (b-f) Data shown are representative of at least two experiments. (g-j) HCC-1954 tumors were harvested from cohorts of mice at the indicated timepoints after treatment with a single dose of 5 mg/kg ISAC or control antibodies. Tumors were processed for flow cytometry analysis, NanoString mRNA quantification or formalin fixed and paraffin embedded for immunohistochemistry. (g) Volcano plots depict log2 fold change of gene expression in treated vs isotype control tumors measured by NanoString at 24 hours (n=5 mice per group). Changes with an adjusted p value of < 0.05 are shown in red. (h) Gene signature scores quantified by nSolver Advanced Analysis Pathway Score for tumors analyzed 24 hours after treatment (n=5 mice per group). (i) Flow cytometry analysis of tumoral cellular composition 24 hours and 7 days following treatment (n=2-4 mice per group). Data are representative of at least 2 experiments. (j) Representative images as well as quantification of F4/80 and CD11c IHC of tumors harvested 9 days after each indicated treatment. Scale bars are 50 μm. (a-j) Data are shown as mean with SEM and statistics are shown with *P<0.05, **P<0.01, ***P<0.001, ****P<0.0001.
Figure 5:
Figure 5:. T785-ISACs elicit robust anti-tumor effects in MMC syngeneic tumor model.
(a-h) FVB/N-TgN (MMTV-Erbb2) mice were implanted with the MMC tumor cell line. (a) Female mice were randomized when the tumor volume reached about 500 mm3. Mice were then treated via intraperitoneal injection with 5 mg/kg q5d x 2 of mouse anti-rat HER2 antibody, mouse anti-rat HER2 T785-ISAC, or isotype T785-ISAC (TA99) (n=4-7 mice per arm). (b, c) Male mice were randomized when the tumor volume reached about 500 mm3 and were pre-treated starting one day before the initial treatment date with clodronate-loaded or control liposomes for phagocyte depletion (6 cycles, through Day 15) or anti-CD8 depleting antibody (rIgG2b control) for CD8 T cell depletion (8 cycles, through Day 21). Animals were treated with 5 mg/kg rHER2 T785-ISAC q5d x 2 (n=6 mice per group) intraperitoneally. For phagocyte depletion, statistics reflect comparison of T785-ISAC treatment with clodronate or control liposomes, while for CD8 T cell depletion, statistics reflect comparison of T785-ISAC with T785-ISAC + CD8 Depletion or T785-ISAC + rat isotype IgG2b. (d) Anti-rHER2 T785-ISAC treated mice that experienced complete tumor regression for >60 days after their last treatment were challenged with the MMC tumor cell line. Tumor naïve mice served as implantation controls (n=5 mice per group). (a-d) Data are representative of at least 2 experiments. Mice were humanely euthanized once tumors reached 2,000 mm3. Data are shown for those groups in which no tumors had reached 2,000 mm3.(e-i) Cohorts of mice were randomized when MMC tumors tumor volumes reached about 500 mm3 and treated with 5 mg/kg ISAC or control antibodies dosed at day 0 and day 5. Tumors were processed for cytokine measurement by MSD, flow cytometry analysis, NanoString mRNA quantification or formalin fixed and paraffin embedded for immunohistochemistry at the times shown. (e) Volcano plots depict log2 fold change of gene expression in treated vs isotype control tumors measured by NanoString at 24 hours (n=5 mice per group). Changes with an adjusted p value of < 0.05 are shown in red. (f) Gene signature scores quantified by nSolver Advanced Analysis Pathway Score for tumors analyzed 24 hours after treatment (n=5 mice per group). (g, h) Flow cytometry analysis of tumoral cellular composition and activation state 24 hours and 6 days following initiation of treatment (n=4 mice per group). Data are representative of at least 2 experiments. (i) Representative images as well as quantification of F4/80, CD11c and CD8 IHC of tumors harvested 6 days after each indicated treatment. Scale bars are 50 μm. (a-i) Data are reported as mean and SEM; *P<0.05, **P<0.01, ***P<0.001, ****P<0.0001.
Figure 6:
Figure 6:. CL264-containing ISACs elicit tumor clearance in HER2 medium expressing xenografts and T cell mediated tumor clearance, immunologic memory, and epitope spreading in a syngeneic tumor model.
(a) Chemical structures of T785 and CL264 adjuvants used for ISAC generation. (b) NSG mice implanted with the HCC1954 tumor cell line were randomized when the tumor volume reached 50 – 75 mm3. Mice were treated with once via intraperitoneal injection of 5 mg/kg trastuzumab, trastuzumab T785-ISAC or trastuzumab CL264-ISAC. Tumors were harvested 20 hours post administration, processed to a single cell suspension, and analyzed by flow cytometry to assess activation of tumor-infiltrating myeloid APCs. (c-d) NSG or Rag2/IL2rg double knockout mice were implanted with the indicated human tumor cell line and randomized when the tumor volume reached 50 – 75 mm3 (HCC1954) or 75 – 150 mm3 (JIMT-1). Mice were treated via intraperitoneal injection with 5 mg/kg of rituximab, trastuzumab, trastuzumab T785-ISAC, trastuzumab CL264-ISAC or the respective isotype-ISACs, every 5 days for a total of 6 treatments. (e) rHER2 expression was measured on CT26-rHER2 tumor cells in culture prior to implantation (left flow plot) and in tumors nine days post-implantation (right flow plot) by flow cytometry with fluorescently-conjugated anti-rHER2 antibody (red) or an isotype control (blue). (f) Balb/c mice were implanted with the CT26-rHER2 tumor cell line and were randomized when the tumor volume reached 50 mm3. Mice were then treated via intraperitoneal injection with 10 mg/kg of mouse anti-rat HER2 or mouse anti-rat HER2 CL264-ISAC every 5 days for a total of 6 treatments. Data shown are from 1 experiment with 8 mice per arm and are representative of 3 experiments. (g) Anti-rat HER2 CL264-ISAC treated mice that experienced complete tumor regression for >21 days after their last treatment were challenged with parental CT26 (left flank) and 4T1 cell lines (right flank), with or without CD4 and CD8 T cell depletion (n =3 each). Tumor naïve mice (n = 6) challenged with the parental CT26 and 4T1 cell lines were included as controls. (a-i) Data are shown from individual experiments with 3-6 mice per arm and are representative of 1-4 experiments with a minimum of 3 mice per arm in each experiment. Data are shown as mean with SEM and statistics are shown with *P<0.05, **P<0.01, ***P<0.001, ****P<0.0001.

Comment in

  • ISACs take a Toll on tumors.
    Demaria O, Vivier E. Demaria O, et al. Nat Cancer. 2021 Jan;2(1):12-13. doi: 10.1038/s43018-020-00152-x. Nat Cancer. 2021. PMID: 35121891 No abstract available.

References

    1. Davis TA et al. Rituximab anti-CD20 monoclonal antibody therapy in non-Hodgkin’s lymphoma: safety and efficacy of re-treatment. J Clin Oncol 18, 3135–3143, doi:10.1200/JCO.2000.18.17.3135 (2000). - DOI - PubMed
    1. Grillo-Lopez AJ et al. Rituximab: the first monoclonal antibody approved for the treatment of lymphoma. Curr Pharm Biotechnol 1, 1–9 (2000). - PubMed
    1. Lizotte PH et al. Multiparametric profiling of non-small-cell lung cancers reveals distinct immunophenotypes. JCI Insight 1, e89014, doi:10.1172/jci.insight.89014 (2016). - DOI - PMC - PubMed
    1. Spranger S et al. Density of immunogenic antigens does not explain the presence or absence of the T-cell-inflamed tumor microenvironment in melanoma. Proc Natl Acad Sci U S A 113, E7759–E7768, doi:10.1073/pnas.1609376113 (2016). - DOI - PMC - PubMed
    1. Beatty GL & Gladney WL Immune escape mechanisms as a guide for cancer immunotherapy. Clin Cancer Res 21, 687–692, doi:10.1158/1078-0432.CCR-14-1860 (2015). - DOI - PMC - PubMed

Publication types

Substances