. 2021 Jun;2(6):611-628.
doi: 10.1038/s43018-021-00223-7. Epub 2021 Jun 23.

Downregulation of the FTO m6A RNA demethylase promotes EMT-mediated progression of epithelial tumors and sensitivity to Wnt inhibitors

Affiliations

Downregulation of the FTO m6A RNA demethylase promotes EMT-mediated progression of epithelial tumors and sensitivity to Wnt inhibitors

Jana Jeschke et al. Nat Cancer. 2021 Jun.

Abstract

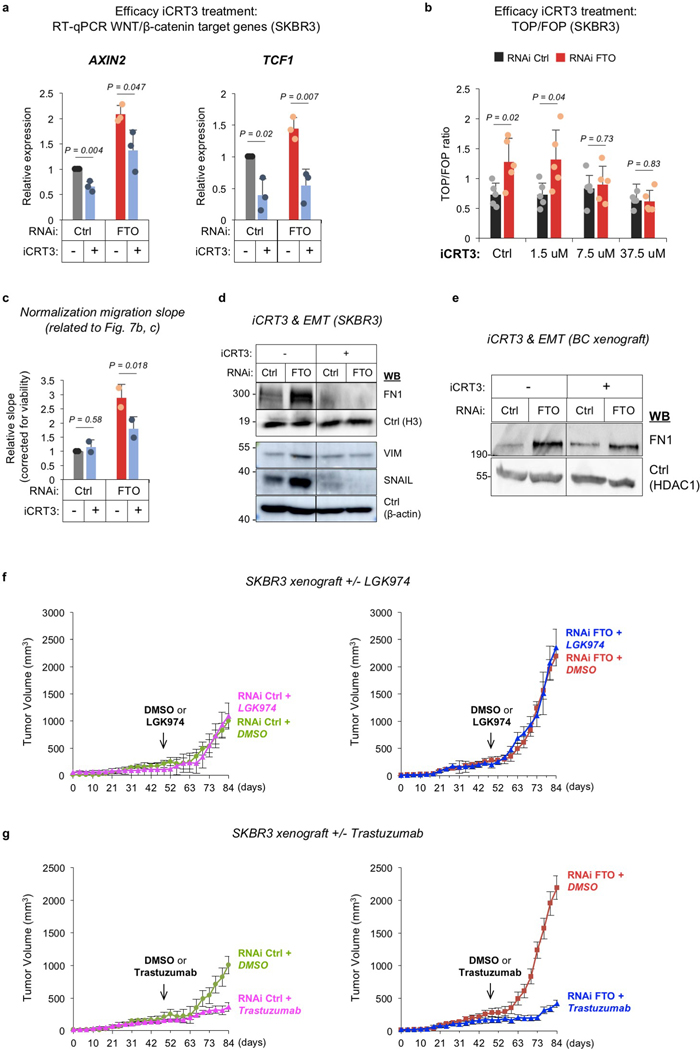
Post-transcriptional modifications of RNA constitute an emerging regulatory layer of gene expression. The demethylase fat mass- and obesity-associated protein (FTO), an eraser of N6-methyladenosine (m6A), has been shown to play a role in cancer, but its contribution to tumor progression and the underlying mechanisms remain unclear. Here, we report widespread FTO downregulation in epithelial cancers associated with increased invasion, metastasis and worse clinical outcome. Both in vitro and in vivo, FTO silencing promotes cancer growth, cell motility and invasion. In human-derived tumor xenografts (PDXs), FTO pharmacological inhibition favors tumorigenesis. Mechanistically, we demonstrate that FTO depletion elicits an epithelial-to-mesenchymal transition (EMT) program through increased m6A and altered 3'-end processing of key mRNAs along the Wnt signaling cascade. Accordingly, FTO knockdown acts via EMT to sensitize mouse xenografts to Wnt inhibition. We thus identify FTO as a key regulator, across epithelial cancers, of Wnt-triggered EMT and tumor progression and reveal a therapeutically exploitable vulnerability of FTO-low tumors.


Figures

Extended Data Fig. 1
Extended Data Fig. 1. FTO downregulation promotes tumorigenesis in breast cancer
a, FTO expression in the Affymetrix data meta-analysis cohort (left, 171 normal vs. 812 tumor breast tissues, p=5e-50). RT-qPCR quantification of FTO in an in-house cohort (right, 9 normal vs. 47 tumor breast tissues, p=0.005), normalized to ACTB and SDHA. The box defines the IQR split by the median, with whiskers extending to the most extreme values within 1.5×IQR beyond the box. P values calculated by two-tailed t-test. b, Quantification of m6A levels by mass spectrometry in paired human normal and tumor breast samples (n=6 per group, pairs connected with line, red dots represent the group medians, two-tailed paired t-test, p=0.046). c, Validation of FTO depletion by two shRNAs in SKBR3 cells by RT-qPCR (upper panel, mean + SD, pRNAi#1=6e-10; pRNAi#2=0.0045, nRNAi#1=7; nRNAi#2=3), normalized to ACTB and SDHA) and western blotting (lower panel, representative of n=3 independent replicates with histone H3 as loading control). P values calculated by two-tailed paired t-test. d, Light microscopy imaging of mammospheres formed by RNAi Ctrl and RNAi FTO SKBR3 cells with scale bar of 100μm (representative of n=3 independent experiments). e, Effects of FTO knockdown on colony-forming capacity (left, p=0.001) and mammosphere-forming capacity (right, p=0.02) in SKBR3 cells with a second shRNA (RNAi FTO #2). Data from n=3 technical replicates (mean + SD) within a single experiment, representative of 3 biologically independent experiments provided as Source Data. P values calculated by two-tailed t-test. f, Representative western blot of doxycycline-induced overexpression of wild-type FTO (FTO-WT) and of a catalytically inactive FTO mutant (FTO-MUT) in SKBR3 cells (upper panel) with β-actin as loading control (n=3). Effect of FTO-WT and FTO-MUT overexpression on colony formation and mammosphere formation in SKBR3 cells (bottom). Data from n=3 technical replicates (mean + SD) within a single experiment, representative of 3 and 2 biologically independent experiments, respectively, provided as Source Data. P values calculated by two-tailed t-test, as indicated. g, FTO depletion by shRNA in breast cancer MCF7 cells (n=6) by RT-qPCR. Data as mean + SD, normalized to ACTB and SDHA. P values calculated by two-tailed paired t-test (p=4e-6).
Extended Data Fig. 2
Extended Data Fig. 2. Depletion of FTO promotes breast cancer cell motility and metastases
a-b, Real-time chemotactic invasion (a) and migration (b) of RNAi FTO (red, shRNA #1 and #2, respectively) and RNAi control SKBR3 cells (green). c, Wound scratch assay performed with RNAi Ctrl and RNAi FTO SKBR3 cells. Representative pictures (left) with quantification of wound closure (as percentage of the width at t=0, right). Data from a single experiment, representative of n=2 biologically independent experiments provided as Source Data. d, Cell viability by MTT assay (left, mean + SD, n=5, two-tailed paired t-test, p=0.37) and real-time proliferation (right) of FTO-depleted and control SKBR3 cells. e, Western blotting of FTO depletion and rescue by overexpression of wild-type FTO (FTO-WT) or a catalytically inactive FTO mutant (FTO-MUT) in SKBR3 cells (upper panel, n=3 with β-actin as loading control) and real-time chemotactic migration (lower panel). f, Expression of FTO in PDX shown by immunochemistry. Representative image of tissue sections with scale bar of 250μm (n=3). g, Metabolism imaging with 18F-FDG PET of subiliac lymph nodes xenograft mice bearing RNAi Ctrl (black, n=4) or RNAi FTO (red, n=5) SKBR3 tumors. Representative images (9 weeks after inoculation) are shown (pathological uptake in LN encircled; physiological uptake in bladder (Bl)). The box defines the IQR split by the median, with whiskers extending to the most extreme values within 1.5×IQR beyond the box. P-value calculated by two-tailed t-test (p=0.0061). h, Kaplan-Meier based on FTO expression and disease-specific survival in the breast cancer METABRIC cohort (n(high FTO)=660, n(low FTO)=661, logrank test, p=7e-4). i, Forest plot showing association between FTO expression and distant-metastasis-free survival in breast cancer. Data shown as hazard ratio (log2), with 95% confidence interval, for both the aggregate KM Plot data set (“overall”, presented in Fig. 2f) and individual cohorts. The number of samples (n) and p values (calculated by two-sided logrank tests, in bold if p < 0.05) are indicated for each cohort. Data for (a), (b), (d), (e) are from n=3 technical replicates (mean + SD) within a single experiment, representative of 3 biologically independent experiments (except for (e): 2 replicates). Independent repeats have been deposited on the Figshare repository (DOI: 10.6084/m9.figshare.14602965).
Extended Data Fig. 3
Extended Data Fig. 3. Extended Data Fig. 3. FTO depletion in prostate, cervical and lung cancers
a, FTO depletion by shRNA in PC3 prostate cancer cells by RT-qPCR (left). Mean + SD from 3 independent experiments, normalized to ACTB and SDHA. P value calculated by two-tailed paired t-test (p=0.004). Representative western blot (right) of FTO depletion in PC3 cells (n=3) with β-actin as loading control. b, Nude mice were injected subcutaneously with PC3 prostate cells and tumors was monitored every two days (n=6 tumors per group; mean ± SEM, p=0.0002, two-way ANOVA). c, Real-time chemotactic invasion of RNAi FTO (red) and RNAi control PC3 cells (green). d, FTO depletion by shRNA in Ca Ski cervical cancer cells (left, n=3, p=0.009) and H1650 lung cancer cells (right, n=3, p=0.0004) by RT-qPCR. Data as mean + SD, normalized to ACTB and SDHA. P values calculated by two-tailed paired t-test. e, Effects of FTO knockdown on tumorsphere-forming capacity in Ca Ski (left, p=0.02) and H1650 cells (right, p=0.008). Data from n=3 technical replicates (mean + SD) within a single experiment, representative of 2 biologically independent experiments provided as Source Data. P values calculated by two-tailed t-test. f, Real-time chemotactic migration of FTO-depleted (red) and control (green) H1650 cells. g-h, Kaplan-Meier curves showing the overall survival of patients with either high-FTO or low-FTO lung tumors (n(high FTO)=333, n(low FTO)=326, logrank test, p=0.0073) (g) or uterine tumors (n(high FTO)=310, n(low FTO)=232, logrank test, p=0.048) (h). Motility data in (c), (f) from n=3 technical replicates (mean + SD) within a single experiment, representative of 2 and 3 biologically independent experiments, respectively. Independent repeats have been deposited on the Figshare repository (DOI: 10.6084/m9.figshare.14602971).
Extended Data Fig. 4
Extended Data Fig. 4. FTO downregulation promotes EMT in several cancers
a, Representative light microscopy imaging of RNAi Ctrl or RNAi FTO SKBR3 cells (n=3 independent experiments). Cells displaying elongated morphology and extended pseudopodia are indicated with arrows. Scale bars represent 50μm. b, Representative western blot of mesenchymal EMT markers in FTO-depleted (RNAi FTO) and control (RNAi Ctrl) SKBR3 cells (n=3) with HDAC1 as loading control. c, Immunochemistry staining of EMT markers in SKBR3 xenografted tumors (from Fig. 1e at endpoint). Percent VIM and FN1 positive cells (n = 3 fields × 3 tumors per group; mean + SEM). P-values calculated by two-tailed t-test (pVIM=0.0002; pFN1<0.0001). d, Real-time chemotactic migration of FTO-depleted and control SKBR3 cells in the absence and presence of TGFβ. Data from n=3 technical replicates (mean + SD) within a single experiment, representative of 3 biologically independent experiments. Independent repeats have been deposited on the Figshare repository (DOI: 10.6084/m9.figshare.14602986). e, Relative gene expression of mesenchymal (VIM, MMP2) and epithelial (FSTL3) EMT marker genes, as estimated by RT-qPCR in SKBR3 cells following RNAi of FTO, treated or not with TGFβ. Mean + SD from n=3 independent experiments, normalized to ACTB and SDHA. P values calculated by two-tailed paired t-test as indicated. f, Representative western blot of mesenchymal EMT markers FN1 and SLUG in FTO-depleted and control PC3 cells (n=3) with β-actin and histone H3 as loading controls. g, Relative gene expression of mesenchymal EMT marker genes, as estimated by RT-qPCR in MCF7 (left, n=4 except for nFN1=3) and H1650 (right, n=3 except for nSLUG=4) cells following RNAi of FTO. Mean + SD, normalized to ACTB and SDHA. P values calculated by two-tailed t-test. Representative western blot of mesenchymal EMT markers FN1, CDH1 and SLUG in FTO-depleted and control MCF7 (left) and H1650 (right) cells (n=3) with HSP90 and HDAC1 as loading controls. h, Immunochemistry staining of VIM in PC3 xenografted tumors (from Fig. 3c at endpoint). Percent VIM positive cells (n =3 fields × 3 tumors per group; mean + SEM). P-value calculated by two-tailed t-test (p=0.0008). Scale bars represent 250μm.
Extended Data Fig. 5
FTO loss upregulates W_n_t_/_β-catenin signaling in breast and prostate cancers a, Numbers of m6A peaks and related transcripts identified by m6A-seq in RNAi Ctrl and RNAi FTO SKBR3 cells (upper panel, two independent biological replicates). Scatterplot displaying differentially m6A-methylated peaks (lower panel, hyper and hypo = peaks with increased and decreased m6A in FTO-depleted cells, respectively). b-d, Visualization of the IP m6A signal in RNAi FTO and RNAi Ctrl SKBR3 cells at the DVL3, FZD1, SOX11, MARK2, CSNK1G2 (b), CTNNB1 (c), and WNT5A (d) transcripts. e, Representative western blot of β-catenin in RNAi FTO #2 and RNAi Ctrl #2 SKBR3 cells with β-actin as loading control (n=3). f, Representative western blot of cytoplasmic and nuclear β-catenin in RNAi FTO and RNAi Ctrl SKBR3 cells (n=3). Loading controls: β-Tubulin (cytoplasmic) and histone H3 (nuclear). Wnt3a treatment as positive control for nuclear translocation of β-catenin. g, Representative immunofluorescence staining of β-catenin (red) and DAPI (blue) in RNAi Ctrl and RNAi FTO SKBR3 (n=3). Scale bars represent 20μm. h, Relative gene expression of Wnt/β-catenin targets measured by RT-qPCR in SKBR3 cells. Mean + SD from n=6 independent replicates (except for n(TCF1)=5), normalized to ACTB and SDHA. Two-tailed paired t-tests: pTCF1<0.0001; pAXIN2=0.0001; pNMYC=0.001. i, Western blot of total β-catenin in RNAi FTO vs. RNAi Ctrl from SKBR3 xenografted tumors in mice (n=4 per group) with β-actin as loading control. j, Numbers of m6A peaks and related transcripts identified in three human breast cancer biopsies by m6A-seq (upper left panel). The m6A motif (upper right) retrieved from sample BC1 includes the consensus motif DRACH. Bar graph displaying the distribution of m6A peaks relatively to transcriptomic regions (lower panel, representative of sample BC1). k, m6A IP signal at transcripts related to the Wnt/β-catenin signaling (CSNK1G2, MARK2, AXIN1 and FZD1), in three human breast cancer biopsies.
Extended Data Fig. 6
Extended Data Fig. 6. Decreased expression of Wnt-related FTO target gene CSNK1D
a, Numbers of m6A peaks and related transcripts identified by m6A-seq in RNAi Ctrl and RNAi FTO PC3 cells (upper panel, two independent biological replicates). Schematic representation of m6A/FTO mRNA targets (red asterisks) identified within the Wnt/β-catenin signaling pathway (lower panel). b, Visualization of the IP m6A signal in RNAi FTO and RNAi Ctrl PC3 cells at the WNT3A and GSK3B transcripts. c, Representative immunochemistry staining of β-catenin in PC3 xenografted tumors with scale bar at 250μm. Percent β-catenin positive cells (right, n =3 fields × 3 tumors per group; mean + SD). Two-tailed t-test, p=0.005. d, Relative quantification of the CSNK1D levels in RNAi FTO and RNAi Ctrl SKBR3 cells displayed in the western blot shown in Fig. 6a. e, Western blot showing the level of CSNK1D in an independent biological replicate of RNAi FTO and RNAi Ctrl SKBR3 cells (left, with HDAC1 as loading control, related to Fig. 6a). Relative quantification of CSNK1D levels (right). Western blot data in (d-e) are representative of n=3 biologically independent experiments and normalized to HDAC1.
Extended Data Fig. 7
Extended Data Fig. 7. FTO-low tumors are sensitive to WNT inhibitor therapy
a, Relative gene expression of Wnt/β-catenin target genes AXIN2 and TCF1, as estimated by RT-qPCR, in SKBR3 cells following RNAi of FTO, treated or not with iCRT3. Mean + SD from 3 independent experiments, normalized to ACTB and SDHA. P values calculated by two-tailed t-test, as indicated. b, Wnt/β-catenin transcriptional activity, as measured by TOPFlash β-catenin/TCF-LEF reporter assay performed on SKBR3 cells following RNAi of FTO, in the absence and presence of iCRT3 (mean + SD, n=5, iCRT3 doses as indicated). P values calculated by two-tailed t-test, as indicated. c, The invasion capacity, as shown in Fig. 7b, was quantified by the slope of the invasion curves and corrected for cell viability (as measured by MTT assay in Fig. 7c, from 2 biologically independent experiments). P-values calculated by two-tailed t-test (p(RNAi Ctrl)=0.58, p(RNAi FTO)=0.018). d, Levels of the mesenchymal EMT marker proteins FN1, VIM and SNAIL in RNAi Ctrl and RNAi FTO SKBR3 cells in the absence and presence of iCRT3 (n=3) with histone H3 and β-actin as loading controls. e, Levels of FN1 protein in FTO-depleted and control tumors derived from SKBR3 xenografts treated with iCRT3 or vehicle (DMSO), with β-actin as loading control (n=3 independent experiments). f, Nude mice growing tumors from RNAi Ctrl (left) or RNAi FTO (right) SKBR3 cells were treated with LGK974 (n=5 tumors per group, mean ± SEM). P values calculated by two-way ANOVA (p(RNAi Ctrl)=0,69; p(RNAi FTO)=0.48). g, Nude mice growing tumors from RNAi Ctrl (left) or RNAi FTO (right) PC3 cells were treated with or without Trastuzumab (n=5 tumors per group, mean ± SEM). P values calculated by two-way ANOVA, (p(RNAi Ctrl)<0.0001; p(RNAi FTO)<0.0001).
Figure 1.
Figure 1.. FTO loss enhances breast tumorigenesis.
a, Downregulation of FTO expression in several cancers (red) versus normal tissues (green) in TCGA. The number of samples (n) is indicated below each tissue type. P-values calculated by two-tailed t-test. Effect size estimated by Cohen’s distance: d(bladder)=0.61, d(breast)=1.39, d(cervix)=1.49, d(glioblastoma)=1.57, d(kidney)=2.22, d(lung)=0.98, d(prostate)=0.90, d(thyroid)=1.06, d(uterine)=1.36. b, Global m6A levels by mass spectrometry in human breast cancer biopsies with low (n=25) or high (n=15) FTO expression. P-value calculated by two-tailed t-test (p=0.0029). c, Downregulation of FTO expression in breast cancer subtypes (red: basal-like; pink: HER2-like; dark blue: luminal A; light blue: luminal B) compared to normal breast (grey) in TCGA. The number of samples (n) is indicated for each group. P-values calculated by two-tailed t-test (versus normal breast), as indicated. d, Effects of FTO knockdown by shRNA on colony-forming capacity (CFU: colony-forming units, left, p=0.0003) and mammosphere-forming capacity (right, p=0.03) in SKBR3 cells. Data from n=3 technical replicates (mean + SD) within a single experiment, representative of 3 biologically independent experiments provided as Source Data. P-values calculated by two-tailed t-test. e, FTO depletion enhances tumor engraftment in nude mice subcutaneously injected with SKBR3 breast cells (n=6 tumors per group; mean ± SEM, p=0.0052, two-way ANOVA). f, Immunochemistry analysis of tumors from SKBR3 xenograft from (e) at endpoint. Representative images of tissue sections are shown, scale bar =250μm. Percent Ki67, CASP3 and CD31 positive cells (n=3 fields × 3 tumors per group; mean + SEM). P-values calculated by two-tailed t-test (pKi67<0.0001; pCASP3=0.5; pCD31=0.0006). g, Effects of FTO knockdown on colony-forming capacity (upper panel, p=0.0004) and mammosphere-forming capacity (lower panel, p=0.006) in MCF7 cells. Data from n=3 technical replicates (mean + SD) within a single experiment, representative of 2 biologically independent experiments provided as Source Data. P-values calculated by two-tailed t-test. h, Nude mice were injected as indicated in panel (e) with MCF7 breast cells (n=6 tumors per group; mean ± SEM, p<0.0001, two-way ANOVA). Boxes in the box plots of (a), (b), (c) define the interquartile range (IQR) split by the median, with whiskers extending to the most extreme values within 1.5×IQR beyond the box.
Figure 2.
Figure 2.. FTO loss promotes breast cancer cell motility and metastases.
a-b, Real-time chemotactic migration of FTO-depleted (red) and control (green) SKBR3 (a) or MCF7 (b) cells. Data from n=3 technical replicates (mean + SD) within a single experiment, representative of 3 biologically independent experiments. Independent repeats have been deposited on the Figshare repository (DOI: 10.6084/m9.figshare.14602932) c, Breast tumor PDXs in nude mice (pre)-treated with either control vehicle (black) or the FTO inhibitor MA (red, n=3 tumors per group, mean ± SEM, p=0.01, tested by mixed effects model via Restricted Maximum Likelihood). d, Tumor metabolism imaging with 18F-FDG positron emission tomography (PET) of xenograft mouse models bearing RNAi Ctrl (black, n=4) or RNAi FTO (red, n=5) SKBR3 tumors. Representative 18F-FDG PET/CT images (9 weeks after inoculation) are shown (pathological uptake in tumors encircled; physiological uptake in brain (B), kidneys (K), bladder (Bl), brown fat and muscular activity). Quantification of tumor metabolism presented as the 18F-FDG uptake in SUVmax. P-value calculated by two-tailed t-test (p=0.03). e, FTO depletion increases metastatic burden in tail vein injection of SKBR3 cells. Metabolic activity in lung and liver of mice bearing either an RNAi Ctrl (n(lung)=13, n(liver)=14) or a RNAi FTO tumor (n(lung)=14, n(liver)=14) is quantified on the basis of 18F-FDG uptake into SUVmax (uptake in liver (Li), lung (Lu), physiological uptake in heart (H), gallbladder (G)). P-values calculated by two-tailed t-test (plung=0.043; pliver=0.009). f, Box plot displaying median FTO expression according to the tumor grade (left, Kruskal-Wallis test, p=1.33e-8) or to lymph node (LN) invasion (middle, Wilcoxon test, p=6.82e-6). Kaplan-Meier analysis based on FTO expression and distant-metastasis-free survival in breast cancer patients (right; n(high FTO)=594, n(low FTO)=577, logrank test, p=0.0009). Boxes in the box plots of (d), (e), (f) define the interquartile range (IQR) split by the median, with whiskers extending to the most extreme values within 1.5×IQR beyond the box.
Figure 3.
Figure 3.. FTO loss promotes tumor progression in several cancers.
a, Global m6A levels by mass spectrometry in human prostate cancer biopsies with low (n=13) or high (n=6) FTO expression. P-value calculated by two-tailed t-test (p=0.017). b, Effects of FTO knockdown on colony-forming capacity (left, p=0.001) and tumorsphere-forming capacity (right, p=0.006) in PC3 prostate cancer cells. P-value calculated by two-tailed t-test. c, Real-time chemotactic migration of FTO-depleted (red) and control (green) PC3 cells. d, Effects of FTO knockdown on colony-forming capacity in Ca Ski cervical cancer cells (left, p=0.022) and H1650 lung cancer cells (right, p=0.016). P-values calculated by two-tailed t-test. e, Real-time chemotactic migration of FTO-depleted (red) and control (green) Ca Ski cells. f, Box plot displaying FTO expression in human biopsies of benign (n=6), localized (n=7), and metastatic primary (n=6) prostate tumors (left, one-way ANOVA, p=0.005). Kaplan-Meier analysis showing relapse-free survival for prostate cancer patients from TCGA, according to the level of tumoral FTO expression (right; n(high FTO)=174, n(low FTO)=174, logrank test, p=0.04). g, FTO depletion increases metastatic burden in tail vein injection of PC3 cells. Metabolic activity in lung and liver of mice bearing either an RNAi Ctrl (n(lung)=14, n(liver)=10) or a RNAi FTO tumor (n(lung)=18, n(liver)=15) quantified on the basis of 18F-FDG uptake into SUVmax (uptake in liver (Li), lung (Lu), physiological uptake in heart (H), gallbladder (G)). P-values calculated by two-tailed t-test (plung=0.002; pliver=0.04). Boxes in the box plots of (a), (f), (g) define the interquartile range (IQR) split by the median, with whiskers extending to the most extreme values within 1.5×IQR beyond the box. Clonogenicity and motility data in (b-e) are from n=3 technical replicates (mean + SD) within a single experiment, representative of 3 biologically independent experiments, provided as Source Data for clonogenicity experiments. For motility assays in (c), (e), independent repeats have been deposited on the Figshare repository (DOI: 10.6084/m9.figshare.14602944).
Figure 4.
Figure 4.. FTO loss elicits an EMT program.
a, GSEA from RNA-seq data (n= 5 per group) in FTO-depleted versus control SKBR3 cells. b, Heatmap showing expression changes (Δ z-score (RNAi FTO – RNAi Ctrl)) for genes of the EMT hallmark signature from panel (a) (with p<0.05 by two-tailed paired t-test) in n=5 paired replicates of SKBR3 cells. c, Relative gene expression of epithelial (upper panel) and mesenchymal (lower panel) EMT marker genes, measured by RT-qPCR in SKBR3 cells following FTO RNAi. Mean + SD, normalized to ACTB and SDHA, n=7 independent replicates (except for n(SLUG)=6; n(ZEB1)=5). P-values calculated by two-tailed t-test, as indicated. d, Western blot of EMT markers in RNAi FTO vs. RNAi Ctrl tumors issued from SKBR3 xenografts in mice (n=4 per group), with β-actin as loading control. e, Relative gene expression of epithelial (left) and mesenchymal (right) EMT marker genes, measured by RT-qPCR in PC3 cells following FTO RNAi. Mean + SD, normalized to ACTB and SDHA, n=5 independent replicates (except for n(TWIST1)=4). P-values calculated by two-tailed t-test. f-h, Box plots displaying FTO expression in human tumors (TCGA) with low or high EMT signature scores in (f) breast cancer (p<0.0001), (g) prostate cancer (p<0.0001) and (h) from left to right: cervical squamous cell carcinoma (n=61 per group); glioblastoma (n=31 per group); lung adenocarcinoma and squamous cell carcinoma (n=205 per group); thyroid carcinoma (n=101 per group); uterine corpus endometrial carcinoma (n=110 per group). The box defines the IQR split by the median, with whiskers extending to the most extreme values within 1.5×IQR beyond the box. P-values calculated by two-tailed t-test, as indicated.
Figure 5.
Figure 5.. FTO controls Wnt signaling in cancer.
a, IPA-performed GO analysis of transcripts that gained m6A upon FTO depletion in SKBR3 cells. Top 10 pathways (by p-value) are shown. b, Schematic representation of m6A/FTO mRNA targets (red asterisks) identified within the Wnt/β-catenin signaling pathway. c, Visualization of the IP m6A signal in RNAi FTO and RNAi Ctrl SKBR3 cells for APC2 and AXIN1 transcripts. d, Representative western blot of total β-catenin in FTO-depleted and control SKBR3 cells (n=3). e, TOPFlash β-catenin/TCF-LEF reporter assay performed on FTO RNAi and control SKBR3 cells (mean + SD, n=6 per group, p-values calculated by two-tailed t-test, as indicated). Wnt3a treatment as positive control for β-catenin-dependent transcriptional activity. f, Heatmap showing the correlation between the expression of Wnt-related genes identified as FTO targets and representative mesenchymal markers of the EMT hallmark signature (shown in Fig. 4b) measured by RNA-seq in 5 pairs of replicates of SKBR3 cells, following FTO RNAi. g, Immunochemistry staining of β-catenin in SKBR3 xenografted tumors (from Fig. 1e at endpoint). Percent β-catenin positive cells (right, n =3 fields × 3 tumors per group; mean + SEM). P-value calculated by two-tailed t-test (p=0.002). h, GO analysis of m6A-enriched transcripts in human breast cancer biopsies. i, Inverse correlation between FTO expression and β-catenin signal intensity in human breast cancer biopsies (n is the number of tumors, two-tailed Mann-Whitney U test, p=0.045). The box defines the IQR split by the median, with whiskers extending to the most extreme values within 1.5×IQR beyond the box. j-k, Relative gene expression of Wnt/β-catenin target genes measure by RT-qPCR, in PC3 (j) or MCF7 (k) cells following RNAi of FTO. Mean + SD from 3 independent experiments, normalized to ACTB and SDHA. P-values calculated by two-tailed t-test, as indicated.
Figure 6.
Figure 6.. Wnt signaling is regulated by FTO-dependent m6A demethylation.
a, Representative western blot (n=3) showing levels of the proteins encoded by two FTO mRNA targets identified within the Wnt/β-catenin signaling pathway (CSNK1D and WNT5A), in RNAi FTO and RNAi Ctrl SKBR3 cells. HDAC1 and β-actin as loading controls. b, Volcano plot showing the ROAR score versus the p value upon depletion of FTO in SKBR3 cells. Transcripts with differences in 3’ UTR length (p < 0.05; paired Fisher test) upon knockdown of FTO are shown in red (shorter 3’UTR) and green (longer 3’UTR). c, Gene track view of RNA-seq at SOX11, CSNK1D and WNT5A transcripts displaying significant differences in 3’ UTR length upon knockdown of FTO. Alternative polyadenylation sites (Poly A) are indicated by vertical yellow lines. Green horizontal lines represent median expression before and after Poly A site. d, Gene expression regulation (log2 fold-change RNAi FTO/RNAi Ctrl) in SKBR3 cells for FTO targets related to Wnt/β-catenin, p53 and TGFβ (identified in Fig. 4a) measured by RNA-seq in five independent replicates. Transcripts with significant differences in expression (p < 0.05 by two-tailed t-test) are shown in black. Data as log2 fold-change ± lfcSE (standard error of the log2 fold-change). e, Changes in mRNA stability of the FTO targets WNT5A, CSNK1G2 and CSNK1D measured by RT-qPCR following transcription inhibition with actinomycin D in SKBR3 cells upon FTO knockdown (n = 3, data relative to t = 0h, mean ± SEM).
Figure 7.
Figure 7.. In vitro WNT inhibition restores EMT regulation in FTO-depleted cells.
a, Effect of Wnt/β-catenin inhibition by iCRT3 pre-treatment on mammosphere-forming capacity of RNAi Ctrl and RNAi FTO SKBR3 cells. Data from n=3 technical replicates (mean + SD) within a single experiment, representative of 3 biologically independent experiments provided as Source Data. P-values calculated by two-tailed paired t-test (pRNAi Ctrl=0.14; pRNAi FTO=0.0043). b, Effect of iCRT3 vs. vehicle (DMSO) on the invasion capacity of RNAi Ctrl and RNAi FTO PC3 cells. Data from n=3 technical replicates (mean + SD) within a single experiment, representative of 3 biologically independent experiments. Independent repeats have been deposited on the Figshare repository (DOI: 10.6084/m9.figshare.14602953). c, Cell viability following iCRT3 treatment in RNAi Ctrl and RNAi FTO SKBR3 cells, measured by MTT assay. Data as mean + SD, n=5. P-values calculated by two-tailed paired t-test (pRNAi Ctrl=0.01; pRNAi FTO=0.0007). d, Levels of the mesenchymal EMT marker proteins FN1 and SLUG in RNAi Ctrl and RNAi FTO PC3 cells in the absence and presence of iCRT3 (representative of 3 independent replicates) with β-actin as loading control.
Figure 8.
Figure 8.. FTO-low tumors are sensitive to WNT inhibitor therapy.
a, Schematic representation of breast cancer xenograft mouse model treated with iCRT3 or DMSO. b, Knockdown of FTO sensitizes breast tumors to Wnt inhibition. Nude mice growing tumors were treated as indicated in panel (a) (n=5 tumors per group, mean ± SEM, pictures of representative tumors are shown for each experimental group, two-way ANOVA, p(RNAi Ctrl) = 0.0116, p(RNAi FTO) < 0.0001). c, Tumor metabolism imaging with 18F-FDG PET/CT, applied to mice bearing RNAi Ctrl or RNAi FTO and treated with or without iCRT3. Representative images are shown for each group (pathological uptake by tumors encircled; physiological uptake in brain (B), kidneys (K), brown fat (F), and muscle (M)). Dotted line represents lower point of imaging scale (detection limit). No tumor is encircled in mouse with iCRT3-treated RNAi FTO tumor, as metabolic activity was below detection limit. Metabolic activity in tumors (middle) and lymph nodes (right) is quantified on the basis of 18F-FDG uptake into SUVmax. The box defines the IQR split by the median, with whiskers extending to the most extreme values within 1.5×IQR beyond the box. The number of samples (n) is indicated for each group. P-values calculated by two-tailed t-test, as indicated. d, Nude mice growing tumors from RNAi Ctrl (left) or RNAi FTO (right) PC3 cells were treated with or without iCRT3 (treatment as indicated in panel (a) for SKBR3 tumors, n=5 tumors per group, mean ± SEM, pictures of representative tumors are shown for each experimental group, two-way ANOVA, p(RNAi Ctrl) > 0.05, p(RNAi FTO) < 0.0001).

Comment in

References

    1. Harcourt EM, Kietrys AM & Kool ET Chemical and structural effects of base modifications in messenger RNA. Nature 541, 339–346 (2017). - PMC - PubMed
    1. Boccaletto P. et al. MODOMICS: A database of RNA modification pathways. 2017 update. Nucleic Acids Res. (2018) doi:10.1093/nar/gkx1030. - DOI - PMC - PubMed
    1. Dominissini D. et al. Topology of the human and mouse m6A RNA methylomes revealed by m6A-seq. Nature 485, 201–206 (2012). - PubMed
    1. Meyer KD et al. Comprehensive analysis of mRNA methylation reveals enrichment in 3′ UTRs and near stop codons. Cell 149, 1635–1646 (2012). - PMC - PubMed
    1. Shi H, Wei J. & He C. Where, When, and How: Context-Dependent Functions of RNA Methylation Writers, Readers, and Erasers. Molecular Cell (2019) doi:10.1016/j.molcel.2019.04.025. - DOI - PMC - PubMed

Publication types