. 2022 Jan;3(1):43-59.
doi: 10.1038/s43018-021-00279-5. Epub 2021 Nov 29.

Small-molecule inhibitors that disrupt the MTDH-SND1 complex suppress breast cancer progression and metastasis

Affiliations

Small-molecule inhibitors that disrupt the MTDH-SND1 complex suppress breast cancer progression and metastasis

Minhong Shen et al. Nat Cancer. 2022 Jan.

Abstract

Metastatic breast cancer is a leading health burden worldwide. Previous studies have shown that metadherin (MTDH) promotes breast cancer initiation, metastasis and therapy resistance; however, the therapeutic potential of targeting MTDH remains largely unexplored. Here, we used genetically modified mice and demonstrate that genetic ablation of Mtdh inhibits breast cancer development through disrupting the interaction with staphylococcal nuclease domain-containing 1 (SND1), which is required to sustain breast cancer progression in established tumors. We performed a small-molecule compound screening to identify a class of specific inhibitors that disrupts the protein-protein interaction (PPI) between MTDH and SND1 and show that our lead candidate compounds C26-A2 and C26-A6 suppressed tumor growth and metastasis and enhanced chemotherapy sensitivity in preclinical models of triple-negative breast cancer (TNBC). Our results demonstrate a significant therapeutic potential in targeting the MTDH-SND1 complex and identify a new class of therapeutic agents for metastatic breast cancer.


Conflict of interest statement

Competing interests

Princeton has filed a disclosure on the findings based on this study. Y.K., M.S. and H.K. are named as co-inventors on the disclosure. J.F.J. is a co-founder and Y.K. is a co-founder and chair of scientific advisory board of Firebrand Therapeutics Inc., which has licensed relevant technologies from Princeton University to develop MTDH-SND1 targeting therapeutics. Y.K. is also a co-founder of Kayothera, Inc. and a member of Scientific Advisory Board for Cytocare, Inc and Vibrant Pharma Limited. M.R. is an employee of Crelux GmgH. S.R. is the owner of SWR Pharma Consulting LLC. The remaining authors declare no competing interests.

Figures
Extended Data Fig. 1
Extended Data Fig. 1. Mtdh acute knockout inhibits breast cancer progression and metastasis.
a, Treatment response of each individual mouse in Fig. 1e. b, More representative lungs for Fig. 1g. Size bars, 5 mm. c,i, Tumor burdens of FVB.C3;UBC-CreERT+/−;Mtdhfl/fl (c) or FVB.WNT;UBC-CreERT+/−;Mtdhfl/fl (i) mice before treatment. d,e and j, k, Tumor burdens were showed as in groups or individuals in C3 (d,e) or WNT (j,k) tumor models after treatment. f,l, Tumor burden-based survival was plotted. 500 mm3 was used as cutoff based on the moribund criteria set in our IACUC protocol. p value by Log-rank test. C3 model: Vehicle, n=9; Tmx, n=9 (c-f). WNT model: Vehicle, n=9; Tmx, n=12 (i-l). g,m MTDH expression in tumors from C3 mice (g) or WNT mice (m) that were treated with vehicle or Tmx was evaluated with western blot. h,n, Lungs from C3 mice (h) or WNT mice (n) were fixed. H&E staining was performed and metastatic incidence (h) or nodules were quantified (n). The metastatic nodules of the representative lungs were highlighted with red and blue respectively (n). C3: Vehicle, n=9 lungs; Tmx, n=9 lung; WNT: Vehicle, n=9 lungs; Tmx, n=12 lung. Size bar, 5 mm (h,n). Data represent mean ± SEM. Significance determined by two tailed Student’s t-test (c,h,I,n), two-sided Log-rank test (f,l), Two-Way Repeated Measures ANOVA test (d,j). Numerical source data for a, c-f, h-l, n, and uncropped blots for g and m are provided.
Extended Data Fig. 2
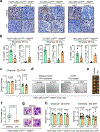
Extended Data Fig. 2. Tamoxifen by itself does not affect tumorsphere formation.
a,b, Primary tumors from PyMT, C3, or WNT mice with vehicle or Tmx treatment were stained with Ki67 or cleaved caspase 3 (Casp-3) (a). Images were acquired at non-necrotic/apoptotic areas that were close to tumor border. Positive cells were quantified (b). Size bar, 50 μm (a). Data represent mean ± SEM. Significance determined by two tailed Student’s t-test. c, PyMT;UBC-CreERT+/−;Mtdhfl/fl cells that were pretreated with 0.02 μg/ml of 4-OHT for 5 days were recovered for another 2 weeks. 25k cells were then seed in each well of the 24-well low attachment plate. One day after seeding, cells were treated with vehicle or 0.02 μg/ml of 4-OHT. 10 days after treatment, sphere number and size were measured and normalized to vehicle control group. Data represent mean ± SEM. n=3 independent experiments. Significance determined by two tailed Student’s t-test. d, Representative images for tumorspheres in Fig. 2b and Extended Data Fig.2c are shown. Size bar, 200 μm. e,f, Tumors from Fig. 2d were dissected (e) and tumor mass was measured (f). Size bar, 2 cm. Data represent mean ± SEM. Significance determined by two tailed Student’s t-test. g, H&E-stained sections of Fig. 2e are complemented by high-magnification images. Size bar, 5 mm. h, Cell lines in Fig. 2f were pretreated with 0.02 μg/ml of 4-OHT for 5 days and then recovered for another 2 weeks. The cells were employed for tumorsphere assay with 25k cells per well. Similar treatment as in (c) was performed and number and size of the spheres in 4-OHT treatment groups were measured and normalized to vehicle controls of the same cell line. Data represent mean ± SEM. n=3 independent experiments. Significance determined by two tailed Student’s t-test. Numerical source data for b, c, f, and h are provided.
Extended Data Fig. 3
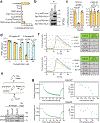
Extended Data Fig. 3. Screening of small chemical compounds that disrupt MTDH/SND1 interaction.
a, 293T cells that expressed wild type luciferase or indicated split-luciferase components were lysed and subjected to luciferase assay. Data represent mean ± SEM. n=3 independent experiments. b, 293T cells that were transfected with CLuc-MTDH-HA and Myc-SND1-NLuc plasmids were lysed for Co-IP assay 3 days later. c, 293T cells that express split or linked luciferase components were lysed for luciferase assay. 50 μM of wild type (WT) or SND1 interaction-deficient (MT) MTDH peptides were added into the luciferase assay system. Luciferase activity was measured and normalized to control sample. Data represent mean ± SEM. n=3 independent experiments. Significance determined by one-way ANOVA analysis with Dunnett’s test for multiple comparisons. d, 0.5 μM of CFP-MTDH and 2 μM of TC-SND1 that labeled with 2.4 μM of FIAsH-EDT2 labeling reagent was used to performed FRET assay in 50 μL system. Indicated concentration of wild type (WT) or mutant (MT) MTDH peptides were added and FRET efficiency was calculated. Data represent mean ± SEM. n=3 independent experiments. Significance determined by one-way ANOVA analysis with Sidak’s test for multiple comparisons. e, Schematic diagram of Co-IP based confirmation of MTDH-SND1 inhibitory compounds (left). SCP28 cells were lysed for IP assay.2 μg of MTDH antibody together with 500 μM of MTDH wild type (Pep-WT) or mutant (Pep-MT) peptides were added into each 1 ml of samples. Red star indicates wild type MTDH peptide competing off SND1 that binds to MTDH. f, 0.1 mg/ml of SND1 purified protein together with the indicated concentration of compounds were applied for thermal melt assay. Melting temperature changes were determined. AU: arbitrary units. g, 200 nM of SND1, 50 nM RED-tris-NTA dye and MTDH peptides (24.4 nM-50 μM) were used to perform Microsacle Thermophoresis (MST) assay. Numerical source data for a, c, d, f, g and uncropped blots for b and e are provided.
Extended Data Fig. 4
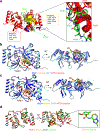
Extended Data Fig. 4. C26-A2 and A6 compete with MTDH to bind the SND1 pocket in the same manner.
a, Overall structures of MTDH-SND1 complex (top). A close-up view is shown at SND1 pocket 2 (bottom). SND1 is shown in red ribbon and cylinder (side chain). MTDH is shown in worm (backbone) and cylinder (side chain) and colored green. b,c, Overall structures of SND1-C26-A2 and SND1-MTDH complexes (b) or SND1-C26-A6 and SND1-MTDH complexes (c). Two perpendicular views are shown. In SND1-C26-A2 and SND1-C26-A6, SND1 is shown in dark blue ribbon, C26-A2 and A6 are shown in orange backbone and surface; In SND1-MTDH complex, SND1 is shown in light blue ribbon, and MTDH is shown in worm (backbone) and cylinder (side chain) and colored red. d, Overall structures of SND1-C26-A2 and SND1-C26-A6 complexes (left). Two perpendicular views are shown. A close-up view of C26-A2 and A6 is shown at SND1 pocket (Right). In SND1-C26-A2, SND1 is shown in red ribbon, C26-A2 is shown in orange backbone; In SND1-C26-A6, SND1 is shown in dark green ribbon, C26-A6 is shown in green backbone.
Extended Data Fig. 5
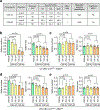
Extended Data Fig. 5. C26-A2 and A6 inhibits tumorsphere formation in vitro.
a, Caco-2 cells were employed to test cell permeability of C26-A2 and A6. 5 μM of compounds were dosed on both apical side (A-to-B) and basolateral side (B-to-A). Samples were taken from the donor and receiver chambers at 120 min after treatment. All samples were assayed by LC-MS/MS using electrospray ionization. The apparent permeability (Papp) and percent recovery were calculated. b-e, C3;UBC-CreERT+/−;Mtdhfl/fl (b,c) and Wnt;UBC-CreERT+/−;Mtdhfl/fl tumor cells (d,e) that with (c,e) or without (b,d) 5 days of 0.02 μg/ml 4-OHT pre-treatment were subjected to the tumorsphere assay. 50k per well of cells were seed and treated with indicated compounds the next day. 5 days after treatment, sphere number and size were assessed and normalized to vehicle control group. Data represent mean ± SEM. n=3 independent experiments. Significance determined by one-way ANOVA analysis with Dunnett’s test for multiple comparisons. Numerical source data for b-e are provided.
Extended Data Fig. 6
Extended Data Fig. 6. C26-A6 treatment blocks MTDH/SND1 interaction in vivo with limited toxicity.
a,b, NSG female mice were inoculated with 10k of SCP28 cells that express split-luciferase components by MFP injection. Two weeks after injection, the mice were treated with 0.25 mg/mouse or 0.5 mg/mouse of C26-A6 via tail-vein injection. 30 min after the treatment, luciferase activity at primary tumors was measured. Data represent mean ± SEM. n=3 mice. Significance determined by one-way ANOVA analysis with Dunnett’s test for multiple comparisons. c, H&E-stained sections of Fig. 6d are complemented by high-magnification images. Size bar, 5 mm. d, Body weight of the mice in experiment Fig. 6b was measured. Vehicle, n=10 mice; C26-A6, n=12 mice. e, Serum from mice in experiment in Fig. 6b were collected for ALT and AST activity measurement following the standard protocol (Sigma). Three FVB females treated with 200 μl of 8% CCl4 in corn oil for 2 days served as positive control. Data represent mean ± SEM. n=5 mice per group. Significance determined by one-way ANOVA analysis with Dunnett’s test for multiple comparisons. f, Blood samples were drawn from the heart of mice in experiment Fig. 6b, and blood cell counts were performed with the Sysemx XN-3000 Hematology System (Sysmex America, Inc.) Data represent mean ± SEM. Vehicle, n=6 mice; C26-A6, n=5 mice. Significance determined by two tailed Student’s t-test. g, Small intestine samples were obtained from mice in experiment Fig. 6b. H&E and Alcian blue staining was performed on processed, sliced samples. Scale bar: 200 μm. h, Quantification of Alcian blue staining results from (g). Data represent mean ± SEM. n=12 fields from 5 mice in each group. Significance determined by two tailed Student’s t-test. Numerical source data for b, d-f, and h are provided.
Extended Data Fig. 7
Extended Data Fig. 7. C26-A6 inhibits breast cancer progression and metastasis.
a-c, NGS female mice injected with 2k SCP28 cells orthotopically were subjected to vehicle or C26-A6 treatment after two weeks. Primary tumor volumes were measured(a). 8 weeks after treatment, tumor mass (b) and lung metastasis (c) were assessed. Vehicle, n= 10 mice; C26-A6, n=10 mice. Size bars, 2 cm for (b) and 5 mm for (c). d,e, Primary tumors from experiment in Fig. 6b were stained with Ki67 and Cleaved-Caspase 3 (Casp-3) antibodies (d). Positive cells were quantified (e). Size bar, 100 μm. Data represent mean ± SEM. n=6 mice. f, Fresh HCI-001 PDX tumors were implanted into the mammary glands of female NSG mice. One day after implantation, the mice were treated with vehicle or C26-A6. Primary tumors were monitored. g, Primary tumors from (f) were weighted. Representative tumors are shown. Size bar, 2 cm. n=12 tumors per group. h,i, Primary tumors from (f) were stained with Ki67 and cleaved-Caspase 3 (Casp-3) antibodies (h). Positive cells were quantified (i). Size bar, 200 μm. n=5 tumors per group. j, Heatmap representation of Next-generation sequencing data displaying the expression of genes in tumors that treated with vehicle (Ctrl), 60 mg/kg of Tmx for 5 consecutive days, or 15 mg/kg of C26-A6 5 days per week. Color key indicates log2 values. n=4 mice per group. k,l, Ingenuity pathway analysis shows the top five molecular and cellular functions of C26-A6 treatment-downregulated genes (n=620, fold change >2, p < 0.05) (k). Effects of C26-A6 treatment-downregulated genes in cell death and survival functions (l). p values were automatically determined by QIAGEN Ingenuity Pathway Analysis (QIAGEN IPA). Data represent mean ± SEM. Significance determined by Two-Way Repeated Measures ANOVA test (a,f) and two tailed Student’s t-test (b,c,e,g,i). Numerical source data for a-c, e, f, g, and i are provided.
Extended Data Fig. 8
Extended Data Fig. 8. C26-A6 induces cell cycle arrest and reduces cell viability.
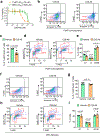
a, Spheres were treated with vehicle or indicated concentrations of C26-A6 for 1 week. The viability of the spheres was then quantified by MTT assay. b-i, Similar sphere assay as in (a) was performed. The apoptosis (b,f) and cell cycle status (d,h) were determined. The live cells (c,g) and percentage of the cells in each cell cycle phase (e,i) were quantified. n≥3 independent experiments. Data represent mean ± SEM and significance determined by two tailed Student’s t-test for all panels. Numerical source data for a, c, e, g, and i are provided.
Extended Data Fig. 9
Extended Data Fig. 9. Pathways that are altered upon C26-A6 treatment.
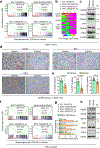
a, Gene set enrichment analysis plot showing the top 4 gene signatures in ranked list of genes. b, Leading edge analysis was performed with the 4 gene signature and the heatmap of top candidate genes was shown. Color key indicates log2 values. c, Sphere assay was performed and treated with vehicle and C26-A6 as in Extended Data Fig. 8a. The spheres were collected for western blot to analyze the expression of the candidates. d,e, Primary tumors from experiment in Extended Data Fig. 7a were stained with indicated antibodies (d). Positive cells were quantified (e). Size bars, 50 μm. n=5 tumors per group. Data represent mean ± SEM and significance determined by two tailed Student’s t-test (e). f-h, Mammary epithelial cell (MEC) spheres were treated with vehicle or C26-A6 for 1 week. The spheres were then harvested for RNA-sequencing and followed by gene set enrichment analysis(f). The normalized enrichment scores of the indicated signatures in C26-A6 treated MECs and tumors are shown (g). MEC spheres in (f) were collected for western blot analysis with indicated antibodies. Numerical source data for e and uncropped blots for c and h are provided.
Extended Data Fig. 10
Extended Data Fig. 10. C26-A6 inhibits metastatic breast cancer progression.
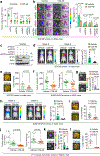
a, Indicated cells were injected into NSG females orthotopically and followed by vehicle or C26-A6 treatment after 2 weeks. Tumor volumes were measured 8 weeks after injection. Vehicle, n=6 mice; C26-A6, n=6 mice. b, Spontaneous lung metastasis of the mice in (a) were assessed by BLI (right). Size bar, 5 mm. Vehicle, n=5 lungs; C26-A6, n=6 lungs. c, The SND1 and MTDH expression of the cells used in (a) was evaluated. d,e,Tail-vein injection lung metastasis was determined by BLI right before (Week 0) or after (5 weeks) vehicle or C26-A6 treatment (f).. Lung metastatic nodules were quantified. The metastatic nodules of the representative lungs were highlighted with red and blue respectively. Size bar, 5 mm (e). Vehicle, n=11 lungs; C26-A6, n=12 lungs. f,g, SUM159-M1a cells were injected into NSG females orthotopically. 2 weeks after injection, the mice were treated with vehicle or C26-A6. 5 weeks later, primary tumors (f) and spontaneous lung metastasis (g) were measured. n=10 mice per group. h,i, Tail-vein injection lung metastasis was determined by BLI right before (Week 0) or after (5 weeks) vehicle or C26-A6 treatment (h).The metastatic nodules of the representative lungs were highlighted with red and blue respectively (i). n=12 mice per group. Size bar, 5 mm. j,k, 4T1 cells were injected into Balb/C females orthotopically. 1 week after injection, the mice were treated with vehicle or C26-A6. 5 weeks after the treatment, primary tumors (j) and spontaneous lung metastasis (k) were measured. n=10 mice per group. l, 4T1 cells were injected into Balb/C females intravenously. 5 weeks after vehicle or C26-A6 treatment, lung metastatic nodules were counted. The metastatic nodules of the representative lungs were highlighted with red and blue respectively. Vehicle, n=5 mice; C26-A6, n=6 mice. Size bar, 5 mm. Data represent mean ± SEM andsignificance determined by two tailed Student’s t-test for all panels. Numerical source data for a, b, d-l and uncropped blots for c are provided.
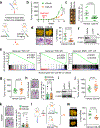
Fig. 1
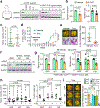
Fig. 1. Induced Mtdh knockout suppresses breast cancer progression and metastasis.
a, Schematic diagram of Mtdhfloxed/floxed (Mtdhfl/fl) mice (Top). Genotyping result of Mtdh wild type (Mtdh+/+, 371bp), conditional Mtdh knockout heterozygous (Mtdhfl/+, 371bp and 522bp), and conditional Mtdh knockout homozygous (Mtdhfl/fl, 522bp) (bottom left). Western blotting of MTDH in splenocytes from indicated strains cultured with multiplicity of infection (MOI, 100) adenovirus expressing Cre for 0, 3, or 5 days (bottom right). F, forward primer and R, reverse primer for genotyping. b, Schematic diagram of generation of Mtdh inducible knockout mice (Top). Cre expression is induced by Tamoxifen (Tmx) in FVB. UBC-CreERT+/− strain. c, FVB.UBC-CreERT+/−;Mtdhfl/fl strain was breed with FVB.MMTV-PyMT strain to generate breast cancer mouse model with Mtdh inducible knockout. Mice with matched tumor sizes were treated with Tmx or vehicle for 5 consecutive days via i.p. Tumors were measured weekly and lung metastasis was evaluated at endpoint. d, FVB.PyMT;UBC-CreERT+/−; Mtdhfl/fl mice with tumors established were split into two groups with matched tumor sizes for vehicle (n=18 mice) or Tmx (n=30 mice) treatment respectively. Tumor burden before treatment was showed. Data represent mean ± SEM. Significance determined by two tailed Student’s t-test. e, Tumor progression curves are shown after treatment starts. Each primary tumor is measured, and sizes were added as tumor burden in each mouse after treatment. Vehicle, n=18; Tmx, n=30. Data represent mean ± SEM. Significance determined by Two-Way Repeated Measures ANOVA test. f, Tumor burden-based survival was plotted. 500 mm3 was used as cutoff for moribund condition as defined in the IACUC protocol. p value by two-sided Log-rank test. Vehicle, n=18; Tmx, n=30. g, Lungs were collected, fixed and subjected to H&E staining (Left). Metastatic nodules were counted (right). The metastatic nodules of the representative lungs were highlighted with red and blue respectively (right). Vehicle, lung=18; Tmx, lung=30. Size bar, 5 mm. Data represent mean ± SEM. Significance determined by two tailed Student’s t-test. h, MTDH expression in tumors from the mice treated with vehicle or Tmx was evaluated with western blot. Numerical source data for d, e, f, g, and uncropped blots for h are provided.
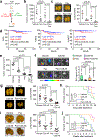
Fig. 2
Fig. 2. MTDH-SND1 interaction is essential for breast cancer progression and metastasis.
a, Primary tumors from FVB.PyMT;UBC-CreERT+/−;Mtdhfl/fl mice were cultured to generate cell line (left). The cell line that treated with 4-OHT were harvested for western blotting (right). 4-OHT, (Z)-4-Hydroxytamoxifen. b, Tumorsphere assay was performed with FVB.PyMT; UBC-CreERT+/−;Mtdhfl/fl cells. Sphere number and size were determined and normalized to vehicle group. Data represent mean ± SEM. n=3 independent experiments. Significance determined by two tailed Student’s t-test. c,d, 10k of FVB.PyMT; UBC-CreERT+/−;Mtdhfl/fl cells were orthotopically inoculated into FVB females. Two weeks after injection, mice were treated with or without Tmx. Tumors were measured before (c) and after treatment (d). Vehicle, n=12, Tmx, n=8. Data represent mean ± SEM. Significance determined by two tailed Student’s t-test (c) and Two-Way Repeated Measures ANOVA test (d). e, 11 weeks after injection, lungs were collected, and metastatic nodules were counted. The metastatic nodules of the representative lungs were highlighted with red and blue respectively. Size bar, 5 mm. Vehicle, lung=12; Tmx, lung=8. Data represent mean ± SEM. Significance determined by two tailed Student’s t-test. f, PyMT;UBC-CreERT+/−;Mtdhfl/fl cells with GFP (vector), wild type MTDH (MTDH-WT), or SND1 interaction deficient MTDH (MTDH-13D) expressing were treated with4-OHT followed by western blotting. g, Sphere number and size in 4-OHT treatment groups were determined and normalized to vehicle controls of the same cell line. Data represent mean ± SEM. n=3 independent experiments. Significance determined by one-way ANOVA analysis with Sidak’s test for multiple comparisons. h, 50k of the indicated cells were orthotopically injected into FVB female mice. One week after injection, the mice were treated with or without Tmx. 6 weeks later, tumor size and weight were measured. n=6 mice per group. Data represent mean ± SEM. Significance determined by two tailed Student’s t-test. i, Lungs were fixed, and the metastatic nodules were quantified. The metastatic nodules of the representative lungs were highlighted with red. n=6 lungs per group. Size bar, 5mm. Data represent mean ± SEM. Significance determined by two tailed Student’s t-test. (n.s. p>0.05, ****p<0.0001.) Numerical source data for b-e, g-i, and uncropped blots for a and f are provided.
Fig. 3
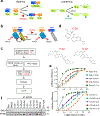
Fig. 3. Identification of small chemical inhibitors that block MTDH-SND1 interaction.
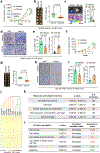
a,b, Schematic diagrams of the small molecule screening platforms. Split & Linked-luciferase (Split-luc, Linked-luc) assay (a) and FRET assay (b). c, Workflow of the screening. d, Structure of the three positive candidates. e, Split-luciferase assay was performed with multiple doses of indicated compounds or MTDH wild type peptide (Pep-WT). Data represent mean ± SEM. Luciferase inhibitory efficiency was calculated, and curves were fit. IC50s (μM) are shown following each compound/peptide. f, SCP28 cells grow confluent in each 10 cm dish were lysed with 1 ml of IP lysis buffer. 500 μM of the compounds were added into each 1 ml of the samples and IP with 2 μg of anti-MTDH antibody. Western blot was then performed to detect SND1 that binds to MTDH. Numerical source data for e, and uncropped blots for f are provided.
Fig. 4
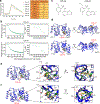
Fig. 4. C26s block MTDH binding pocket on SND1 to disrupt MTDH-SND1 complex.
a, 0.1 mg/ml of SND1 purified protein together with 250 μM of MTDH peptides or indicated compounds were applied for thermal melt assay. Melting temperature changes were determined. b, 150 nM of SND1, 50 nM RED-tris-NTA dye and compounds (2.82 nM-500 μM) were used to perform Microsacle Thermophoresis (MST) assay. c, Structure of compounds C26-A2 and A6. d, Overall structures of SND1-C26-A2 (top) and SND1-C26-A6 (bottom) complex. Two perpendicular views are shown. SND1 is shown in blue ribbon. C26-A2 and A6 are shown in backbone and surface. C26-A2 and A6 are indicated with red arrows. e,f, Close-up views of SND1-C26-A2 (e) and SND1-C26-A6 (f) complexes. Two perpendicular views are shown. SND1 is shown in ribbon (blue) and cylinder (indicated residues, green). C26-A2 and A6 are shown in backbone (yellow). Numerical source data for a and b are provided.
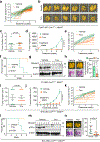
Fig. 5
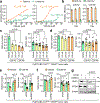
Fig. 5. C26-A2 and A6 suppress tumor formation in vitro.
a, SCP28 cells that stably express split- or linked-luciferase components were treated with multiple doses of C26-A2 or C26-A6. 30 min after treatment, culture media was removed and the luciferase activity in the cells was measured. Data represent mean ± SEM. n=3 independent experiments. b, The same cells in (a) that treated with 100 μM of the compounds for indicated days were harvested to measure the luciferase activity. Data represent mean ± SEM. n=3 independent experiments. c,d, PyMT;UBC-CreERT+/−;Mtdhfl/fl cells with (d) or without (c) 5 days of 0.02 μg/ml 4-OHT pre-treatment was employed for tumorsphere assay. 50k per well of cells were seed and treated with indicated compounds the next day. 5 days after treatment, sphere number and size were assessed and normalized to vehicle control group. Data represent mean ± SEM. n=3 independent experiments. Significance determined by one-way ANOVA analysis with Sidak’s test for multiple comparisons. e-g, PyMT;UBC-CreERT+/−;Mtdhfl/fl cells with or without SND1 knockdown, or with (f) or without (e) 5 days of 0.02 μg/ml 4-OHT pre-treatment were subjected to the tumorsphere assay and then treated with 200 μM of C26-A6 similar to (c). The expression of SND1 and MTDH was validated by western blot analysis (g). Data represent mean ± SEM. n=3 independent experiments. Significance determined by two tailed Student’s t-test. Numerical source data for a-f and uncropped blots for g are provided.
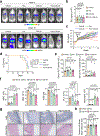
Fig. 6
Fig. 6. MTDH-SND1 complex disruption suppresses breast cancer progression and metastasis.
a, Schematic diagram of the treatments in FVB female mice. b,c, Tumor size (b) and mass was determined(c). Vehicle, n=10 mice, C26-A6, n=12 mice. Size bar, 2 cm. d, H&E staining was performed with lungs, and metastatic nodules were counted. The metastatic nodules of the representative lungs were highlighted with red and blue respectively. Vehicle, n=10 lungs; C26-A6, n=12 lungs. Size bar, 5 mm. e, Gene set enrichment analysis plot showing the enrichment of Tmx treatment-upregulated (left), -downregulated (middle), or SND1-upregulated (right) gene signatures. p and q values were determined by Kolmogorov-Smirnov statistic with GSEA v3.0. f-h, PyMT;UBC-CreERT+/−;Mtdhfl/fl tumor cells with 4-OHT pre-treated were assessed by western blot (f). 10k of the cells were inoculated into FVB female mice and treated with or without C26-A6after primary tumors reached to ~2 mm in diameter. 6 weeks after treatment, tumor size (g) and spontaneous lung metastasis (h) was determined. The lung metastatic areas of the representative lungs were highlighted with red (h). Vehicle, n=10 mice; C26-A6, n=10 mice. Size bar, 5 mm. i-k, PyMT tumor cells with endogenous SND1 stably knockdown was confirmed by western blot (i). 10k of the cells were injected into FVB females and treated similarly as in (g, h). Tumor size (j) and lung metastasis (k) was assessed. The lung metastatic areas of the representative lungs were highlighted with red (k). Vehicle, n=10 mice; C26-A6, n=10 mice. Size bar, 5 mm. l,m, 2k of PyMT tumor cells were injected into FVB femalesvia tail-vein. 3 days after injection, the mice were treated with vehicle or C26-A6 (l). 5 weeks later, lung metastatic nodules were counted (m). n = 6 mice per group. Data represent mean ± SEM. Significance determined by Two-Way Repeated Measures ANOVA test (b) and two tailed Student’s t-test (c,d,j,h,k,m). AU: arbitrary units. Numerical source data for b-d, g, h, j, k, m and uncropped blots for f and i are provided.
Fig. 7
Fig. 7. MTDH-SND1-targeting and chemotherapy synergistically suppress breast cancer progression and metastasis.
a-c, PyMT;UBC-CreERT+/−;Mtdhfl/fl mice treatment scheme (a). Primary tumors (b), and spontaneous lung metastatic nodules were quantified (c). The metastatic nodules of the representative lungs were highlighted with red (c). n = 5 mice per group. Size bar, 5 mm. d, Kaplan-Meier plots of overall survival (OS), relapse-free survival (RFS), and lung metastasis-free survival (LMFS) of TNBC patients. e, NSG female mice were injected with 10k of SCP28 cells. One week after injection the mice were treated with C26-A6 or Paclitaxel (Pac) alone or in combination for 5 weeks. Primary tumor size was measured. n = 6 mice per group. f, Lungs from (e) were harvested and BLI signal was measured to determine spontaneous lung metastasis. Data represent mean ± SEM. n=6 lungs. g, Balb/C females were injected with 1000 4T1 cells via tail-vein. 3 days after injection, the mice were performed similar treatment as in (e) for 5 weeks. Lungs were fixed, and the metastatic nodules were counted. The metastatic nodules of the representative lungs were highlighted with red. Vehicle, n=11 mice; n = 12 mice for other groups. Size bar, 5 mm. h, Survival rate of the mice in experiment (g) was plot. i,j, SCP28 primary tumors were removed in NSG female mice when they reached to ~5 mm in diameter. The mice were treated with C26-A6 and Pac alone or in combination. Lungs were collected to count metastatic nodules at endpoint (i). The metastatic nodules of the representative lungs were highlighted with red (i). Survival rate in each group was analyzed (j). n=12 mice per group. Size bar, 5 mm. Data represent mean ± SEM. Significance determined by one-way ANOVA analysis with Sidak’s test for multiple comparisons (b,c,e,f,g,i) and two-sided Log-rank test (d,h,j). Numerical source data for b-j are provided.
Fig. 8
Fig. 8. C26-A6 enhances chemotherapy response in metastatic breast cancer model without additional toxicity.
a-d, 2k 4TO7 cells were injected into Balb/C females. 2 weeks after the injections, the mice were randomized based on lung metastasis that indicated by BLI, and were divided into four groups followed by vehicle, paclitaxel (Pac), and C26-A6 treatment alone or in combination. For Pac, the mice were treated with 20 mg/kg of Pac twice per week for the first two week and then once per week after that, For C26-A6, the mice were treated with 15 mg/kg of C26-A6 5 days per week. Representative mice right before the treatment (week 2) and at week 10 are shown (a). The BLI signal was quantified at week 2 (b). The metastasis progression of each individuals is shown (c). Survival rate in each group was analyzed (d). n=6 mice per group. Data represent mean ± SEM. Significance determined by one-way ANOVA analysis with Dunnett’s test for multiple comparisons (b) or two-sided Log-rank test (d). e, Serum from mice in (a) were collected for ALT and AST activity measurement following the standard protocol (Sigma). Data represent mean ± SEM. AST, n=8 replicates from 6 mice; ALT, n=9 replicates from 6 mice. Significance determined by one-way ANOVA analysis with Sidak’s test for multiple comparisons. f, Blood samples were drawn from the heart of mice in (a), and blood cell counts were performed with the Sysemx XN-3000 Hematology System (Sysmex America, Inc.). Data represent mean ± SEM. n=6 mice per group. Significance determined by one-way ANOVA analysis with Sidak’s test for multiple comparisons. g, Small intestine samples were obtained from mice in (a). H&E and Alcian blue staining was performed on processed, sliced samples. Scale bar: 200 μm. h, Quantification of Alcian blue staining results from (g). Data represent mean ± SEM. n=12 fields from 6 mice in each group. Significance determined by one-way ANOVA analysis with Sidak’s test for multiple comparisons. Numerical source data for b-f and h are provided.

Comment in

References

    1. Nguyen DX, Bos PD & Massague J Metastasis: from dissemination to organ-specific colonization. Nature reviews 9, 274–284 (2009). - PubMed
    1. Hu G, Wei Y & Kang Y The multifaceted role of MTDH/AEG-1 in cancer progression. Clin Cancer Res 15, 5615–5620 (2009). - PMC - PubMed
    1. Wan L & Kang Y Pleiotropic roles of AEG-1/MTDH/LYRIC in breast cancer. Advances in cancer research 120, 113–134 (2013). - PubMed
    1. Wan L et al. MTDH-SND1 interaction is crucial for expansion and activity of tumor-initiating cells in diverse oncogene- and carcinogen-induced mammary tumors. Cancer cell 26, 92–105 (2014). - PMC - PubMed
    1. Wan L et al. Genetic ablation of metadherin inhibits autochthonous prostate cancer progression and metastasis. Cancer research 74, 5336–5347, doi:10.1158/0008-5472.CAN-14-1349 (2014). - DOI - PMC - PubMed

Publication types

LinkOut - more resources