. 2022 Jan;3(1):90-107.
doi: 10.1038/s43018-021-00291-9. Epub 2021 Dec 13.

A tumor-derived type III collagen-rich ECM niche regulates tumor cell dormancy

Affiliations

A tumor-derived type III collagen-rich ECM niche regulates tumor cell dormancy

Julie S Di Martino et al. Nat Cancer. 2022 Jan.

Abstract

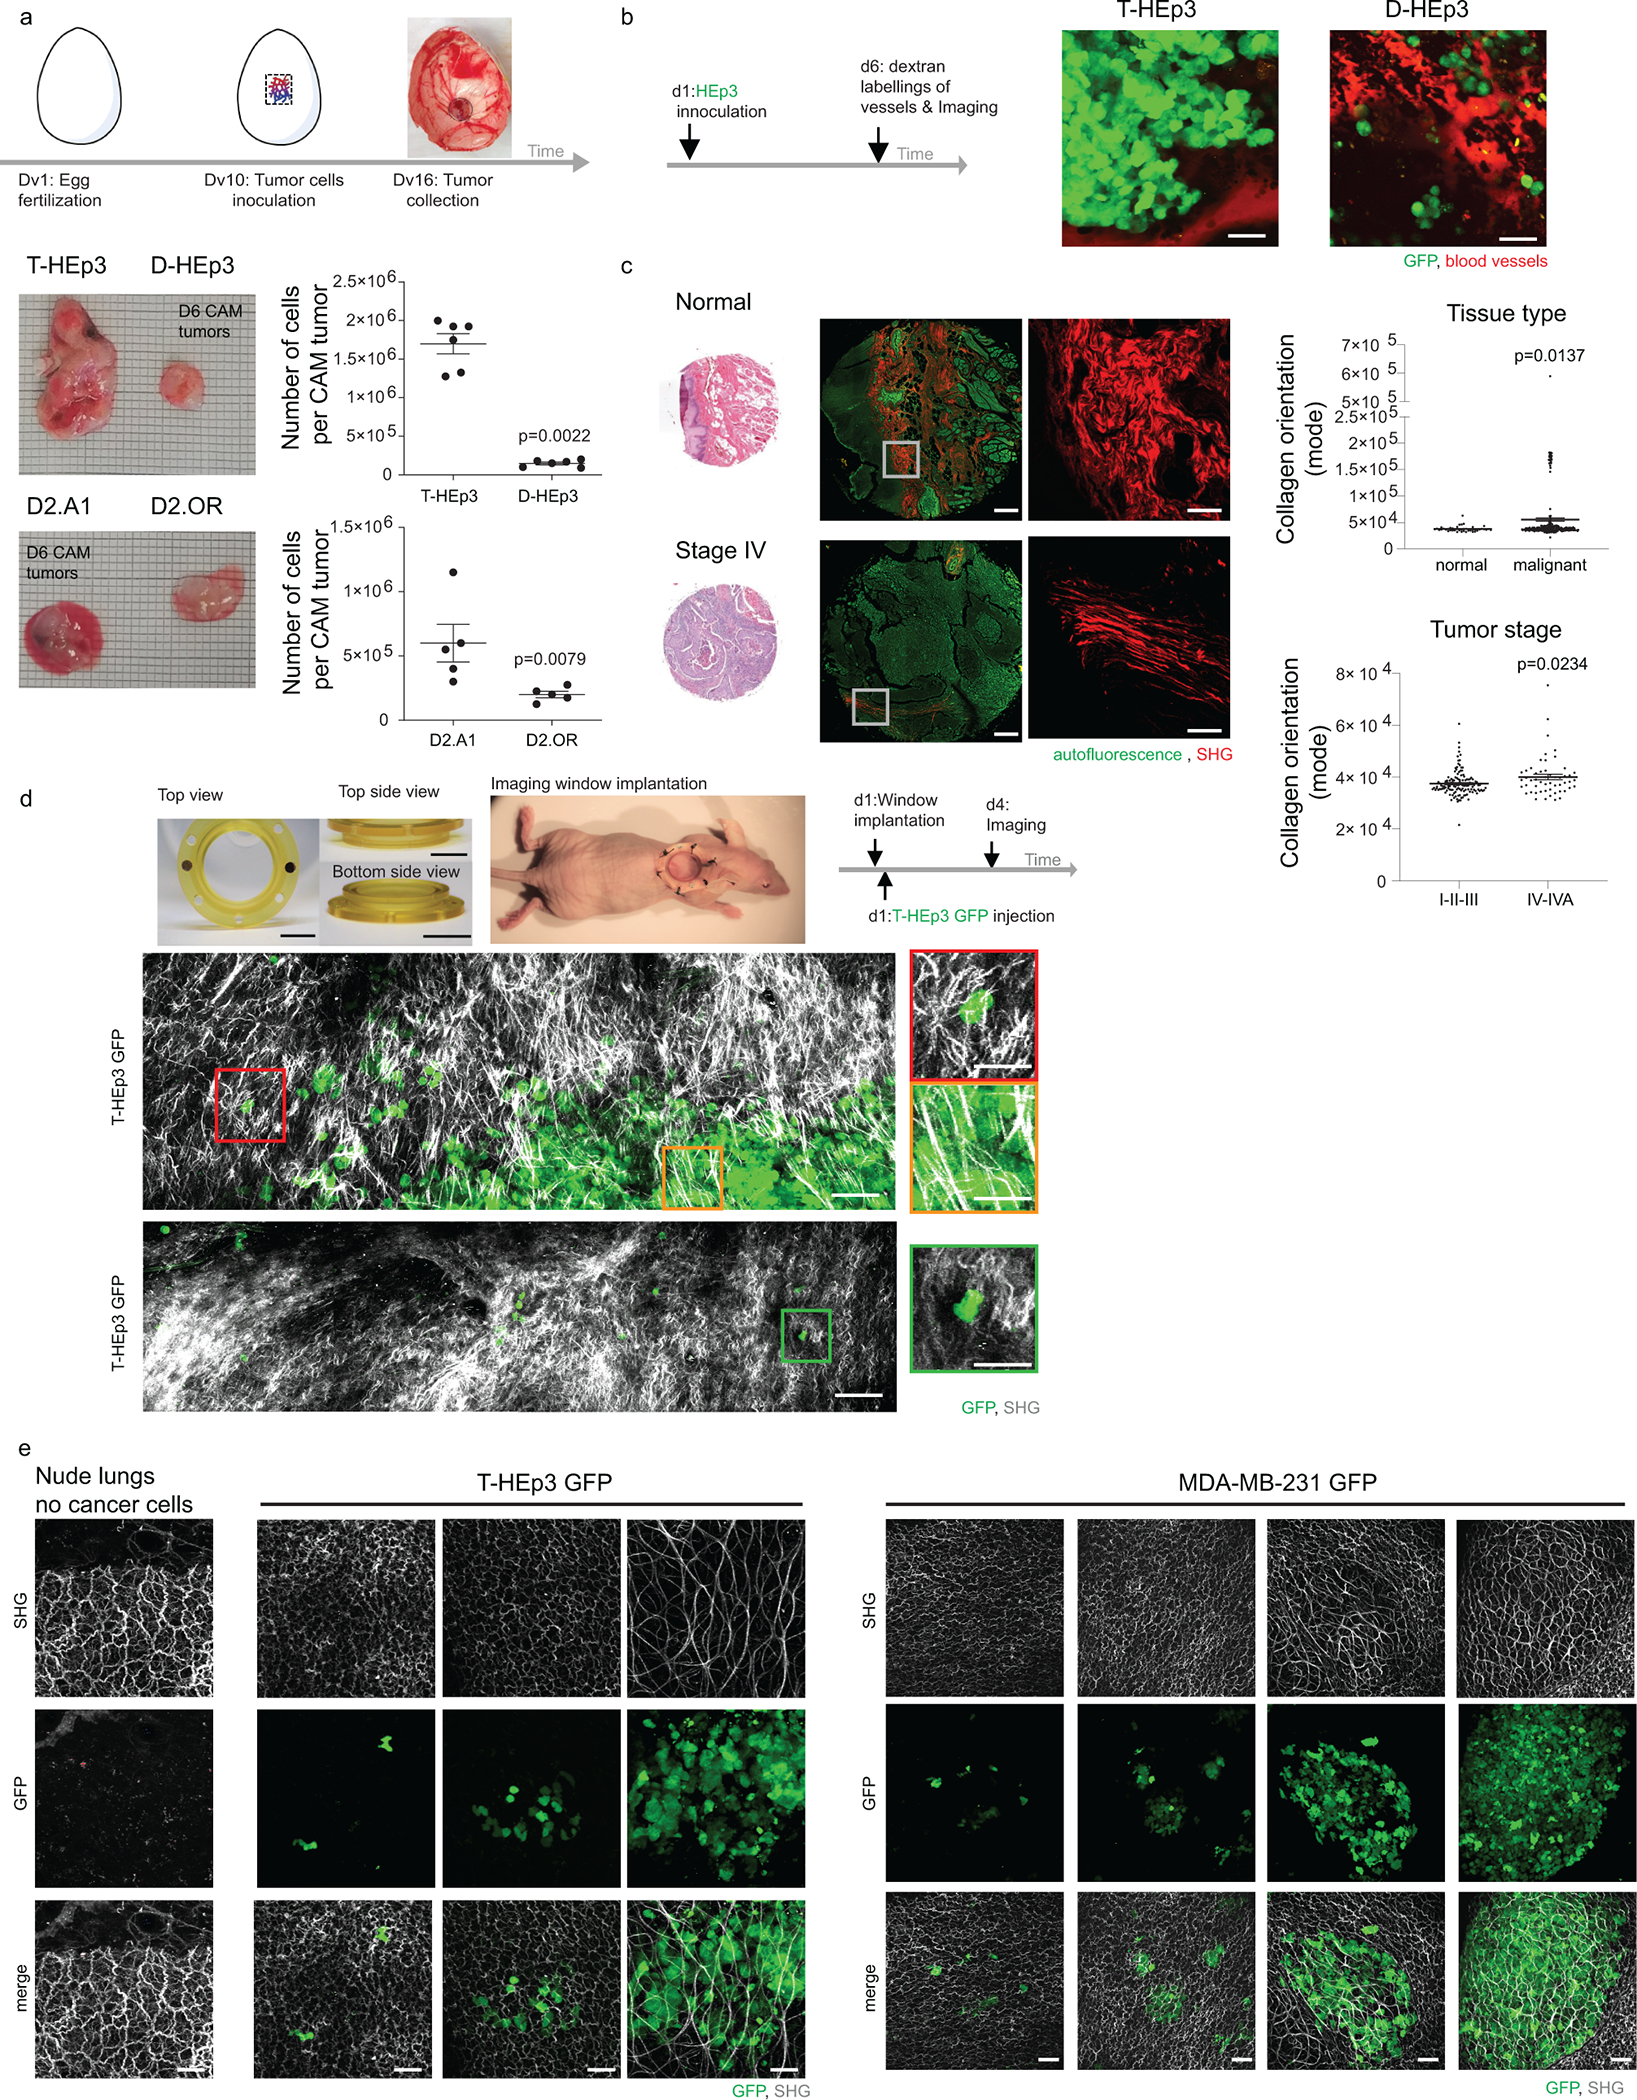
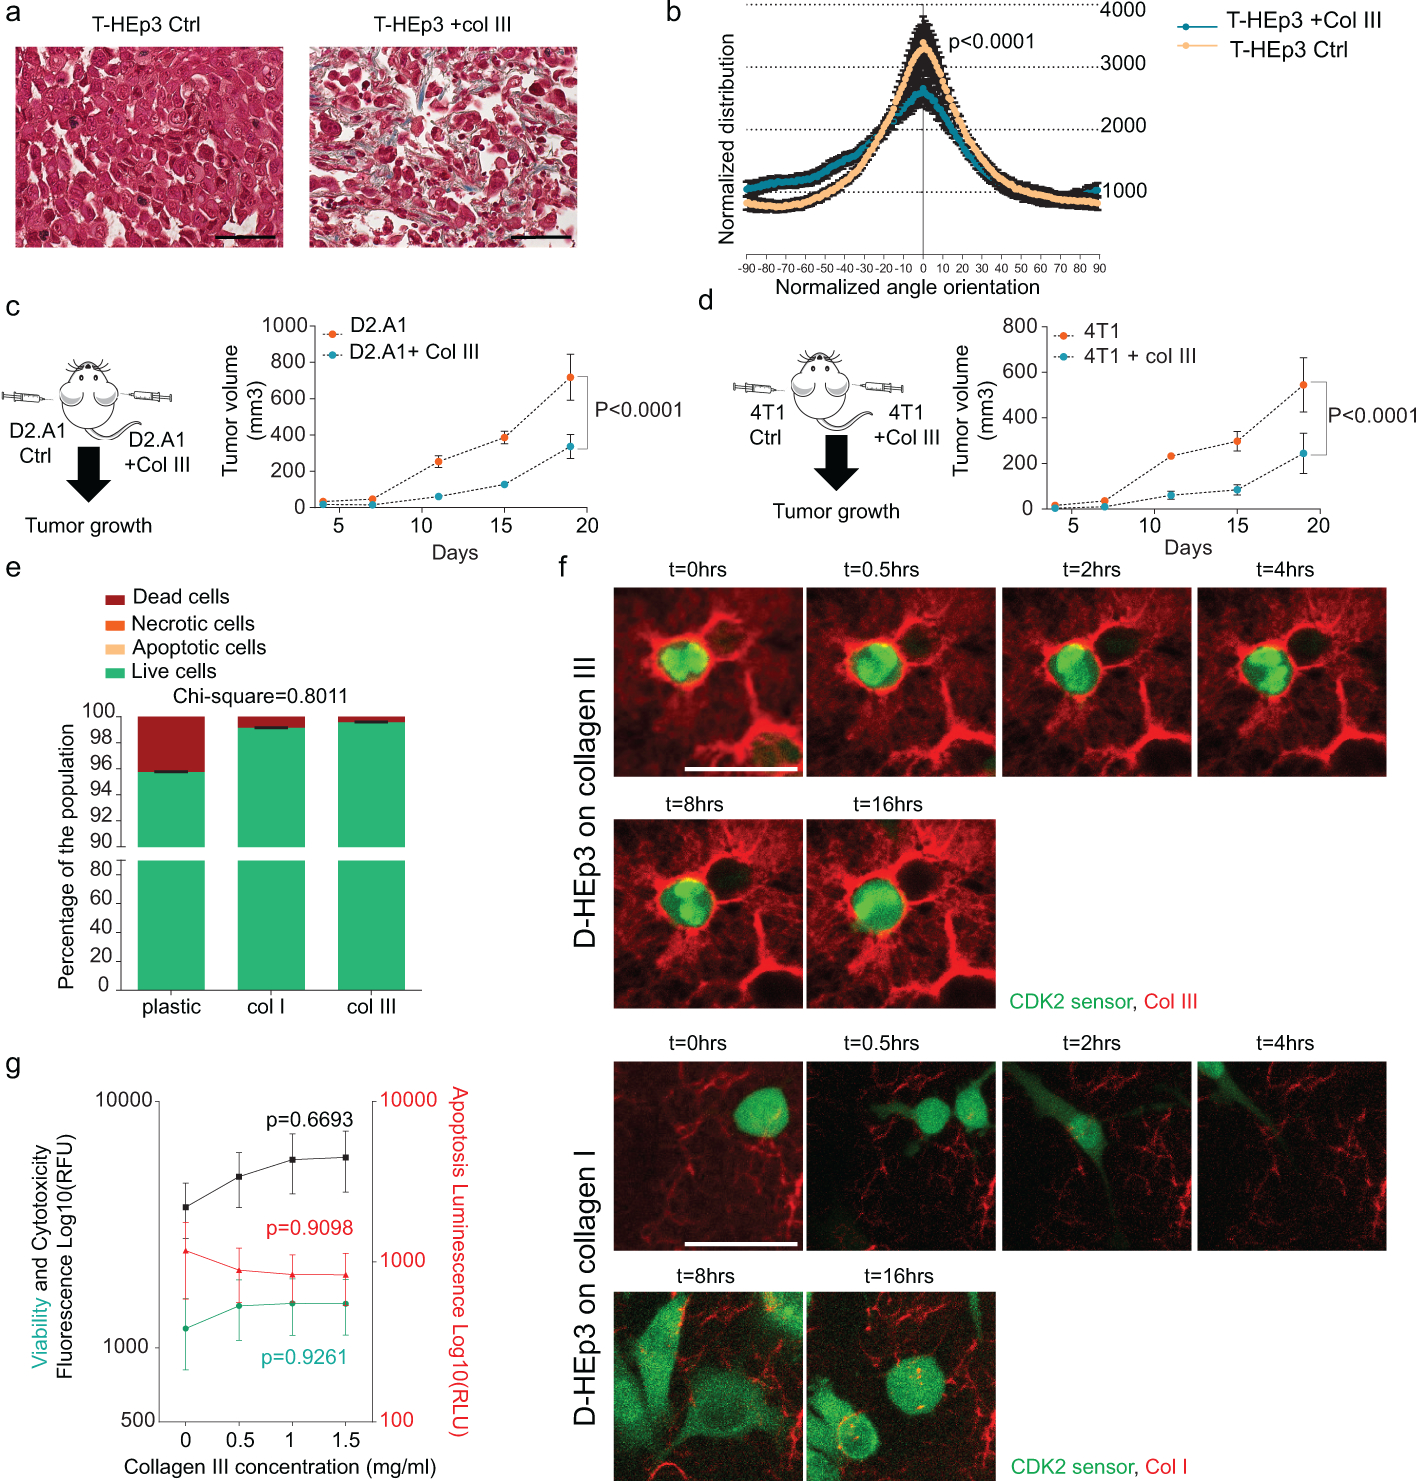
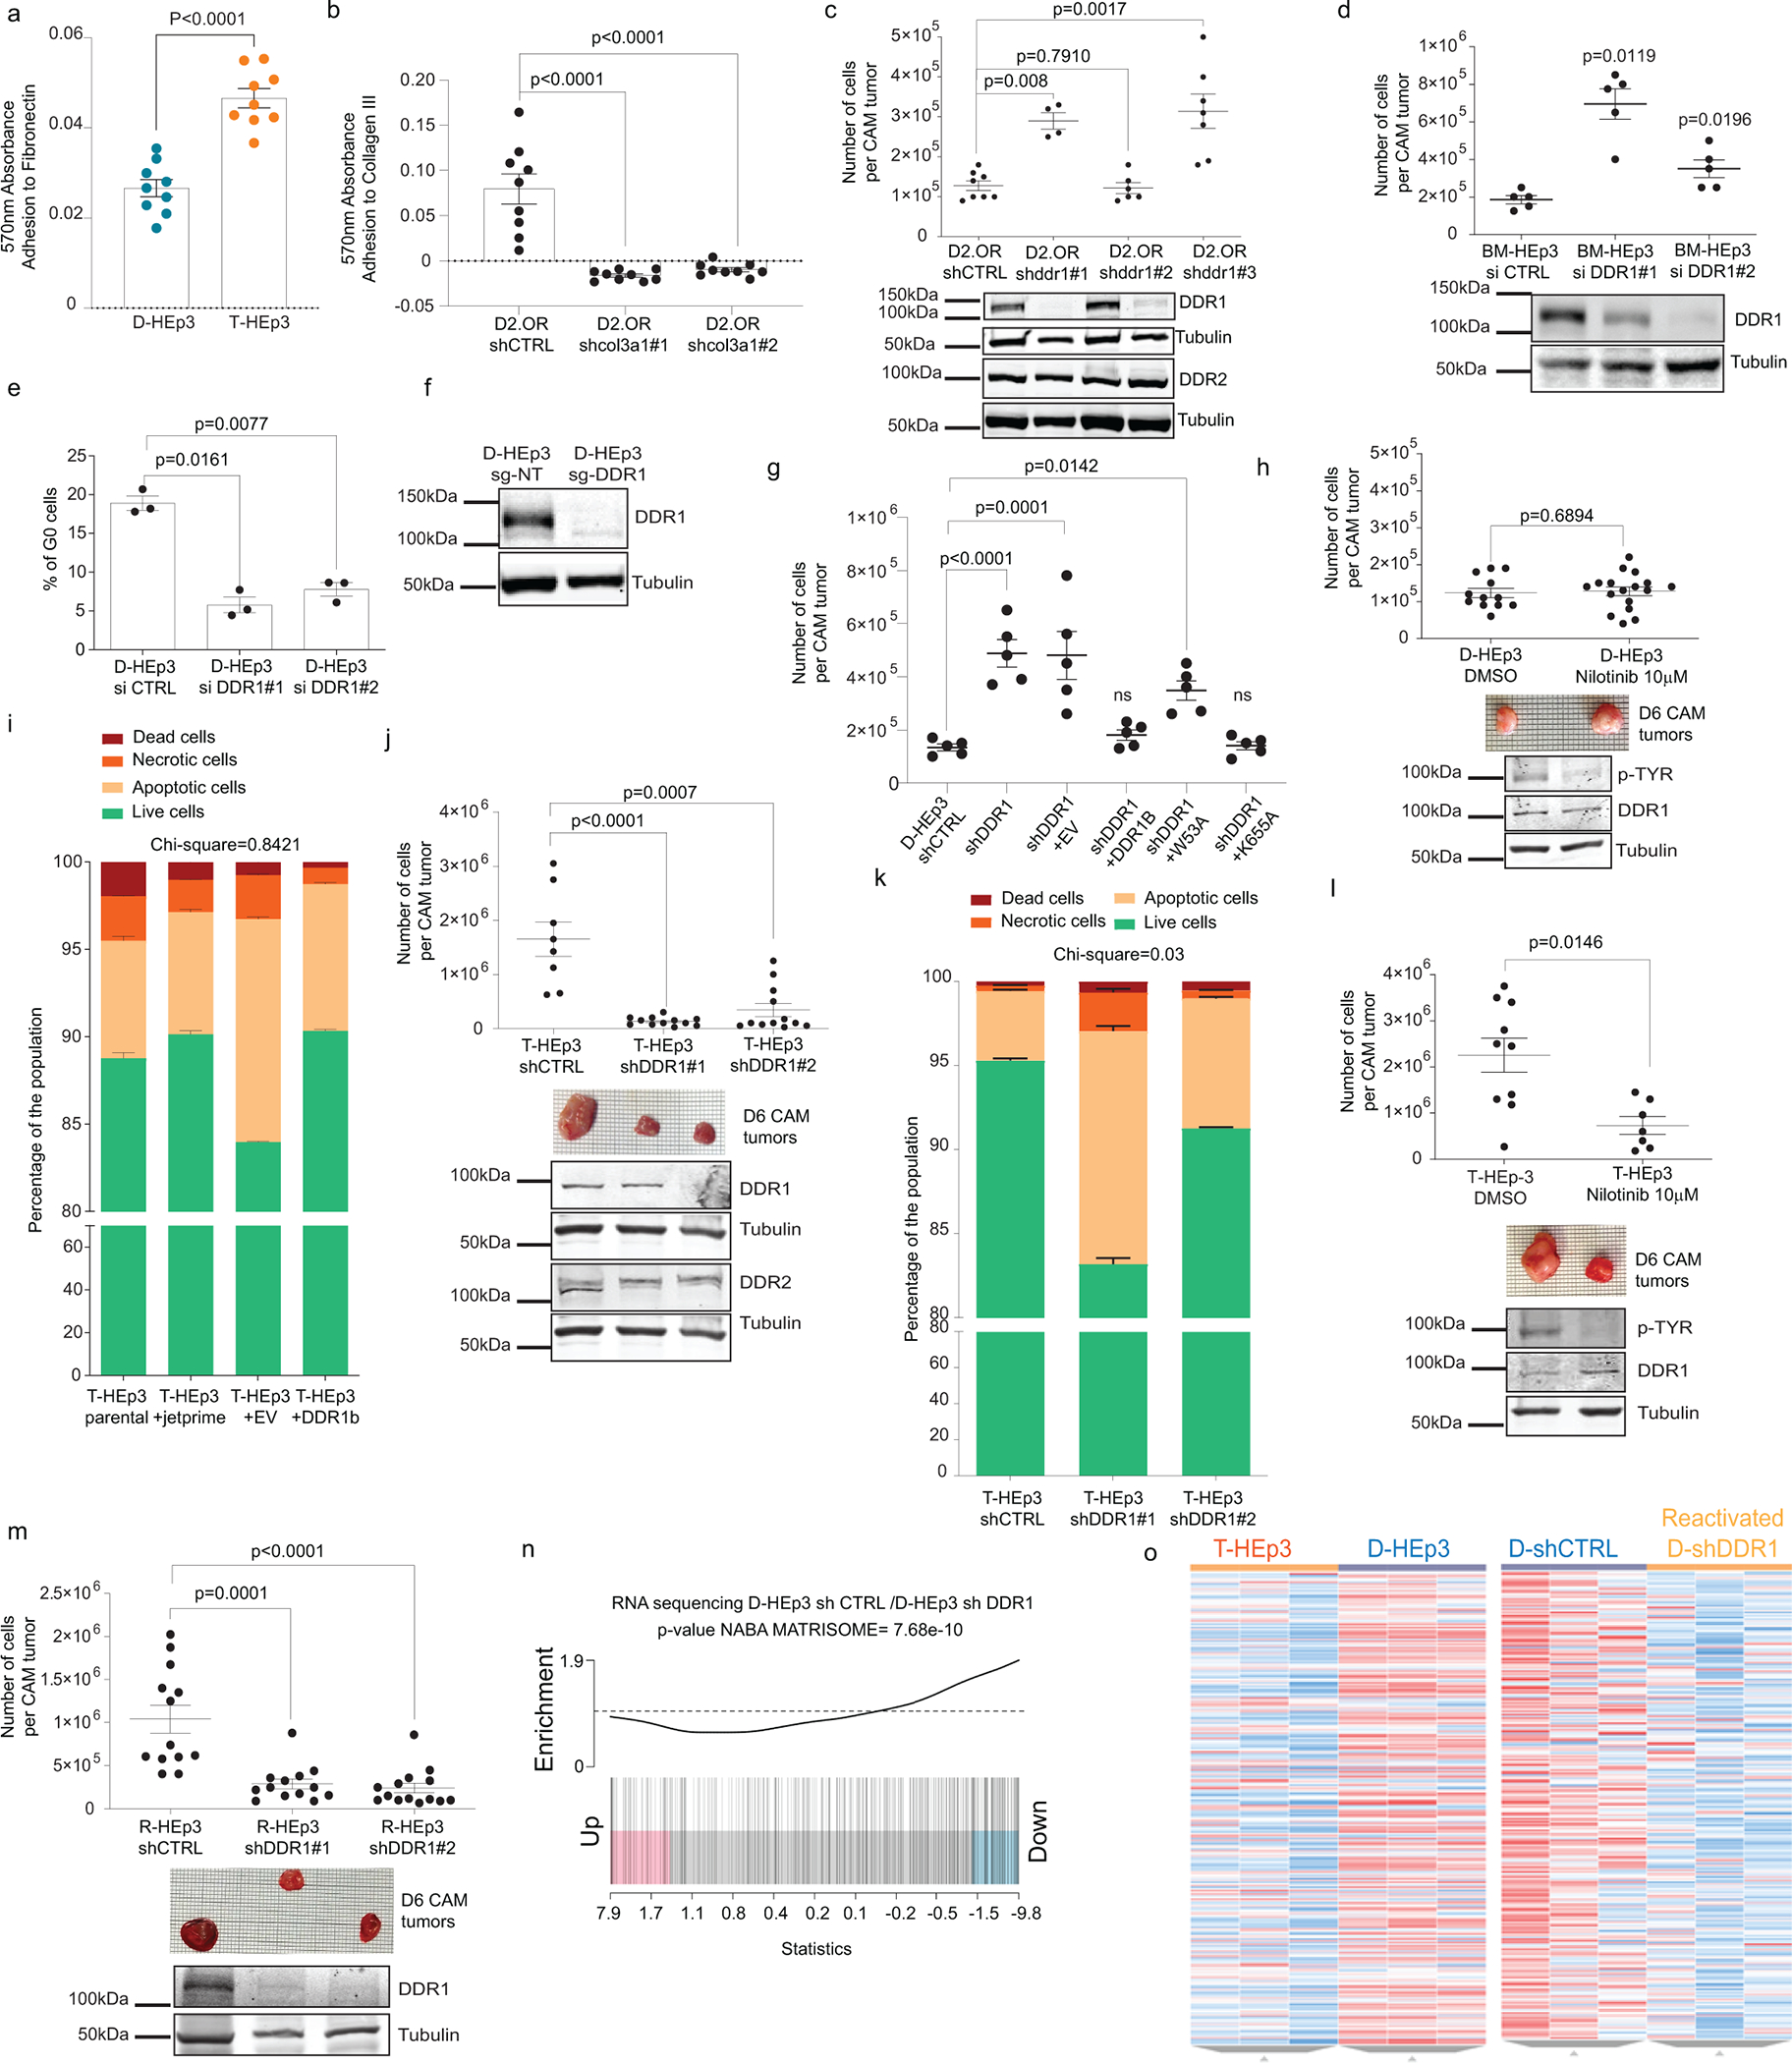
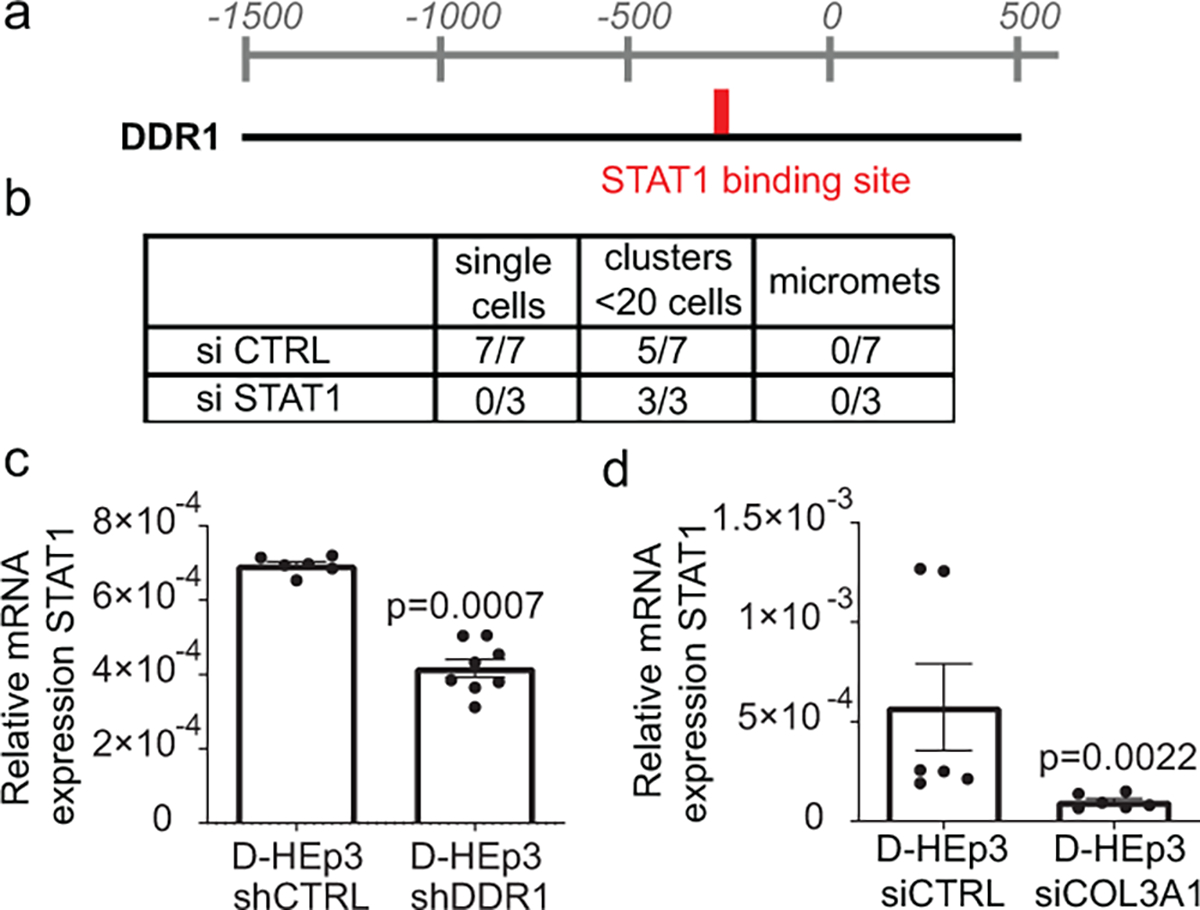
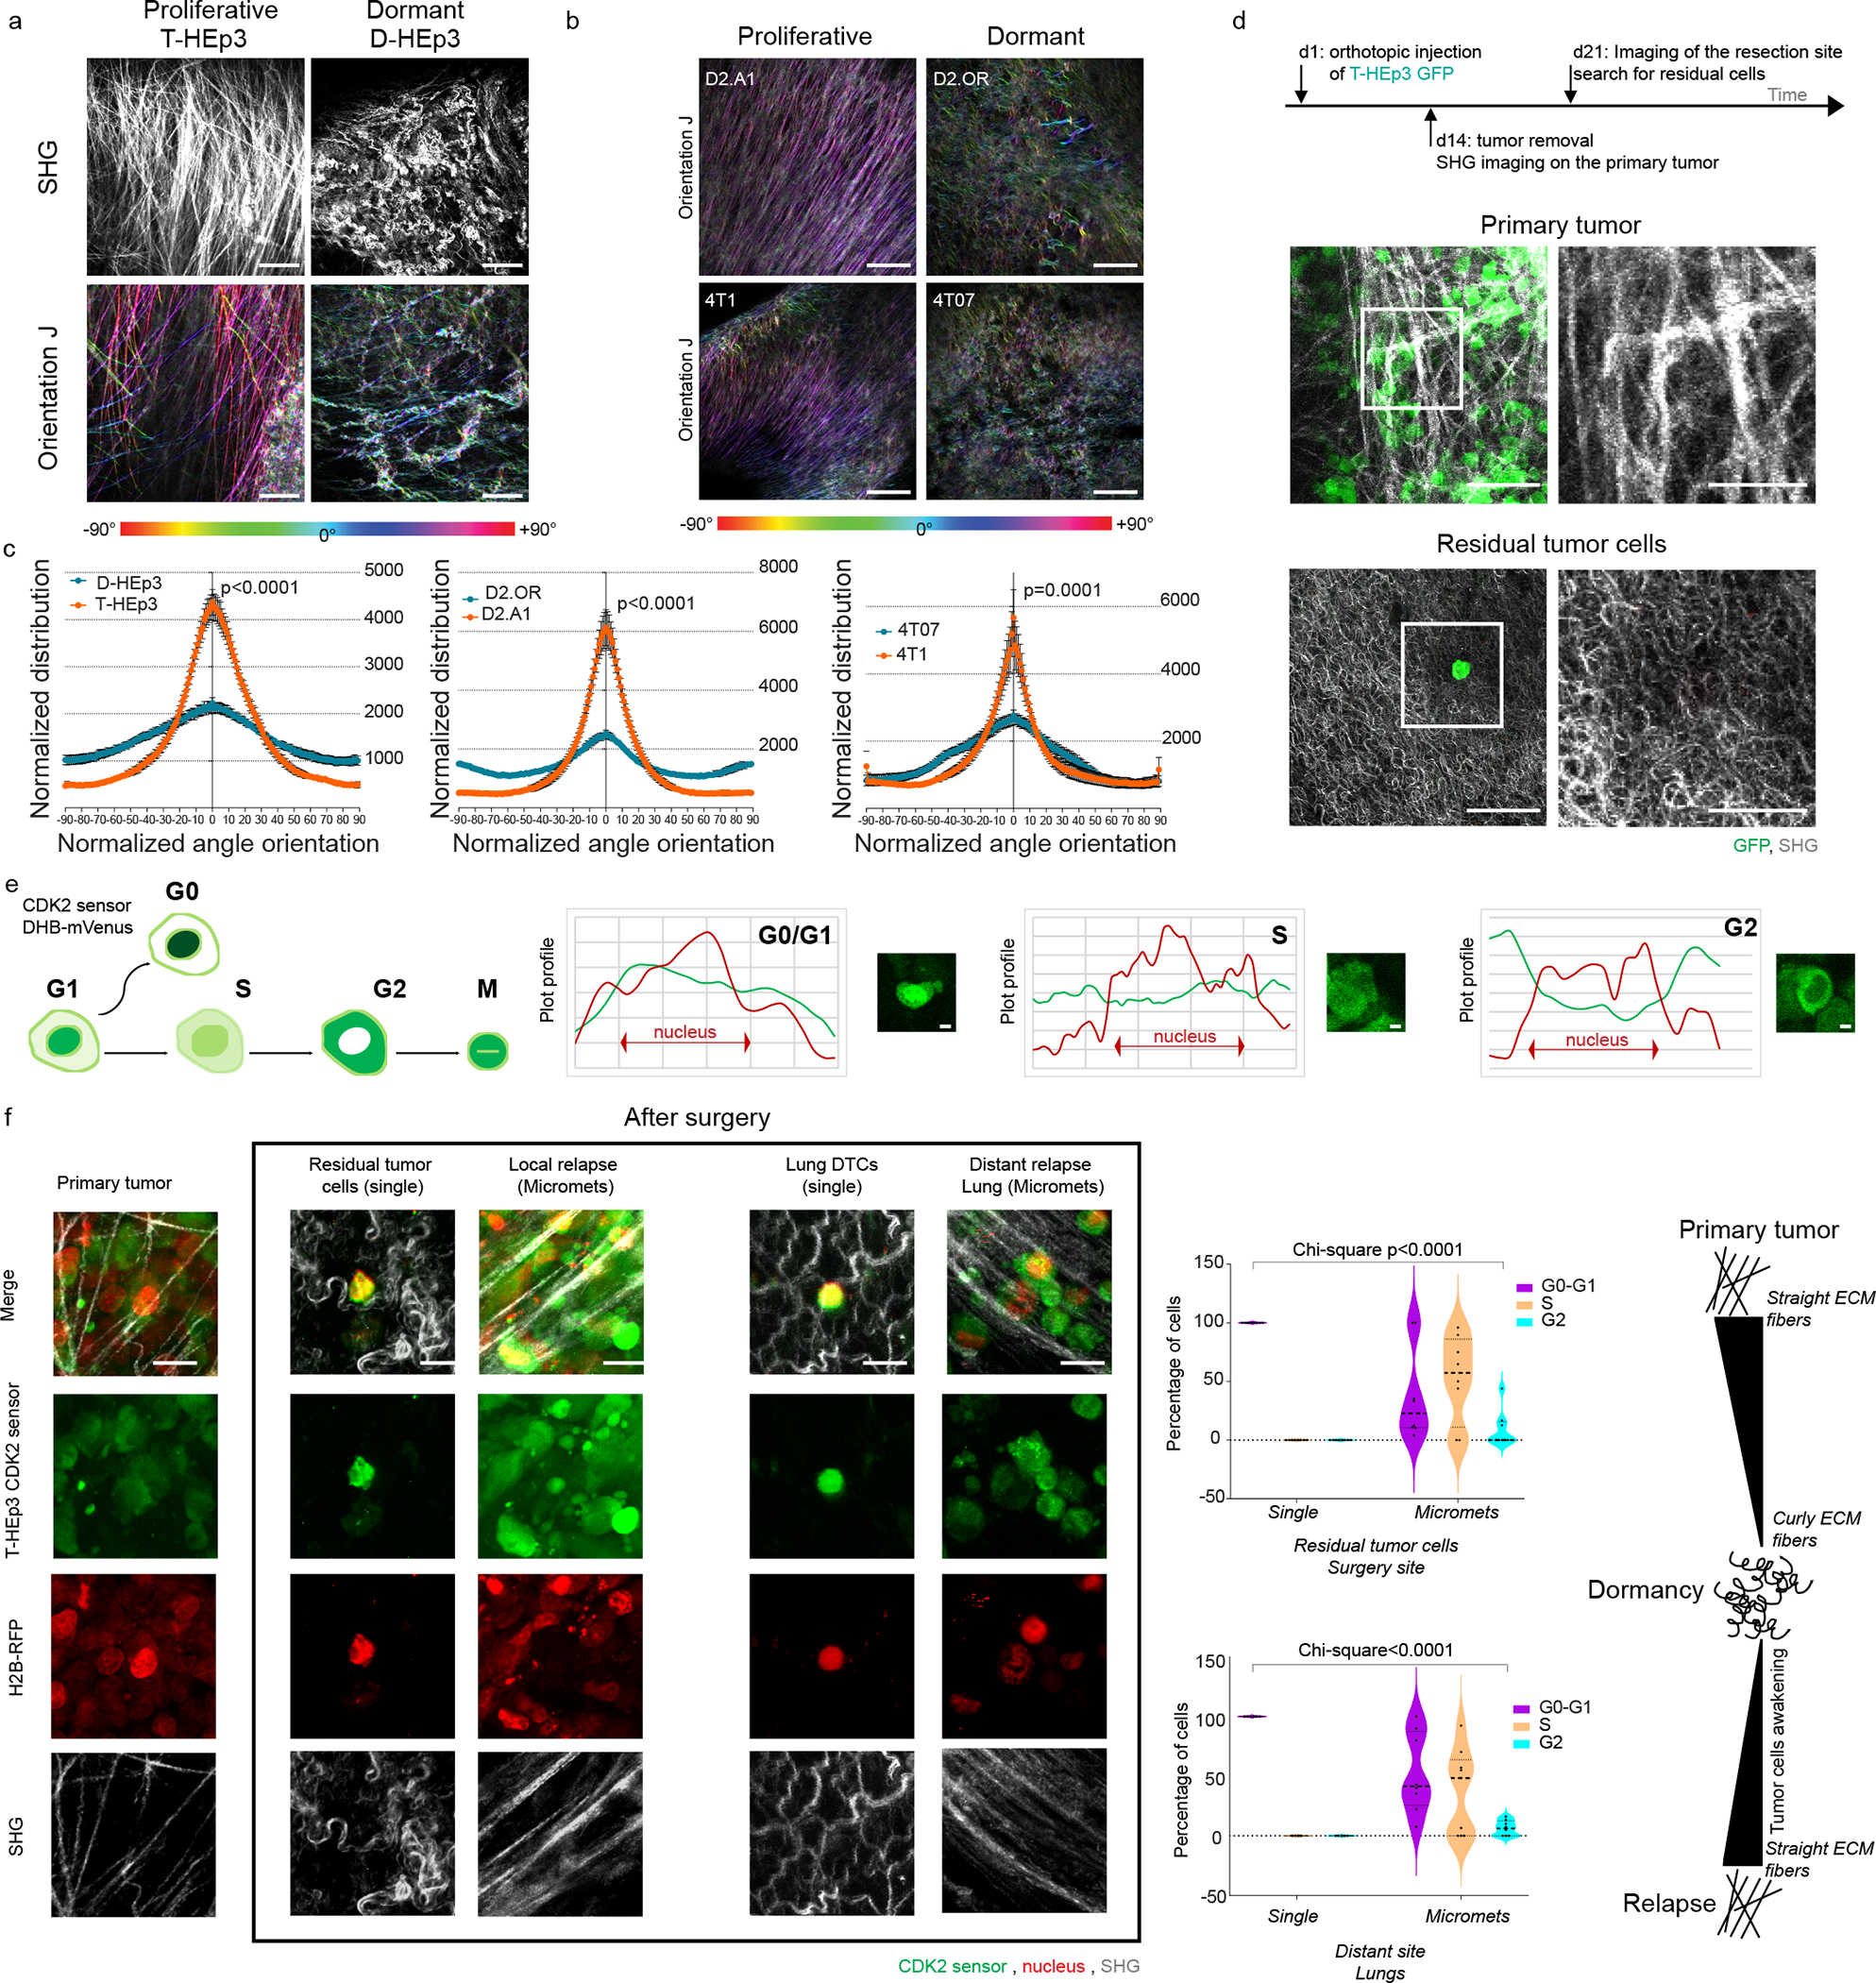
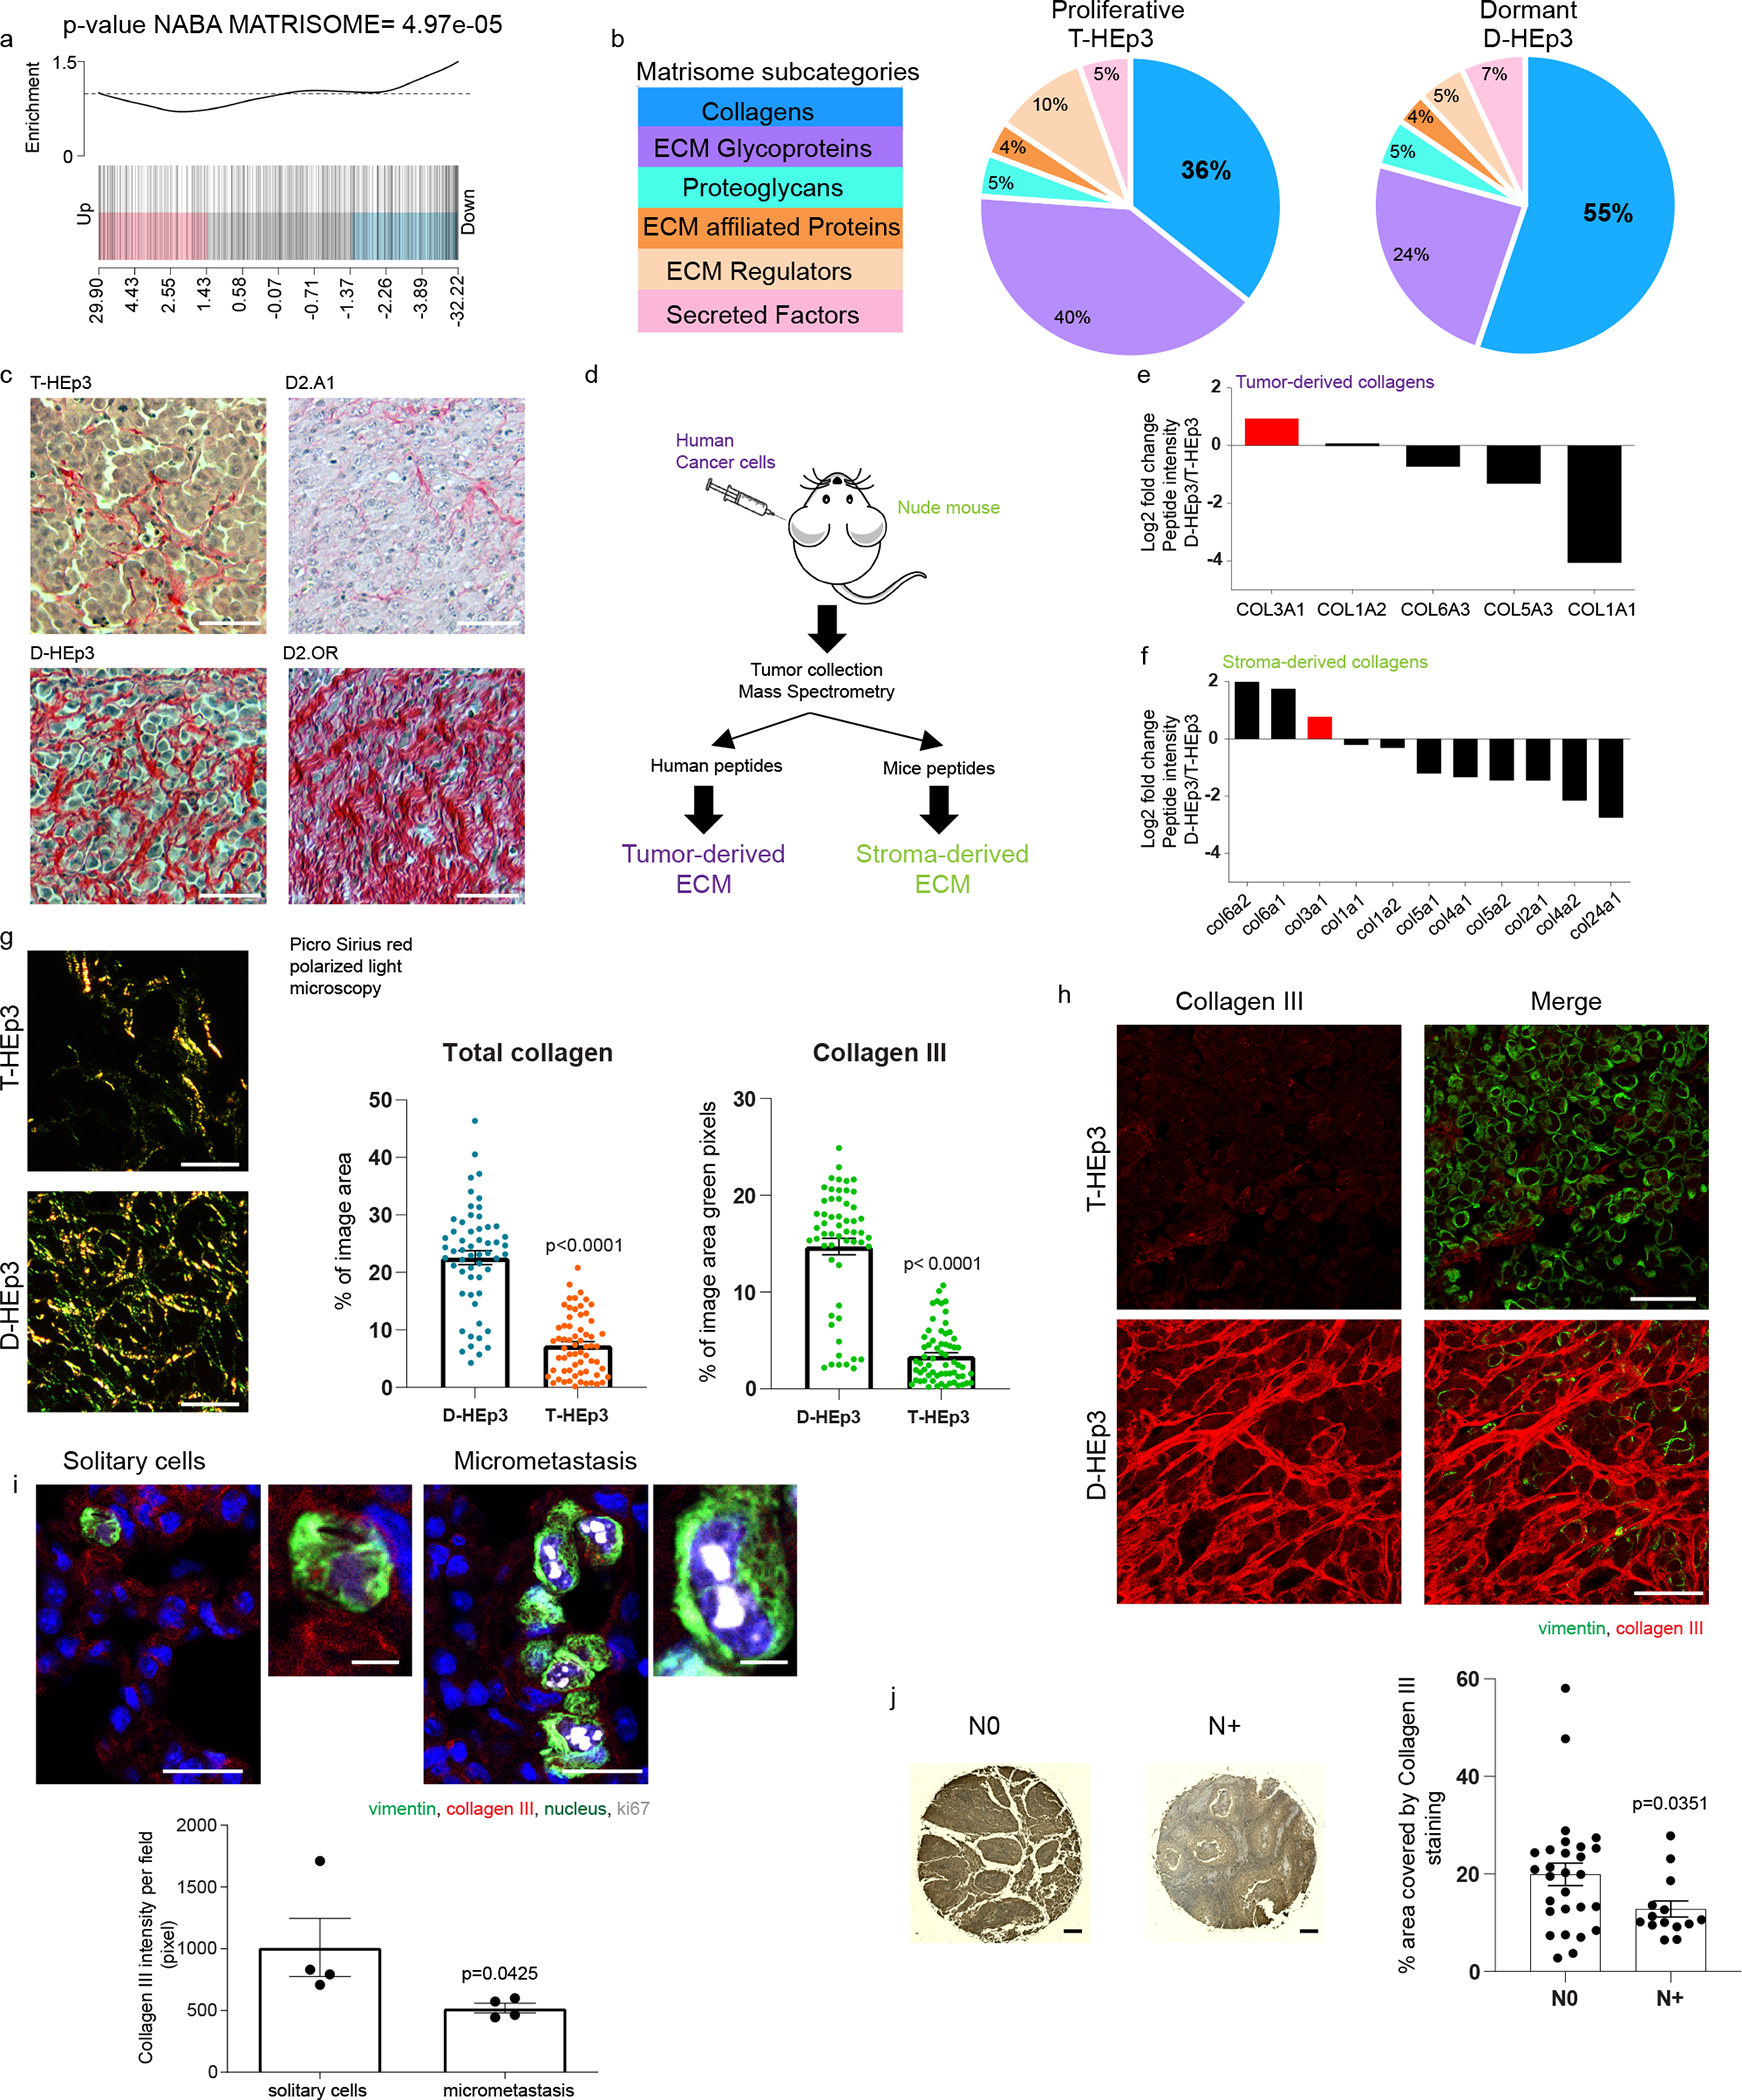
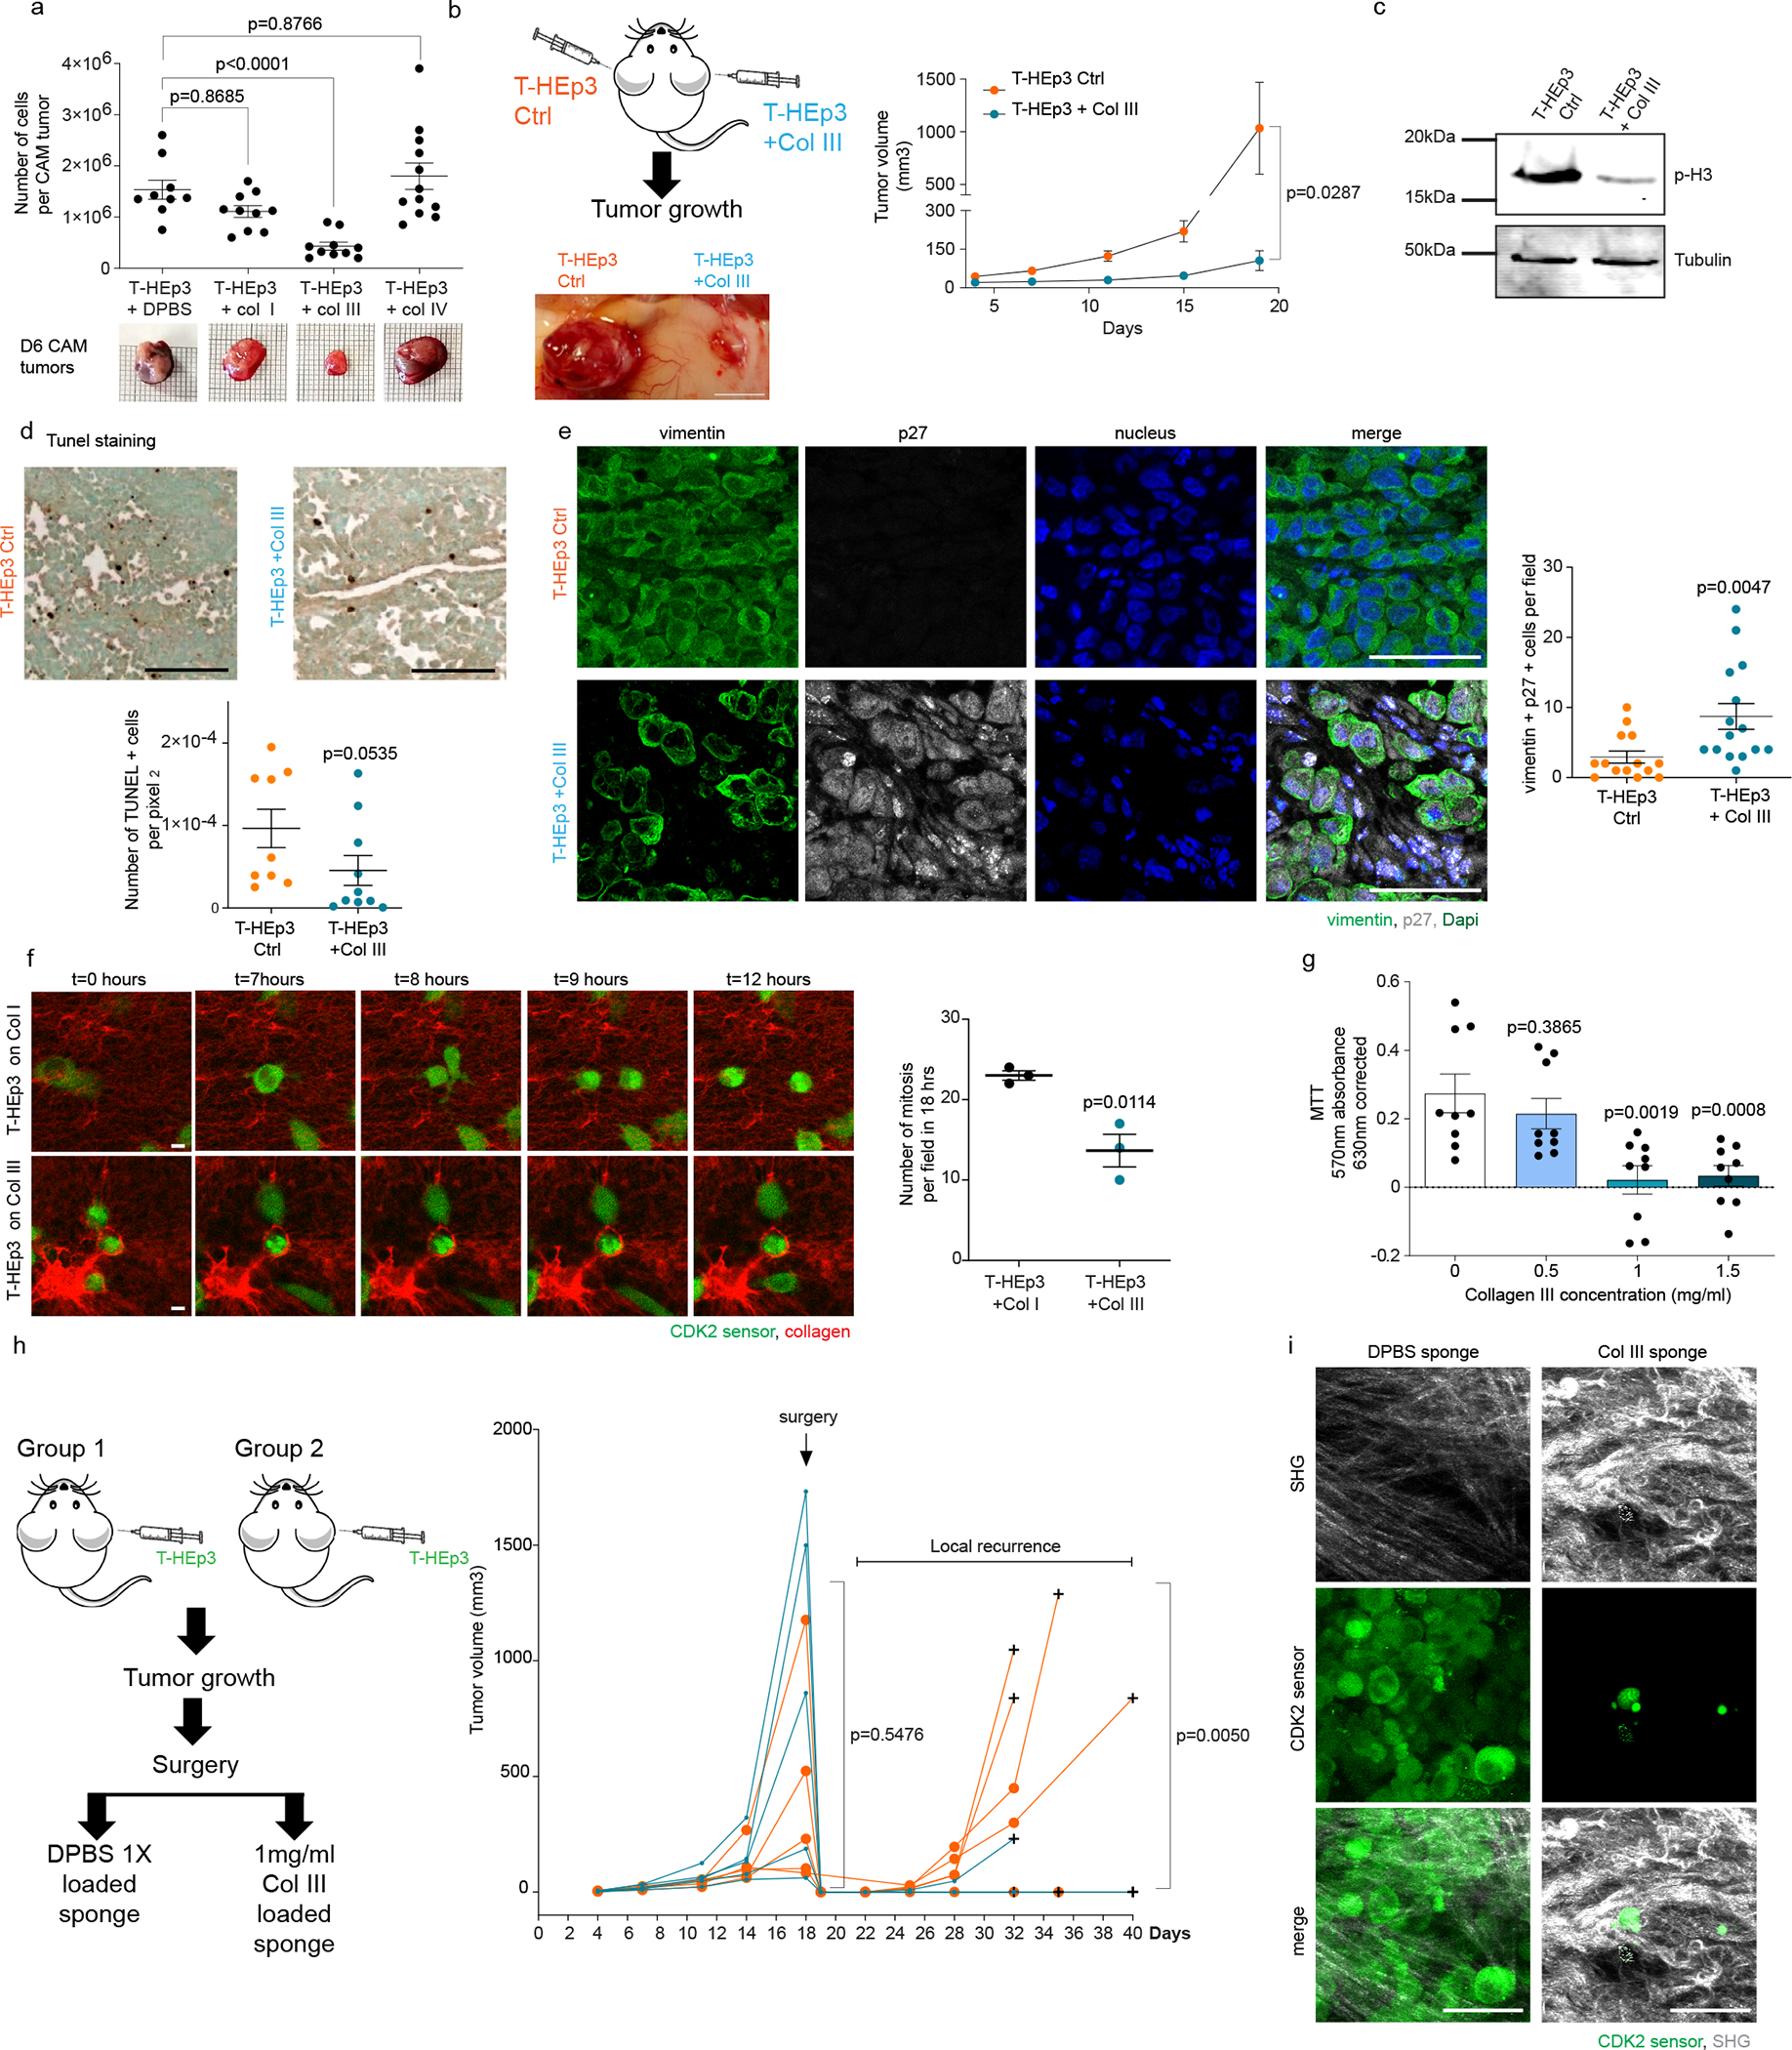
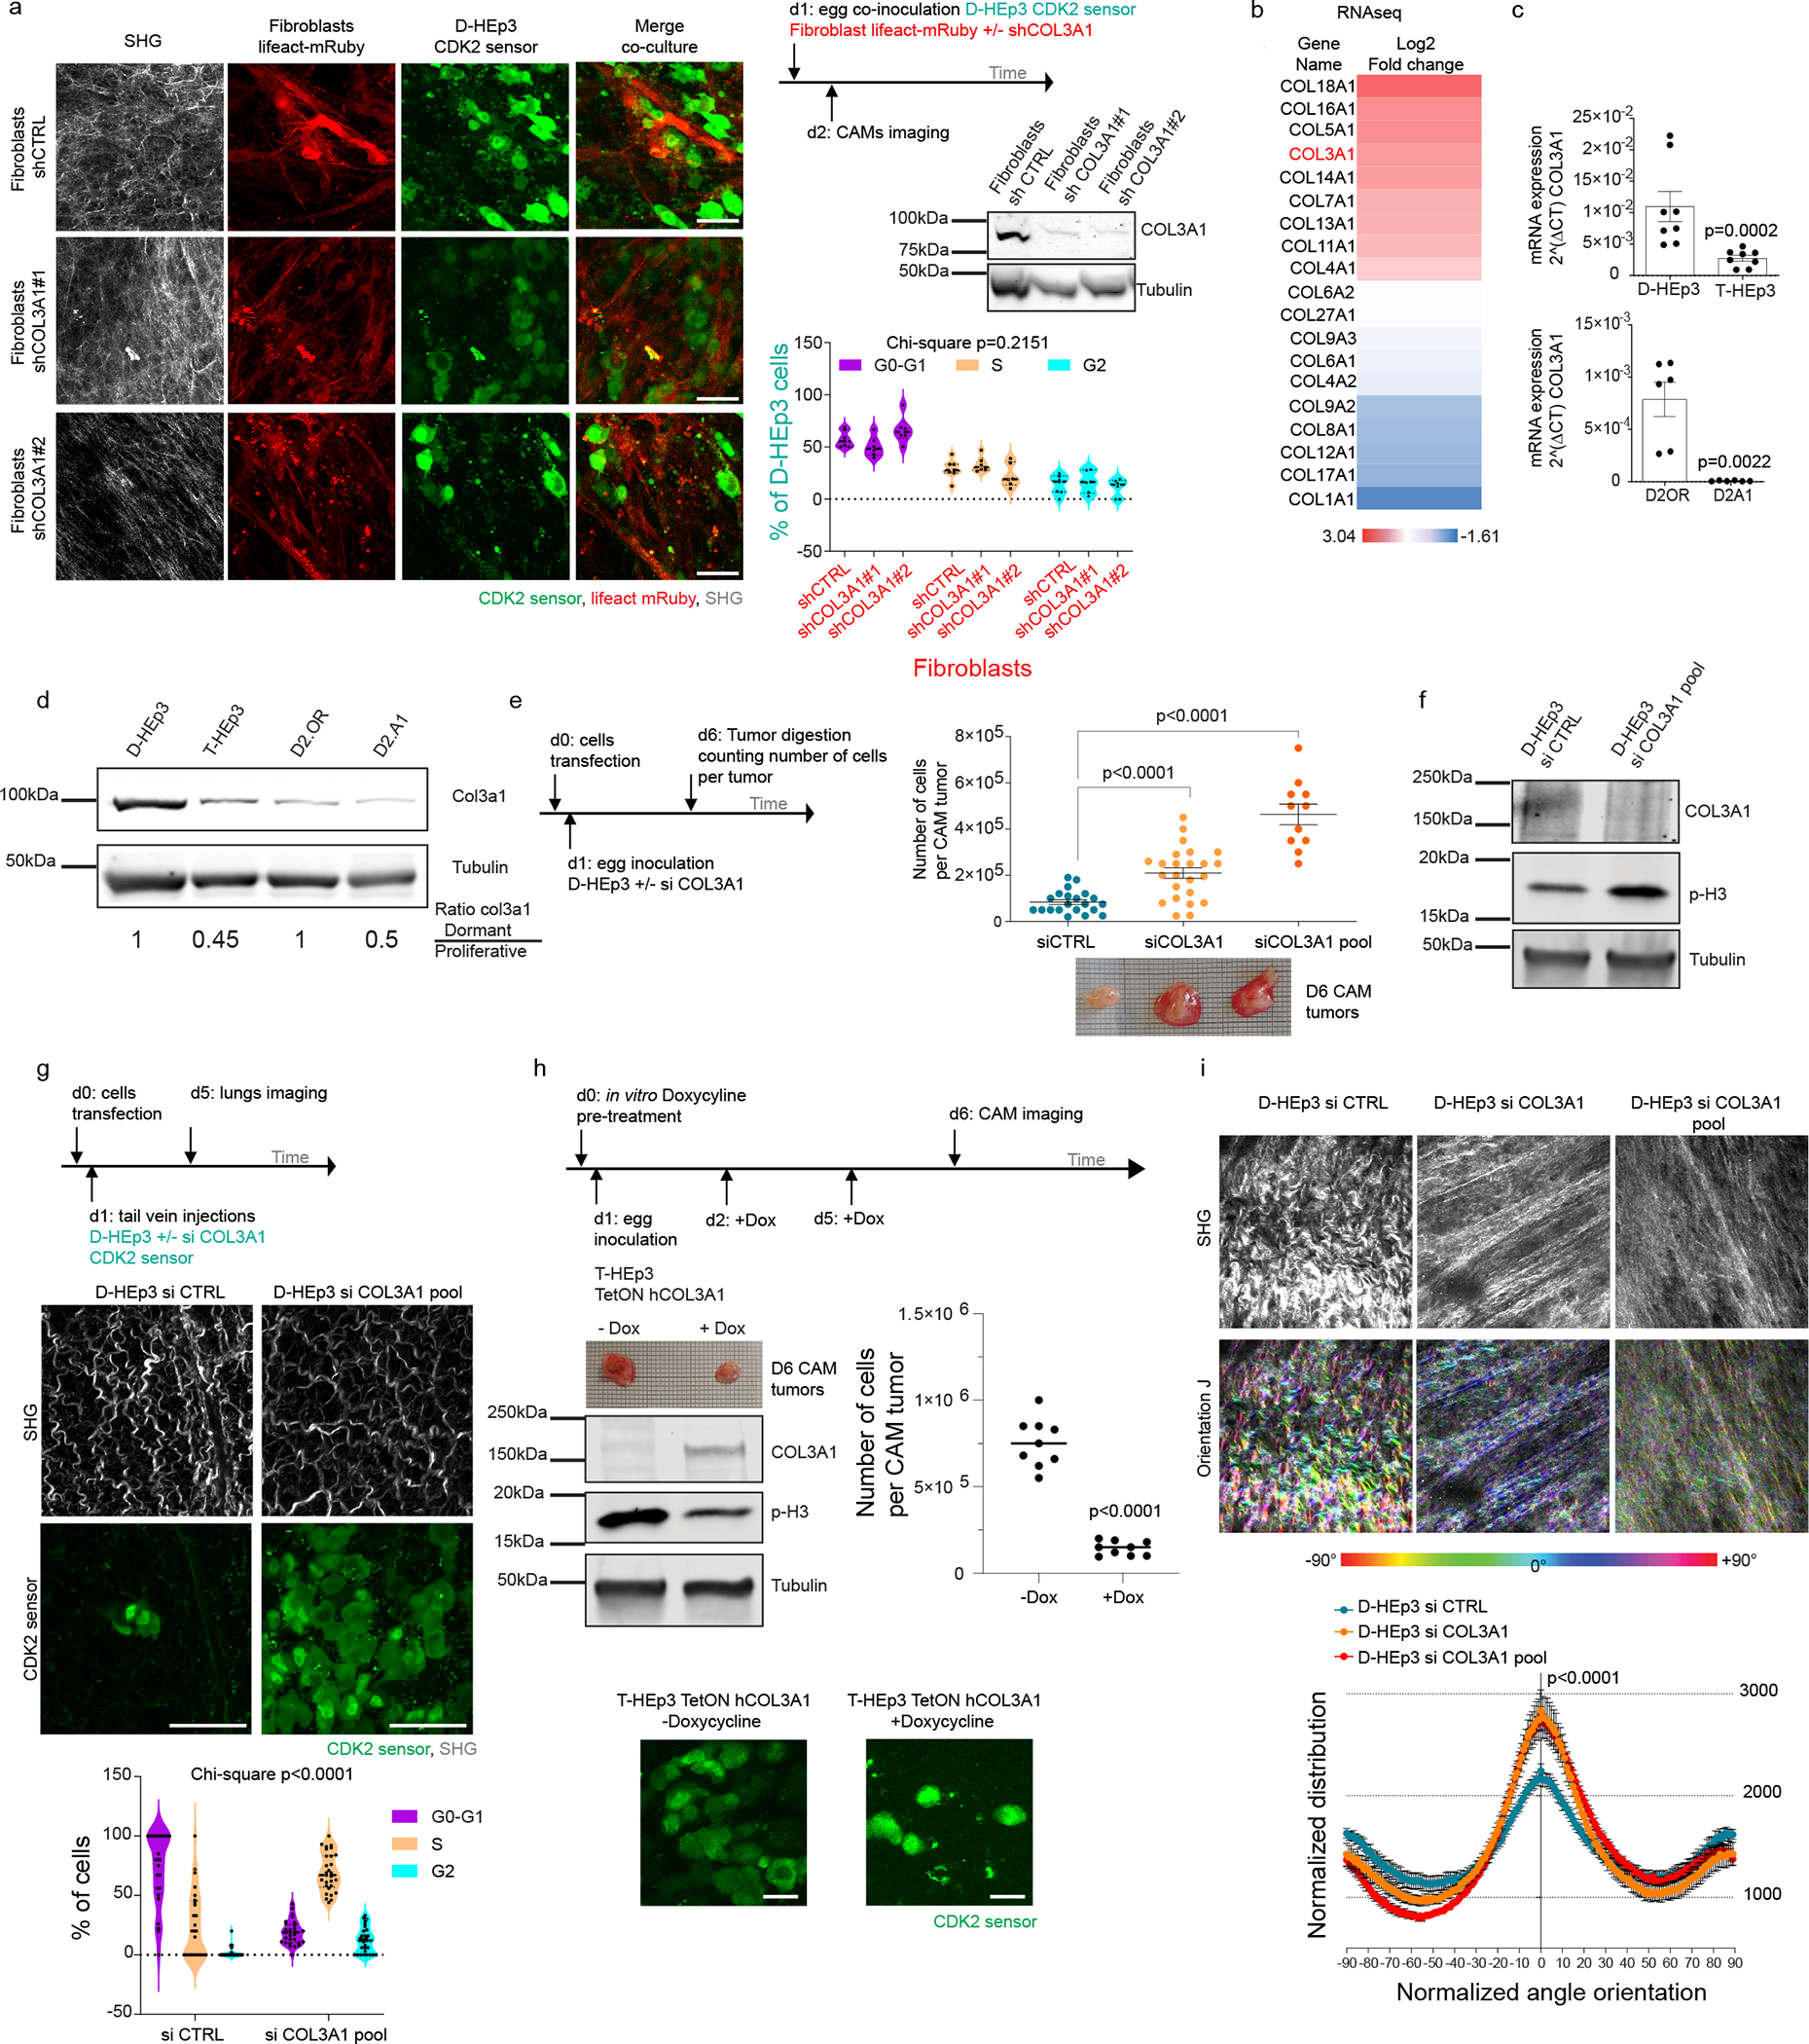
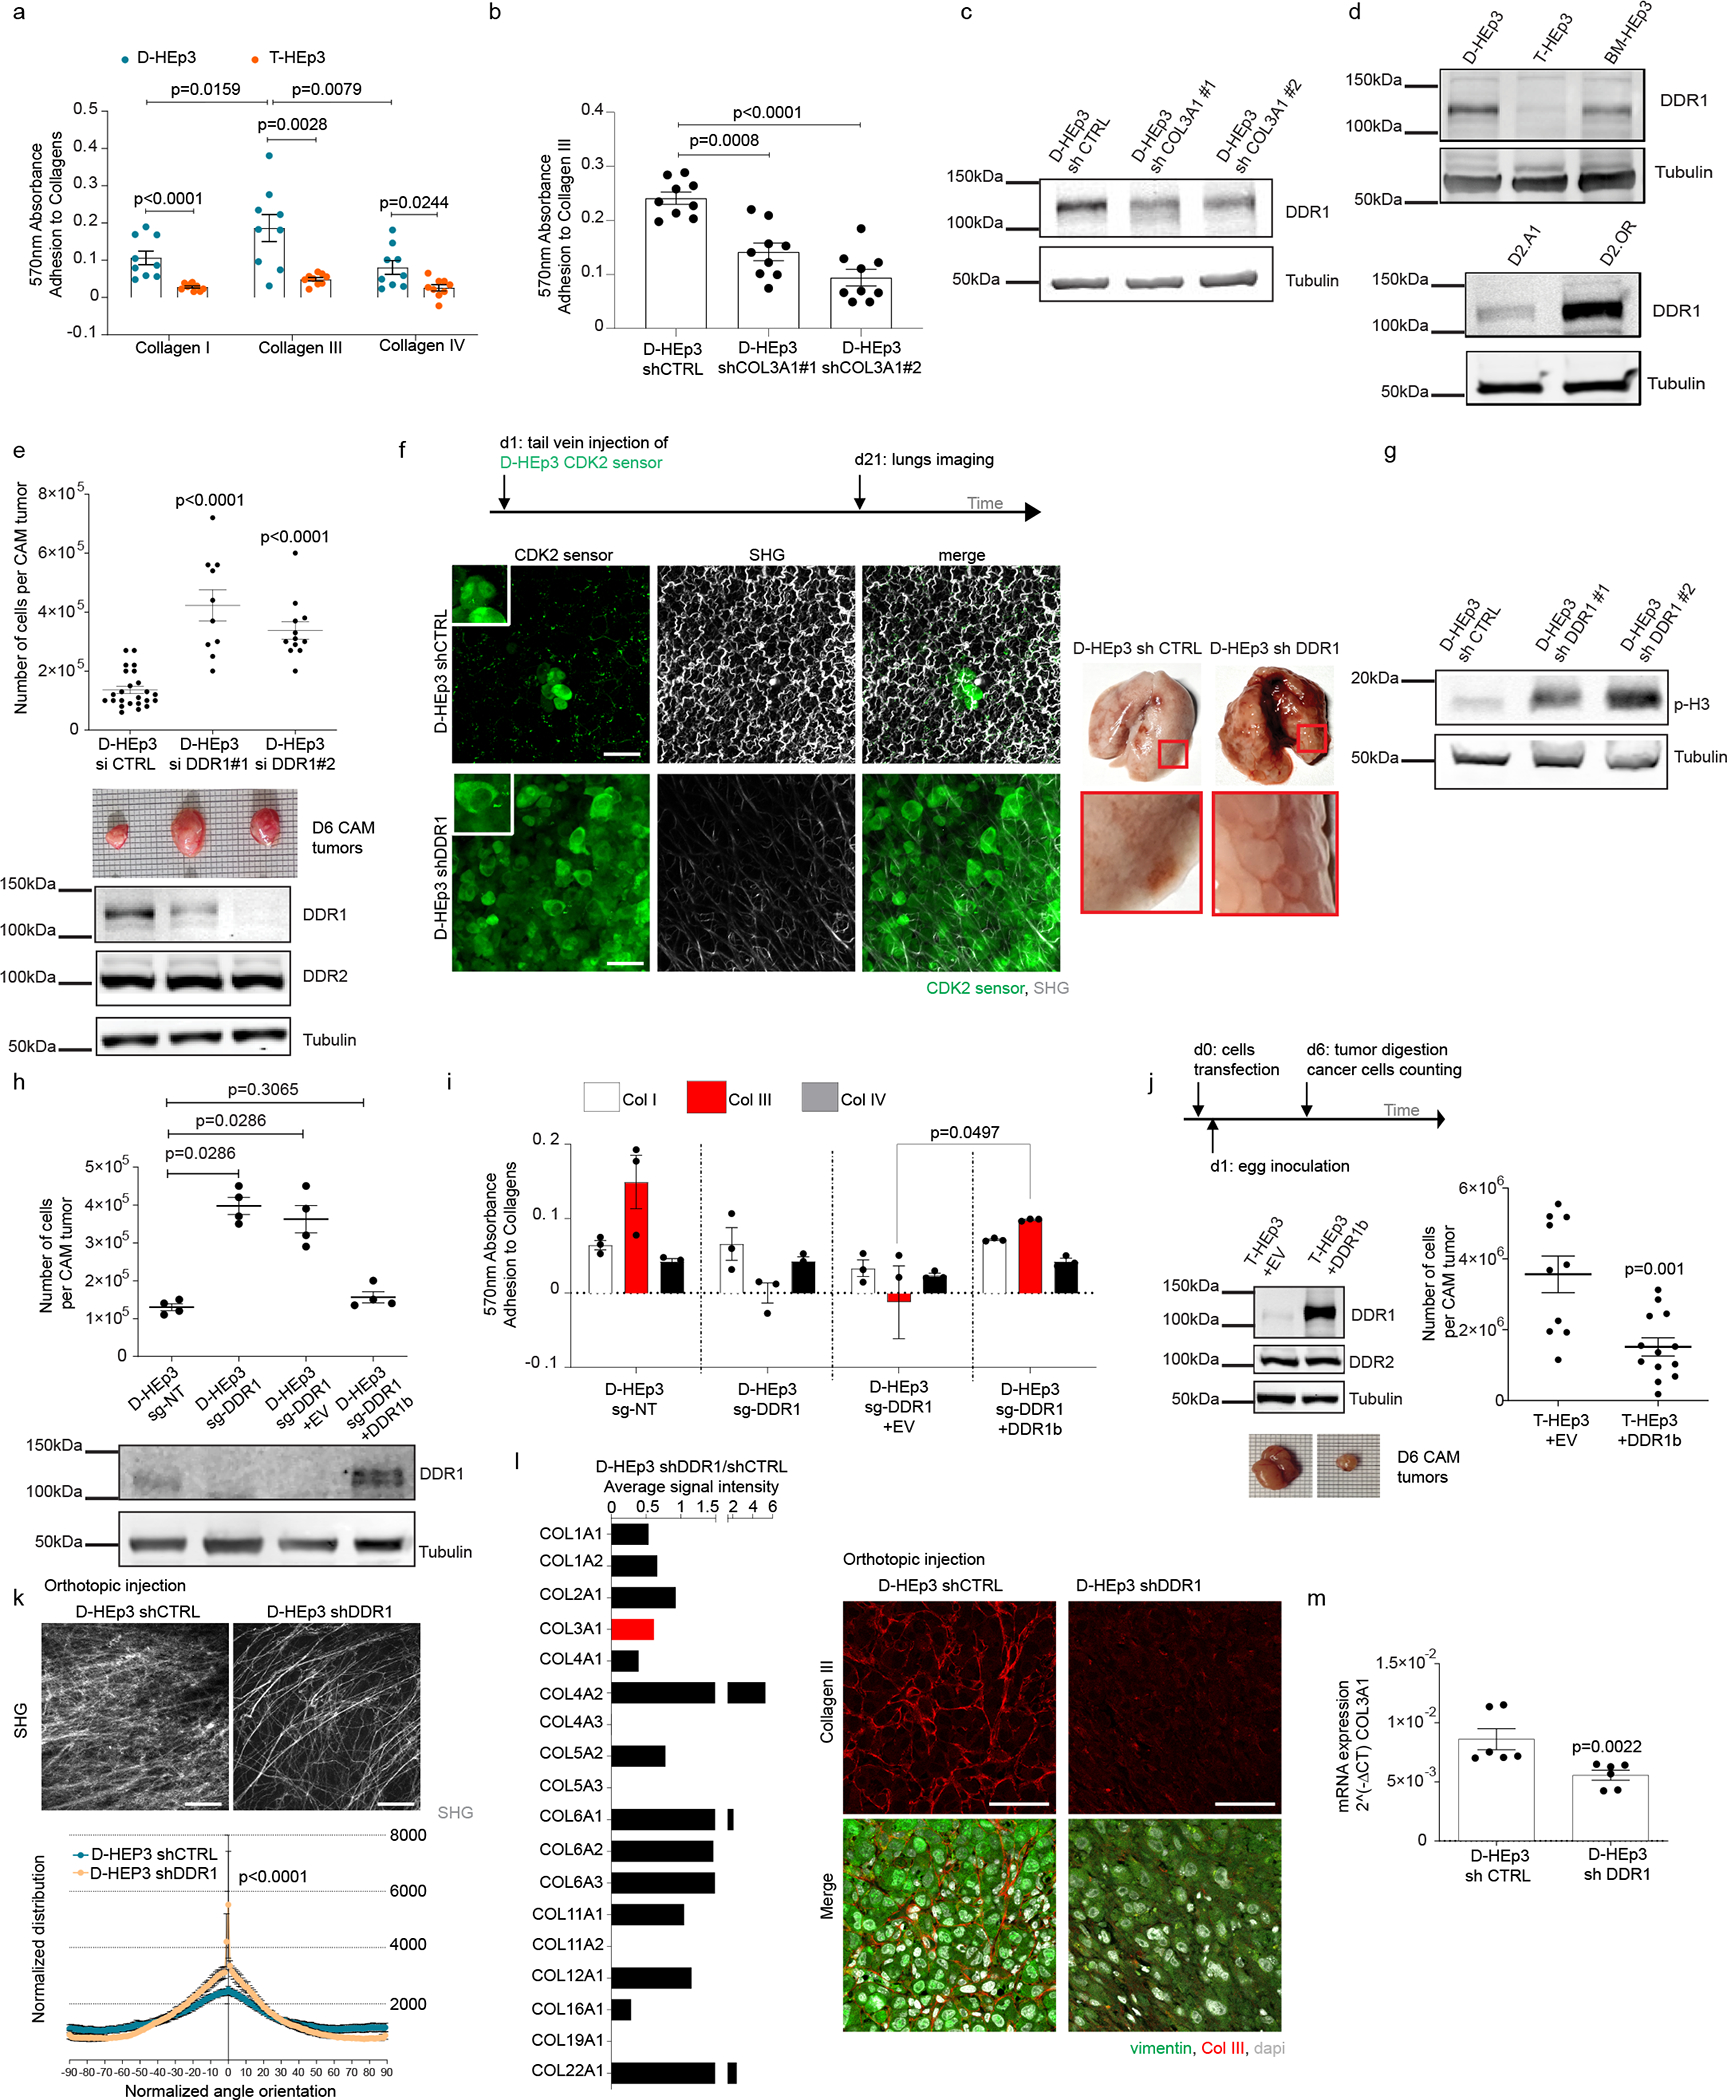
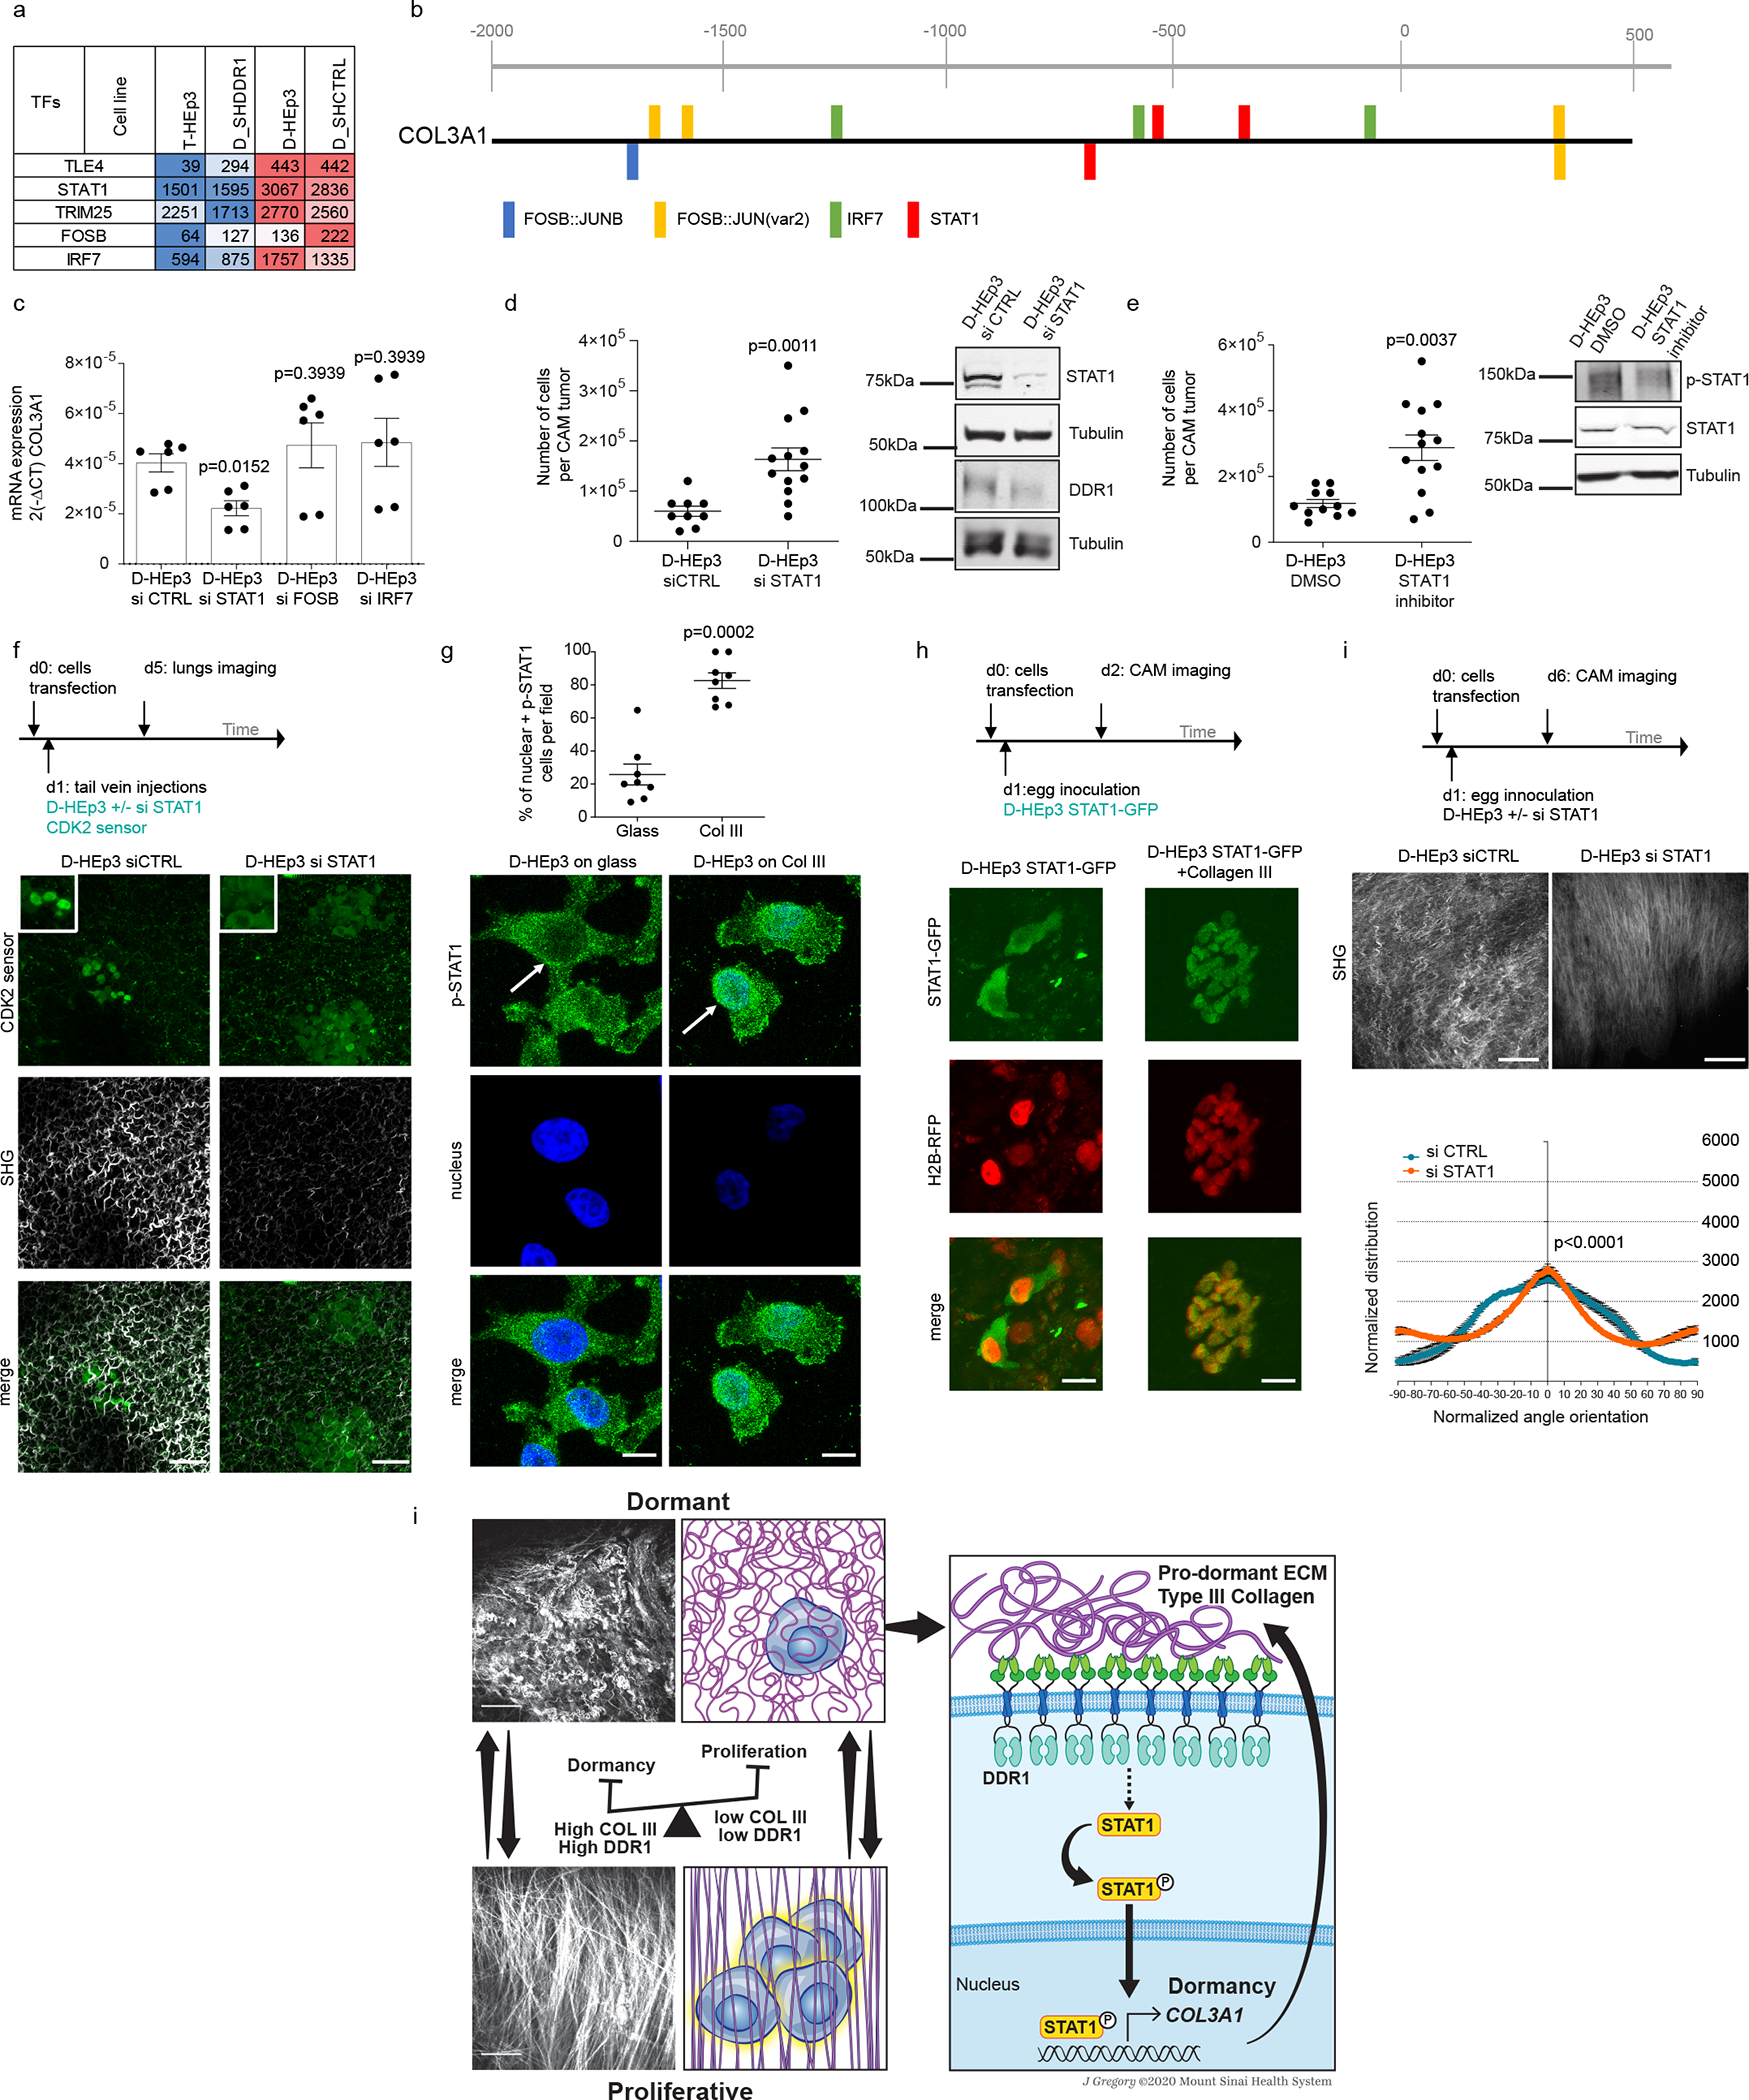
Cancer cells disseminate and seed in distant organs, where they can remain dormant for many years before forming clinically detectable metastases. Here we studied how disseminated tumor cells sense and remodel the extracellular matrix (ECM) to sustain dormancy. ECM proteomics revealed that dormant cancer cells assemble a type III collagen-enriched ECM niche. Tumor-derived type III collagen is required to sustain tumor dormancy, as its disruption restores tumor cell proliferation through DDR1-mediated STAT1 signaling. Second-harmonic generation two-photon microscopy further revealed that the dormancy-to-reactivation transition is accompanied by changes in type III collagen architecture and abundance. Analysis of clinical samples revealed that type III collagen levels were increased in tumors from patients with lymph node-negative head and neck squamous cell carcinoma compared to patients who were positive for lymph node colonization. Our data support the idea that the manipulation of these mechanisms could serve as a barrier to metastasis through disseminated tumor cell dormancy induction.


Conflict of interest statement

Competing Interests Statement: EJF is member of the Scientific Advisory Board of Viosera Therapeutics. JAAG is a scientific co-founder of, scientific advisory board member and equity owner in HiberCell and receives financial compensation as a consultant for HiberCell, a Mount Sinai spin-off company focused on therapeutics that prevent or delay cancer recurrence. The other authors have no conflict of interest to disclose.

Figures

Extended Data Fig. 1
Extended Data Fig. 1. Supportive Data to Main Figure 1
All numerical data are presented as mean +/−SEM. (a) Experimental design of CAMs experiments. d refers to days on timeline scheme. Left panel: Representative images of day 6 collected tumors. Right panel: Top graph: T-HEp3 and D-HEp3 (n= 6 independent CAMs). Bottom graph: D2.A1 and D2.OR (n= 5 independent CAMs). Number of cells per tumor compared with an unpaired two-tailed Mann-Whitney test with 95% confidence level. (b) Representative multiphoton images of T-HEp3 and D-HEp3 CAM tumors. Scale bar, 50μm. d refers to days on timeline scheme. (c) Tissue microarray SHG analysis. Left panel: representative images of normal tissue versus stage IV HNSCC ECM architecture. Right images are a zoom of white squares on left image. Scale bars, 200μm. Scale bar zoom, 50 μm. Right panel: Collagen orientation between normal tissues (n=43 samples) and malignant HNSCC (n=289 samples) and between stage I to III (n=130 samples) and stage IV and IVa (n=53 samples). Data were compared using an unpaired two-tailed Mann-Whitney test with 95% confidence level. (d) Imaging window design and implantation site in mice (n=5). Representative images of T-HEp3-GFP in primary site. Scale bar, 100μm. Zoom Scale bar, 50μm. d refers to days on timeline scheme. (e) Left panel: Nude mice lung representative images with or without T-HEp3 GFP spontaneously disseminated cells. Scale bar, 50μm. Right panel: NCG mice lungs representative images with MDA-MB-231 GFP spontaneously disseminated cells. Scale bar, 50μm.
Extended Data Fig. 2
Extended Data Fig. 2. Supportive Data to Main Figure 2
(a) ECM enrichment pipeline for mass spectrometry. (b) ECM-enrichment validation by western blot before mass spectrometry analysis. Removal of intracellular components and ECM enrichment via sequential decellularization (lanes 2–4) from the total tissue lysate (1) was monitored by immunoblotting for actin (cytoskeleton protein) and histones (nuclear proteins). The remaining insoluble fraction (5) was highly enriched for ECM proteins (collagen I) and largely depleted for intracellular components. (c) Proportion of the mass-spectrometric signal intensity from matrisome (blue) and non-matrisome (grey) peptides for each sample, related to Supplementary Table 1B. (d) Masson’s trichrome staining of proliferative and dormant mice tumors. Scale bars, 50μm. (e) Percentage of tumor-derived and stroma-derived ECM d in D-HEp3 and T-HEp3 mice tumors, related to Supplementary Tables 1H and I. (f) Collagen III staining specificity tested in immunohistochemistry staining on human skin tissues (Scale bar, 100μm) and by western blot using purified native human collagen I and III.
Extended Data Fig. 3
Extended Data Fig. 3. Supportive Data to Main Figure 3
All numerical data are presented as mean +/−SEM. (a) Representative images of Masson’s Trichrome from T-HEp3 mice tumors with or without type III collagen co-injection. Scale bar, 50μm. (b) Normalized distribution of collagen fiber orientation from tumors presented in A (n= 5 independent tumors per group, 2 images analyzed per tumors). Cumulative distributions were compared using an unpaired two-tailed Kolmogorov Smirnov test with 95% confidence level. (c) Tumor growth of D2.A1 +/− type III collagen co-injection (n= 5 mice per group). Curves were compared using a two-way ANOVA with mixed model effects analysis and a Bonferroni correction and a 95% confidence interval. (d) Tumor growth of 4T1 +/− type III collagen co-injection (n= 5 mice per group). Curves were compared using a two-way ANOVA with mixed model effects analysis and a Bonferroni correction and a 95% confidence interval. (e) FACS analysis for percentage of T-HEp3 live cells (green), dead cells (red), apoptotic cells(yellow), and necrotic cells (orange) plated on plastic, type I collagen, or type III collagen matrix (n= 3 independent experiments). Distributions were compared using a Chi-squared test with 95% confidence interval. (f) Time points from an 18hrs time lapse movie of D-HEp3 plated on type I or III collagen. (t=hours). Scale bar, 10 μm. Related to Supplemental Movies 3 and 4. (g) APOTOX assay of T-HEp3 plated on different concentrations of type III collagen for 24hrs (n= 3 independent experiments).
Extended Data Fig. 4
Extended Data Fig. 4. Supportive Data to Main Figure 4
(a) Representative multiphoton images of MRC5 fibroblasts shRNA CTRL or expressing 2 independent shRNA targeting COL3A1 seed in CAMs for 24hrs. Scale bar, 50μm. (b) Top panel: representative brightfield images of D2.OR shRNA CTRL or expressing 2 independent shRNAs targeting col3a1 in vitro. Bottom panel: immunofluorescence of D2.OR shRNA CTRL or expressing 2 independent shRNAs targeting COL3A1 in vitro for E-cadherin. Scale bar, 50μm. (c) Number of cells per tumor for D-HEp3 expressing a control siRNA or siRNA targeting COL1A1, COL1A2, COL5A1, COL5A2, COL5A3, COL6A1, COL6A2, COL6A3, COL16A1 or COL18A1 in CAMs. (n= number of CAMs per group are described in the graphs). Data were compared using unpaired two-tailed Mann-Whitney test with 95% confidence level. All numerical data are presented as mean +/−SEM.
Extended Data Fig. 5
Extended Data Fig. 5. Supportive Data to Main Figure 5
All numerical data are presented as mean +/−SEM. (a) Adhesion assay for T-HEp3 and D-HEp3 to fibronectin. (n= 3 independent experiment with triplicates). Data were compared using unpaired two-tailed Mann-Whitney test with 95% confidence level. (b) Adhesion assay for D2.OR expressing an shRNA control or targeting COL3A1 to type III collagen. (n= 3 independent experiment with triplicates). Data were compared using unpaired A tumor-derived type III collagen-rich ECM niche regulates tumor cell dormancytwo-tailed Mann-Whitney test with 95% confidence level. (c) Upper panel: Number of cells per CAM tumors of D2.OR shCTRL or sh DDR1 (n=8 independent CAMs shCTRL, n=4 shDDR1#1, n=5 sh DDR1#2, n=7 shDDR1#3). Data were compared using unpaired two-tailed Mann-Whitney test with 95% confidence level. Note that shRNA 1 and 3 only deplete DDR1. Lower panel: Western blot showing DDR1, DDR2 and tubulin levels upon DDR1 depletion. (d)Upper panel: Number of cells per CAMs tumors of BM-HEp3 (dormant) expressing a control siRNA or siRNA targeting DDR1. (n=5 independent CAMs per condition). Data were compared using unpaired two-tailed Mann-Whitney test with 95% confidence level. Lower panel: Western blot showing DDR1 and tubulin levels upon DDR1 depletion. (e) Percentage of G0 cells from D-HEp3 cells expressing a control siRNA or siRNA targeting DDR1. (n=3 independent experiments). Data were compared using unpaired two-tailed Mann-Whitney test with 95% confidence level. (f) Western blot for DDR1 and tubulin in D-HEp3 NT sgRNA control and expressing an sgRNA against DDR1. (g) Number of cells per CAM tumors in D-HEp3 shCTRL or shDDR1, or shDDR1 rescued with overexpression of either an empty vector (EV), a DDR1b full length, a binding deficient mutant (W53A) or a kinase dead mutant (K655A) (n= 5 independent CAMs). Data were compared using an ordinary one-way ANOVA test with multiple comparison to shCTRL condition with 95% confidence level. (h) Number of cells per CAM tumors of D-HEp3 +/− Nilotinib treatment (n=12 control CAMs and n=17 treated CAMs) Data were compared using unpaired two-tailed Mann-Whitney test with 95% confidence level. Representative tumors and Western blot showing phospho-Tyrosin (pTYR), total DDR1 and tubulin levels upon nilotinib treatment are displayed below. (i) FACS analysis for percentage of T-HEp3 live cells (green), dead cells (red), apoptotic cells(yellow), and necrotic cells (orange), treated with jetPRIME only or expressing a control empty plasmid (EV) or DDR1b full length (n= 3 independent experiments). Distributions were compared using a one-tailed Chi-squared test with 95% confidence interval. (j) Number of T-HEp3 cells per CAM tumors expressing a control shRNA or an shRNA targeting DDR1 (n= 8 control CAMs and n=12 DDR1 depleted CAMs). Data were compared using unpaired two-tailed Mann-Whitney test with 95% confidence level. Representative tumors and Western blot showing DDR1, DDR2 and tubulin levels upon DDR1 depletion are displayed below. (k) FACS analysis for percentage of T-HEp3 live cells (green), dead cells (red), apoptotic cells(yellow), and necrotic cells (orange), expressing either a control shRNA or an shRNA targeting DDR1 (n= 3 independent experiments). Distributions were compared using a one-tailed Chi-squared test with 95% confidence interval. (l) Number of cells per CAM tumors of T-HEp3 +/− Nilotinib treatment (n=10 control CAMs and n=7 treated CAMs). Data were compared using unpaired two-tailed Mann-Whitney test with 95% confidence level. Representative tumors and Western blot showing phospho-Tyrosin (pTYR), total DDR1 and tubulin levels upon nilotinib treatment are displayed below. (m) Number of R-HEp3 cells per tumors in CAM expressing a control shRNA or an shRNA targeting DDR1. (n= 13 control CAMs, n=13 shDDR1#1, n=14 shDDR1#2). Data were compared using unpaired two-tailed Mann-Whitney test with 95% confidence level. Representative tumors and Western blot showing DDR1and tubulin levels upon DDR1 depletion are displayed below. (n) Enrichment plot for matrisome signature from RNA sequencing performed in D-HEp3 shRNA CTRL and D-HEp3 shDDR1 mice tumors (p=7.68e-10). X-axis shows log2FC for D-HEP3 shRNA DDR1 vs D-HEp3 shRNA CTRL. Black bars represent matrisome genes. Related to supplemental table 4. (o) Heat map related to tables 2 and 4 where the entire transcriptome is displayed and organized by alphabetical order of genes. T-HEp3 and Reactivated D-shDDR1 cells show similar profiles compared with D-HEp3 and D-shCTRL conditions. Heat maps were generated using the Biojupie tool (https://maayanlab.cloud/biojupies/) .
Extended Data Fig. 6
Extended Data Fig. 6. Supportive Data to Main Figure 6
All numerical data are presented as mean +/−SEM. (a) Map of predicted sites for STAT1 in DDR1 promoter region using the CiiiDER tool. (b) Number of mice presenting single cells, clusters of less than 20 cells or micromets in their lungs after tail vein injection of D-HEp3 +/− si STAT1. (c)RT-qPCR for STAT1 from RNA extracted from D-HEp3 shRNA CTRL or shDDR1 tumors in vivo (n= 3 independent RNA extraction from 3 different tumors, in duplicate). Data were compared using unpaired two-tailed Mann-Whitney test with 95% confidence level. (d) RT-qPCR for STAT1 from RNA extracted from D-HEp3 cells in vitro expressing a control siRNA or siRNA targeting COL3A1 (n= 3 independent RNA extractions in duplicate). Data were compared using unpaired two-tailed Mann-Whitney test with 95% confidence level.
Fig. 1.
Fig. 1.. Characterization of the ECM architecture around dormant cells
All numerical data are presented as mean +/−SEM. (a) Upper panel: Representative SHG images from T-HEp3 and D-HEp3mice tumors. Lower panel: Representative Collagen OrientationJ output obtained from SHG images. More colors = less alignment. Color Scale bar represent fiber orientation. Scale bar, 100μm. (n=5 tumors per group) (b) OrientationJ visual output obtained from SHG images of D2.A1, D2.OR, 4T1 and 4T07 CAMs tumors. Scale bars, 100μm. (n=5 tumors per group) (c) Normalized distribution of collagen fiber orientation from tumors presented in A and B. (n= 5 mice for D-HEp3/T-HEp3, 2 images per animal; n= 5 CAMs for D2.OR/D2.A1 and 4T07/4T1, 2 images per animal). Cumulative distributions were compared using an unpaired two-tailed Kolmogorov-Smirnov test with 95% confidence level. Data are presented as mean values +/− SEM. (d) Top panel: Representative multiphoton images of T-HEp3-GFP primary tumors. Bottom panel: Residual local tumor cells after surgery. Scale bars, 100μm. Red square represents a magnified area. Scale bars, 50μm. (n=5 mice). d refers to days on timeline scheme. (e) CDK2 sensor (DHB-mVenus) fluorescence dynamics correlated with phase of the cell cycle. Example of plot profile for CDK2 sensor and H2B-RFP fluorescence intensity during each phase of the cell cycle based on imaging data. Inserts are representative images of the sensor for each phase of the cell cycle in vivo in T-HEp3 mice tumor. Scale bars, 5μm. (f) Left panel: Representative two-photon imaging of T-HEp3-DHB-mVenus in mice. T-HEp3 cells in green, H2B-RFP in red and SHG in gray. Scale bars, 20μm. Middle panel: Violin plots of percentage of cells in each phase of the cell cycle at surgery site and in lungs (n=5 mice, 38 single cells were counted per condition). Distributions were compared using a One-tailed Chi-squared test with 95% confidence interval. Right panel: A scheme showing the ECM architecture changes as cancer progresses.
Fig. 2.
Fig. 2.. Proteomic analysis of the ECM of dormant and proliferative tumors
All numerical data are presented as mean +/−SEM. (a) Enrichment plot for matrisome signature from RNA sequencing performed in D-HEp3 and T-HEp3 mice tumors. X-axis shows log2FC for T-HEp3 versus D-HEp3. Black bars represent matrisome genes. (n= 3 tumors per group) (related to Supplementary Table 2). (b) Proteomic characterization of the matrisome of D-HEp3 and T-HEp3 tumors related to Supplementary Table 1C. Each color represents a subcategory of the matrisome signature. (c) Picro Sirius red staining of proliferative and dormant mice tumors. Collagen fibers are stained in pink, nucleus in dark grey.) Scale bars, 50μm. (d) Scheme of the mass spectrometry experiment allowing the separation between the tumor-derived and stroma-derived ECM. (e) Relative abundance of tumor-derived collagens identified in D-HEp3 and T-HEp3 tumors (n= 3 tumors per group) (related to Supplementary Table 1). (f) Relative abundance of stroma-derived collagens identified in D-HEp3 and T-HEp3 tumors (n= 3 tumors per group) (related to Supplementary Table 1). (g) Polarized-light microscopy images of Picrosirius red staining from proliferative and dormant mice tumors. Thick collagen fibers are colored in red to yellow (equivalent to type I collagen) and thin fibers are colored in green (equivalent to type III collagen) Scale bars, 50μm. Graphs from left to right: (1) Percentage of total collagen covered area per field comparing T-HEp3 and D-HEp3 tumors. (n=56 images for D-HEp3: n=63 images for T-HEp3 over 4 mice) (2) Analysis of the green component (type III collagen) of images using CIELAB module in ImageJ comparing T-HEp3 and D-HEp3 tumors. (n=56 images for D-HEp3: n=63 images for T-HEp3 over 4 mice). Data were compared using unpaired two-tailed Mann-Whitney test with 95% confidence level. (h) Immunofluorescence of D-HEp3 and T-HEp3 mice tumors for type III collagen (red). Cancer cells were stained with vimentin (green). Scale bars, 50μm. (i) Top: Representative image of type III collagen staining of solitary DTCs and micrometastasis of spontaneously disseminated T-HEp3 cells in mice lungs. DTCs were stained with vimentin (green), type III collagen (red) and Ki67 (grey) and DAPI (blue). Scale bars, 20μm. Red insert shows a zoom of the single cell. Scale bars, 5μm Bottom: quantification of type III collagen staining intensity per same size field between solitary cells and micrometastasis (n= 4 images from 4 mice lungs). Data were compared using unpaired two-tailed Mann-Whitney test with 95% confidence level. (j) Tissue microarray immunohistochemistry staining of type III collagen. Left panel: representative images of type III collagen staining in N0 cohort (no positive lymph node) versus N+ (1 or more positive lymph nodes) in HNSCC patient samples. Type III collagen in brown and nucleus in blue. Scale bars, 100 μm. Right panel: Percentage of area covered by type III collagen staining between N0 (n=28 samples) and N+ HNSCC (n=14 samples). Data were compared using unpaired two-tailed Mann-Whitney test with 95% confidence level.
Fig. 3.
Fig. 3.. Type III collagen enriched microenvironments induces dormancy
All numerical data are presented as mean +/−SEM. (a) Number of cells per CAM tumor for T-HEp3 co-injected with DPBS (n= 9 CAMs), collagen I (n=10 CAMs), collagen III (n=10) or collagen IV(n=12). Data were compared using unpaired two-tailed Mann-Whitney test with 95% confidence level. (b) Representative picture of both tumors at day 19 after inoculation in a same animal. Tumor growth over time (n=8 mice control n= 6 mice co-injected with type III collagen). Curves were compared using a one-tailed two-way ANOVA with mixed model effects analysis and a Bonferroni correction and a 95% confidence interval. (c) Western blot for phospho-histone H3 and tubulin loading control to compare T-HEp3 plated on plastic versus type III collagen for 24hrs in vitro. (d) TUNEL assay on tumors from (b). Scale bar, 200 microns. Graph represents the quantification of the number of TUNEL positive cells per pixel2 (n=9 sections from 4 mice tumors control, n=10 sections from 4 mice co-injected with type III collagen). Data were compared using unpaired two-tailed Mann-Whitney test with 95% confidence level. (e) Left panel: Immunofluorescence of tumors from experiment in (b). vimentin (green), p27 (gray) and DAPI (blue). Right panel: Number of p27(+) cells per field (n= 14 images from 4 mice control, n= 15 images from 4 mice co-injected with type III collagen). Scale bar, 50μm. Data were compared using unpaired two-tailed Mann-Whitney test with 95% confidence level. (f) Left panel: Time points from an 18hrs time lapse movie of T-HEp3 plated on type I or III collagen. (t=hours). CDK2-mVenus sensor (green) and 546-succinimidylester labelled collagen is shown (red). Scale bar, 10μm. Right: Quantification of the number of mitosis per field across 18hrs (n= 3 independent movies with more than 10 cells per field per condition). Data were compared using an unpaired two-tailed T-test. (Related to Supplemental Movies 1 and 2). (g) MTT assay of T-HEp3 plated on different concentrations of type III collagen for 24 hrs. (n= 3 independent experiments in triplicate per condition). Data were compared using unpaired two-tailed Mann-Whitney test with 95% confidence level. (h) Experimental design for treatment with type III collagen bioengineered scaffolds. Tumor growth over time before surgery and local tumor relapse over time, post-surgery for 21 days. (n=5 mice per group).Groups were compared prior to surgery using unpaired two-tailed Mann-Whitney test with 95% confidence level and relapses compared using a mixed model effects analysis with a Bonferroni correction and a 95% confidence interval. (i) Representative images of the resected area after tumor surgery at the time mice were sacrificed. SHG signal in gray and T-HEp3 CDK2 biosensor expressing cells in green. White arrow points towards a G0 T-HEp3 cell (nuclear localization of CDK2 sensor). Scale bar, 50μm.
Fig. 4.
Fig. 4.. Tumor-cell-derived type III collagen regulates dormancy
All numerical data are presented as mean +/−SEM. (a) Left panel: Representative multiphoton images of fibroblasts expressing an shRNA CTRL or targeting COL3A1 co-cultured with D-HEp3 expressing CDK2 sensor in CAMs for 24hrs. SHG signal displayed in grey, fibroblasts inred, cancer cells in green. Scale bar, 50μm. Top right panel: Western blot for type III collagen and tubulin comparing fibroblasts +/−shCOL3A1. Bottom right panel: Percentage of D-HEp3 cells in each phase of the cell cycle. (n= 4 CAMs per group, at least 5 images per CAM). Distributions were compared using a One-tailed Chi-squared test with 95% confidence interval.. (b) List of significantly dysregulated collagen genes in D-HEp3 nodules and T-HEp3 tumors grown in nude mice. Data represented as log2 fold change D-HEp3/T-HEp3 (related to Supplementary Table 2). (c) COL3A1 mRNA expression in different dormancy models. (HEp3 model n= 4 mice tumor in duplicates) and (D2 model n=3 independent RNA extraction for cultured cells in duplicates). Data were compared using unpaired two-tailed Mann-Whitney test with 95% confidence level. (d) Western blot for type III collagen and tubulin loading control in different dormancy models in vivo (CAMs). (e) Number of cells per tumors in CAM assays(siCTRL n= 21 CAMs, siCOL3A1 n= 24 CAMs, siCOL3A1 pool n= 11CAMs). Data were compared using unpaired two-tailed Mann-Whitney test with 95% confidence level. Representative image of CAM tumors 6 days after inoculation are displayed below. d refers to days on timeline scheme. (f) Western blot for type III collagen, phospho-histone H3 and tubulin comparing D-HEp3 +/− siCOL3A1. (g) Top panel: Representative multiphoton images of D-HEp3 siCTRL and siCOL3A1 disseminated in the lungs. Scale bar, 50μm, a 0.5 pixel radius minimum filter was applied to the green channel. Bottom panel: Percentage of cells in each phase of the cell cycle.(n=7 mice per group, at least 5 images per lung analyzed). Distributions were compared using a one-tailed Chi-square test with 95% confidence interval. d refers to days on timeline scheme. (h) Upper left panel: Representative CAMs tumors for each condition and Western blot for COL3A1, phospho-Histone H3 and tubulin. Upper right panel: number of T-HEp3 expressing CDK2 sensor and dox-inducible human COL3A1 cells per CAM tumor +/− doxycycline treatment. (n=9 CAMs per group) Data were compared using unpaired two-tailed Mann-Whitney test with 95% confidence level. Lower panel: Representative images of the different conditions are displayed, Scale bar, 20 μm. d refers to days on timeline scheme.(i) Top panel: Representative SHG images and OrientationJ software’s visual output obtained for each condition. Images extracted from tumors grown on CAMs. Scale bars, 100μm. More colors = less alignment. Color Scale bars represent fiber orientation. Lower panel: Normalized distribution of collagen fiber orientation. (n= 3 tumor per group, siCTRL n= 14 images, si COL3A1 n=12 images, siCOL3A1 pool n=15 images). Cumulative distributions were compared using an unpaired two-tailed Kolmogorov-Smirnov test with 95% confidence level.
Fig. 5.
Fig. 5.. DDR1 is required to sustain dormancy
All numerical data are presented as mean +/−SEM. (a) Adhesion assay of D-HEp3 and T-HEp3 on type I, III and IV collagens. (n= 3 independent experiment with triplicates). Data were compared using unpaired two-tailed Mann-Whitney test with 95% confidence level. (b) Adhesion assay of D-HEp3 expressing an shRNA control or targeting COL3A1 on type III collagen. (n= 3 independent experiment with triplicates). Data were compared using unpaired two-tailed Mann-Whitney test with 95% confidence level. (c) Western blot for DDR1 and tubulin, on D-HEp3 expressing an shRNA control or targeting COL3A1. (d) Western blot for DDR1 and tubulin from different dormancy models. (e) Upper panel: Number of D-HEp3 cells per CAM tumors(si CTRL n= 24 CAMs, siDDR1#1 n=10 CAMs, si DDR1#2 n=12 CAMs)Data were compared using unpaired two-tailed Mann-Whitney test with 95% confidence level. Lower panel: Representative images of tumors for each condition and Western blot showing DDR1, DDR2 and tubulin levels upon DDR1 depletion. (f) Left panel: Representative multiphoton images of D-HEp3 shRNA CTRL and shDDR1 disseminated in the lungs. Scale bar, 50μm. A 0.5 pixel radius minimum filter was applied to the green channel. Right panel: Representative images of lungs and inserts show macrometastases in 60% of the shDDR1 group. d refers to days on timeline scheme. (g) Western blot for phospho-histone H3 and tubulin, on D-HEp3 expressing an shRNA control or targeting DDR1. (h) Upper panel: Number of D-HEp3 cells per CAM tumor (n= 4 CAM tumors per group). Data were compared using unpaired two-tailed Mann-Whitney test with 95% confidence level. Lower panel : Western blot for DDR1 and tubulin. (i) Adhesion assay to collagen I, III or IV of D-HEp3 expressing a control sgRNA (NT) or an sgRNA against DDR1. (n= 3 independent experiment with triplicates).Data were compared using a one-tailed two-way ANOVA with mixed model effects analysis and a Bonferroni correction and a 95% confidence interval (j) Right panel: Number of T-HEp3 cells per CAM tumor (+EV n= 10 CAMs, +DDR1b n=13 CAMs). Data were compared using unpaired two-tailed Mann-Whitney test with 95% confidence level. Left panel: Western blot for DDR1, DDR2 and tubulin and representative CAM tumors.d refers to days on timeline scheme. (k) Top panel:Representative SHG images of ECM of D-HEp3 mice tumors +/−shDDR1. Scale bar, 100μm. Distribution of fiber orientation of each analyzed sample. (n= 5 tumors per group2 images analyzed per tumor). Cumulative distributions were compared using an unpaired two-tailed Kolmogorov-Smirnov test with 95% confidence level. (l) Left panel: Relative collagen abundance of tumor-derived collagens identified in D-HEp3 +/− shDDR1 tumors. Related to Supplementary Table 3. Right panel: Representative immunofluorescence onD-HEp3 +/− shRNA DDR1 mice tumors. (n=3 tumors stained) Scale bar, 50μm. (m) COL3A1 mRNA expression from D-HEp3 tumors (n=3 independent RNA extractions from 3 different tumors in duplicates). Data were compared using unpaired two-tailed Mann-Whitney test with 95% confidence level.
Fig. 6.
Fig. 6.. A DDR1/STAT1 pathway regulates dormancy and COL3A1 expression
All numerical data are presented as mean +/−SEM. (a) Transcription factors significantly dysregulated between T-HEp3 and D-HEp3 and significantly downregulated in D-HEp3 shDDR1 compared with D-HEp3 shRNA CTRL. Values represent average read counts. Color scales range from dark blue (lowest value) to dark red (highest value) per line (n= 3 tumors per group). Related to Supplemental tables 5 and 6. (b) Map of predicted sites for transcription factors identified above in COL3A1 promoter using the CiiiDER tool. (c) COL3A1 mRNA expression from D-HEp3 +/− si against the different transcription factors (n=3 independent RNA extractions from 3 different tumors in duplicates). Data were compared using unpaired two-tailed Mann-Whitney test with 95% confidence level. (d) Left panel: Number of D-HEp3 cells per CAM tumor +/− siSTAT1 (si CTRL n= 9 CAMs, siSTAT1 n= 13 CAMs) Data were compared using unpaired two-tailed Mann-Whitney test with 95% confidence level. Right panel: Western blot for STAT1, DDR1 and tubulin expression. (e) Left panel: Number of D-HEp3 cells per CAM tumor +/− Fludarabine (DMSO n= 11 CAMs, Fludarabine n= 13 CAMs). Data were compared using unpaired two-tailed Mann-Whitney test with 95% confidence (f): Representative multiphoton images of D-HEp3 siCTRL and siSTAT1 disseminated in the lungs. Scale bar 50μm. A 0.5 pixel radius minimum filter was applied to the green channel.d refers to days on timeline scheme. (g)Upper panel: number of cells with nuclear pSTAT1 per field. (n= 8 fields of view, 155 cells counted on glass and 87 cells counted on type III collagen). Data were compared using unpaired two-tailed Mann-Whitney test with 95% confidence level. Lower panel: Immunofluorescence of phospho-STAT1 in D-HEp3 plated either on glass or on Type III collagen. Scale bar 10μm. (h) Representative images of D-HEp3 stably expressing H2B-RFP and transfected with a STAT1-GFP plasmid and seeded on CAMs with DPBS or type III collagen (1.5mg/ml) for 3 days. (n= 3 CAMs, at least 5 images per egg). Scale bar, 20 μm. d refers to days on timeline scheme. (i) Top panel: Representative SHG images of control and siRNA STAT1 CAM tumors. Scale bar, 100μm. Bottom panel: Normalized distribution of collagen fiber orientation from CAM tumors. (sictrl n=9 images from 4 independent CAMs, siSTAT1 n= 12 images from 4 independent CAMs) Cumulative distributions were compared using an unpaired two-tailed Kolmogorov-Smirnov test with 95% confidence level. (j) Working model: ECM architecture dynamically changes between dormant and proliferative tumors. The ECM around dormant cells is characterized by a wavy collagen matrix that reorganizes into a highly aligned matrix upon dormant cell awakening. Dormant cell ECM is enriched in type III collagen that contributes towards establishing the non-linear collagen ECM architecture around dormant cells. DDR1 binding to type III collagen activates STAT1 signaling to activate dormancy and increases COL3A1 expression in DTCs, establishing a pro-dormant ECM niche.

Comment in

References

    1. Steeg PS Targeting metastasis. Nature Reviews Cancer (2016) doi: 10.1038/nrc.2016.25. - DOI - PMC - PubMed
    1. Sosa MS, Bragado P & Aguirre-Ghiso JA Mechanisms of disseminated cancer cell dormancy: an awakening field. Nat. Rev. Cancer 14, 611–622 (2014). - PMC - PubMed
    1. Linde N, Fluegen G & Aguirre-Ghiso JA The Relationship Between Dormant Cancer Cells and Their Microenvironment. Advances in Cancer Research vol. 132 (Elsevier Inc., 2016). - PMC - PubMed
    1. Giancotti FG Review Mechanisms Governing Metastatic Dormancy and Reactivation. Cell 155, 750–764 (2013). - PMC - PubMed
    1. Holmgren L, O’Reilly MS & Folkman J Dormancy of micrometastases: balanced proliferation and apoptosis in the presence of angiogenesis suppression. Nat. Med 1, 149–153 (1995). - PubMed

Publication types

Substances