. 2022 Jan;3(1):122-133.
doi: 10.1038/s43018-021-00301-w. Epub 2021 Dec 24.

Three-dimensional imaging mass cytometry for highly multiplexed molecular and cellular mapping of tissues and the tumor microenvironment

Collaborators, Affiliations

Three-dimensional imaging mass cytometry for highly multiplexed molecular and cellular mapping of tissues and the tumor microenvironment

Laura Kuett et al. Nat Cancer. 2022 Jan.

Abstract

A holistic understanding of tissue and organ structure and function requires the detection of molecular constituents in their original three-dimensional (3D) context. Imaging mass cytometry (IMC) enables simultaneous detection of up to 40 antigens and transcripts using metal-tagged antibodies but has so far been restricted to two-dimensional imaging. Here we report the development of 3D IMC for multiplexed 3D tissue analysis at single-cell resolution and demonstrate the utility of the technology by analysis of human breast cancer samples. The resulting 3D models reveal cellular and microenvironmental heterogeneity and cell-level tissue organization not detectable in two dimensions. 3D IMC will prove powerful in the study of phenomena occurring in 3D space such as tumor cell invasion and is expected to provide invaluable insights into cellular microenvironments and tissue architecture.


Conflict of interest statement

Competing interests

The authors declare no competing interests.

Figures

Extended Data Fig. 1
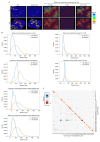
Extended Data Fig. 1. A comparison of 95°C and 80°C heat-induced antigen retrieval for consecutive 2-μm slices from a breast cancer sample (Methods).
(a) Signal-to-noise ratio was calculated based on the ratio of metal ion counts within a rough 2D nuclear segmentation mask to background signal for 2um-thick consecutive slices from the same breast cancer sample (n = 1) that either underwent antigen retrieval at 80 °C for 80 minutes (7 slices) or at 95°C for 30 minutes (5 slices) as part of a one experiment. The first five consecutive images are shown in c) and d). The experiment also included a second independent sample (data not shown). (b) Antibody clones used for antigen retrieval comparison. (c) and (d) Overlays of the pairwise consecutive slices aligned with affine transformation after antigen retrieval at c) 80 °C (images shown for the first 5 slices) and d) 95 °C (images shown for all the slices). Green and magenta indicate two consecutive slices, and white shows overlapping region. Overlapping images were visualized in ImageJ2.
Extended Data Fig. 2
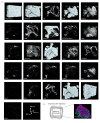
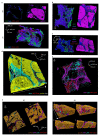
Extended Data Fig. 2. Single-channel marker expression in a breast carcinoma 3D IMC model.
Raw data voxel rendering of different channels for a breast carcinoma 3D IMC model. AGAVE 1.0.0.1 was used for 3D rendering of the data. (b) The final model size is chosen to ensure that the 3D volume is generated from an area that overlaps between all the slices in the stack.
Extended Data Fig. 3
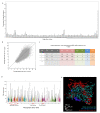
Extended Data Fig. 3. Evaluation of the 3D single cell segmentation for a breast carcinoma 3D IMC model.
All panels show data from the same breast carcinoma sample shown in Figs. 1 and 2. (a) Percentage of objects occurring only on one slice for the full 152-slice stack after 3D segmentation to evaluate if the final cell masks were affected by the intensity variation between the consecutive slices. (b) Average axis length for each segmented object in x-y plane and in y-z plane. The z axis was calculated with 2-μm resolution. Axis length was calculated as the averages of minor and major axes using skimage.mesure.regionprops function. (c) Schematic showing the application of multiple methods to augment and annotate the catalog (N cells, M channels). The data table includes cluster identifiers and dimensionality reduction coordinates. Topographic information such as distance to a particular structure can be calculated by combining the 3D mask with other calculated masks, for instance, the distance to closest blood vessel. (d) Cell volumes calculated as total number of voxels for each segmented object for each cell cluster identified by Phenograph. (e) Distribution of CD68 + clusters with cluster 28 in green and cluster 30 in blue, and cluster 21 in red (endothelial cells). AGAVE 1.0.0.1 was used for 3D rendering of the data.
Extended Data Fig. 4
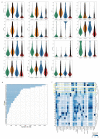
Extended Data Fig. 4. Evaluation of a second breast carcinoma 3D IMC model.
(a) Left: Average marker expression (x axis) for each phenotypic cluster (y axis) after measuring the raw data for each segmented cell and clustering cells using Phenograph. Marker expression data for each cell were calculated as the mean intensities of ion counts over the object mask. Cluster –1 are outlier cells identified during clustering. Before clustering, the data was range normalized to the 99th percentile. Right: Bar plot of the absolute cell counts for each cluster. (b) Percentage of objects occurring only on one slice for the full 92-slice stack after 3D segmentation. (c) Average axis length for each object in x-y plane and in y-z plane. The z axis was calculated with 2-μm resolution. Axis length was calculated as the average of minor and major axes using the skimage.mesure.regionprops function. (d) Cell volumes calculated as total number of voxels for each segmented object for each cell cluster identified by Phenograph.
Extended Data Fig. 5
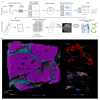
Extended Data Fig. 5. Analysis of putative invasive cells and single-cell level data for a breast cancer lymphovascular invasion model.
(a) Violin plots showing marker expression levels for putative panCK+ invasive cells compared to epithelial, basal and other cells in a HER2-positive ductal breast carcinoma model. (b) A bar plot showing the total number of cells from each cluster (Fig. 2b) in the immediate microenvironment of putative invasive cells in the breast carcinoma model. Microenvironment was defined as cells that are within 50 μm radius from any of the putative invasive cells. (c) Analysis of segmented cell-level data in a lymph vessel lymphovascular invasion model. Average marker expression (x axis) for each phenotypic cluster (y axis) after measuring the raw data for each segmented cell and clustering cells using Phenograph. Marker expression data for each cell were calculated as the mean intensities of ion counts over the object mask.
Fig. 1
Fig. 1. Experimental and computational workflow for 3D IMC.
a, Small rods or blocks of FFPE tissue are cut into 2-μm sections with an ultramicrotome and a modified diamond knife. Sequential sections were collected on regular microscopy slides. Typically, 20 to 40 sections were placed on each glass slide. After rehydration, tissues were subjected to antigen retrieval, followed by staining with metal-labeled antibodies. All sections were analyzed by IMC. Data were processed computationally to order sections according to the annotation. Images are aligned and cells are segmented with a 3D watershed algorithm. Finally, a full 3D model can be analyzed both at the voxel and cell level. b, Examples of raw data voxel rendering for the indicated markers in a representative example from one out of the two breast carcinoma 3D IMC models. AGAVE 1.0.0.1 was used for 3D rendering of the data.
Fig. 2
Fig. 2. Single-cell segmentation of a 3D IMC generated breast carcinoma model.
a, Segmentation and cell catalog generation pipeline. A voxel model is used as an input for a 3D watershed segmentation. Detected objects are assigned unique cell identifiers. Statistics for all channels and morphological descriptors are calculated for every segmented cell (N cells, M channels). b, Iridium signal from a single representative slice (no. 58 out of 152) from one out of the two breast carcinoma models used in this study, the same model is also displayed in Fig.1b (left). Segmentation mask overlay of the iridium channel (right). In the segmentation mask, different cells are labeled with random colors. c, Example of a full segmentation mask over the surface-rendered iridium channel in the same model (containing a total of 152 slices). Images were produced with napari v.0.4.1rc2 (ref. ).
Fig. 3
Fig. 3. Single-cell analysis of 3D IMC data in a breast carcinoma sample.
a, Heat map of an average marker expression (x axis) for each phenotypic cluster (y axis) after measuring the raw data for each segmented cell and clustering the cells using Phenograph from one out of the two breast carcinoma 3D IMC models used in this study (152 slices) (left). Marker expression data for each cell were calculated as the mean intensities of ion counts over the object mask. Colored bars indicate clusters corresponding to specific cell types, color coded as in c and d. Before clustering, data were range normalized to 99th percentile and z-scored for heat map visualization. Absolute cell counts for each cluster (right). b, 3D rendering of cells belonging to cluster 21 (endothelial cells), cluster 18 (CD8a+ T cells), cluster 25 (B cells) and cluster 30 (macrophages). c, 3D rendering of cells belonging to cluster 21 (vWF+CD31+), cluster 18 (CD8+, CD3+ and CD45+) and cluster 13 (CD8a, CD3+ and CD45+). d, Single-cell marker expression for CK5, CK19, CK8/18, HER2, CD44 and SMA for each individual cell, where each voxel for every cell is assigned its marker expression value. All renders in this figure are representative images from one of two breast cancer 3D IMC models and are displayed in the same orientation as in Fig. 1b. AGAVE 1.0.0.1 was used for 3D rendering of the data.
Fig. 4
Fig. 4. Distance measurement comparison for 3D versus 2D IMC.
a, Cell-to-vessel distance measurements for the representative slice 33 in the 2D image (top) and 3D reconstruction (bottom) of a breast carcinoma 3D model (as imaged in Figs. 1–3). vWF signals are shown (left to right) to mark vessels, the generated binary masks for vessels, the distance of each cell to the vessel mask in a heat-color scale and distances to the vessel mask of T cells and tumor cells in the same scale. Images were created with napari v.0.4.1rc2 (ref. ). b, Quantification of distance from a cell centroid to its closest point in the endothelial cell mask in 2D and 3D for the indicated cell phenotypes in the same model. c, Heat map showing the difference between 3D and 2D for the proportion of cluster types among the directly touching neighbors for each cluster across the same breast carcinoma model. For each cell in the model, the total number of times each cluster type was among the neighbors was counted, then these counts were aggregated per cluster by grouping the cells on the basis of cluster assignment. The proportion was calculated by dividing per-cluster counts by total number of neighbors that each cluster had across the whole model. For 2D, the directly touching neighbors were calculated for each slice and averaged cross the whole stack (152 slices). Finally, the difference was calculated by subtracting 2D proportions from 3D proportions.
Fig. 5
Fig. 5. 3D reconstructions reveal cellular and environmental relationships in tissues.
a, Raw data rendering in 2D and 3D of a tumor basal layer, showing expression of basal markers CK5 and SMA, and endothelial markers vWF and CD31 in one out of the two breast carcinoma 3D IMC models used in this study. The 2D slice is representative of 152 slices; the 3D rendering uses all of the 152 slices. The image has the same angle as images in Fig. 3b–d. b, Alternative angle of the same model showing raw data rendering of the indicated markers. c, Raw data voxel rendering of the second breast cancer 3D IMC model showing SMA, vWF, CD31, panCK and CD8a marker distributions. The white arrow indicates the angle of the model displayed on d and e. d, Raw data voxel renderings of the same breast carcinoma 3D IMC model as in c showing SMA, panCK, vWF, CD31, and CK5 marker distributions. e,f, Single-cell expression for the indicated markers in the same breast carcinoma model shown in c. Each voxel for every cell is assigned an expression value for each marker. Two representative 2D slices (out of 92) from the breast carcinoma model imaged in c and d, showing single-cell level expression for the indicated markers (f, left). Single-cell expression for panCK, SMA, vWF, CD31 and pS6 shown in a full 3D model for the breast carcinoma model analyzed in e and f and displayed through the z-dimensions cut at different x-planes of the model (f, right). The white arrow indicates the direction along which the model was cut and the white stars indicate the positions of the cuts. AGAVE 1.0.0.1 was used for 3D rendering of the data.
Fig. 6
Fig. 6. 3D IMC reveals potential invasion-associated phenomena.
a, A series of raw voxel data 3D renderings of ~40 μm stacks (20 slices) for panCK and CD20 from the breast carcinoma 3D IMC model that captured putative invasive cells (same model as displayed in Fig. 1). The white rectangle marks a protrusion in the surface of a ductal carcinoma in situ-like structure at 120 μm depth and marks tumor clusters at the same location. b, Full 3D raw data voxel rendering of panCK from the same model as a. The tumor cell clusters are shown within a white rectangle. c, Single-cell marker expression levels for CK5, panCK, HER2 and CK8/18 visualized by rendering over the 3D mask. Marker expression data for each cell was calculated as the mean intensity of ion counts over the object mask. d, A violin plot for pS6 expression levels in epithelial, basal and stromal cells in the immediate microenvironment (ME) of invasive cells and in cells of the same type in the whole tissue. ME was defined as cells that are within 50-μm radius from any of the putative invasive cells. e, A rendering of a raw data 3D IMC voxel model from one out of two pathologist-identified samples of lymphovascular invasion taken from the periphery of a breast tumors (left). Single-cell marker expression for the same model where each voxel for every cell is assigned its marker expression value for the indicated markers, including proliferating tumor cells (Ki-67) and apoptotic cells (positive for cleaved PARP and cleaved caspase 3) (right). f, Raw data 3D IMC voxel model of a pathologist-identified sample of lymphovascular invasion from a different breast tumor, out of the two such samples used in this study (left). Single-cell marker expression for the same model showing HER2+ tumor cells inside a lymph vessel in the center of the image and single E-cadherin+ cells inside blood vessels at the periphery of the image (right). AGAVE 1.0.0.1 was used for 3D rendering of the data.

Comment in

  • Tumor microenvironments in 3D.
    Mukhopadhyay M. Mukhopadhyay M. Nat Methods. 2022 Feb;19(2):138. doi: 10.1038/s41592-022-01402-9. Nat Methods. 2022. PMID: 35145315 No abstract available.

References

    1. Coutu D, Kokkaliaris K, Kunz L, Schroeder T. Multicolor quantitative confocal imaging cytometry. Nat Methods. 2018;15:39–46. - PubMed
    1. Li W, Germain RN, Gerner MY. Multiplex, quantitative cellular analysis in large tissue volumes with clearing-enhanced 3D microscopy (Ce3D) Proc Natl Acad Sci USA. 2017 doi: 10.1073/pnas.1708981114. - DOI - PMC - PubMed
    1. Mano T, et al. Whole-brain analysis of cells and circuits by tissue clearing and light-sheet microscopy. J Neurosci. 2018 doi: 10.1523/JNEUROSCI.1677-18.2018. - DOI - PMC - PubMed
    1. Gerdes MJ, et al. Highly multiplexed single-cell analysis of formalin-fixed, paraffin-embedded cancer tissue. Proc Natl Acad Sci USA. 2013;110:11982–11987. - PMC - PubMed
    1. Gerdes MJ, et al. Single-cell heterogeneity in ductal carcinoma in situ of breast. Mod Pathol. 2018;31:406–417. - PMC - PubMed

Publication types