. 2021 Aug;2(8):803-818.
doi: 10.1038/s43018-021-00227-3. Epub 2021 Jul 19.

Castration-mediated IL-8 promotes myeloid infiltration and prostate cancer progression

Affiliations

Castration-mediated IL-8 promotes myeloid infiltration and prostate cancer progression

Zoila A Lopez-Bujanda et al. Nat Cancer. 2021 Aug.

Abstract

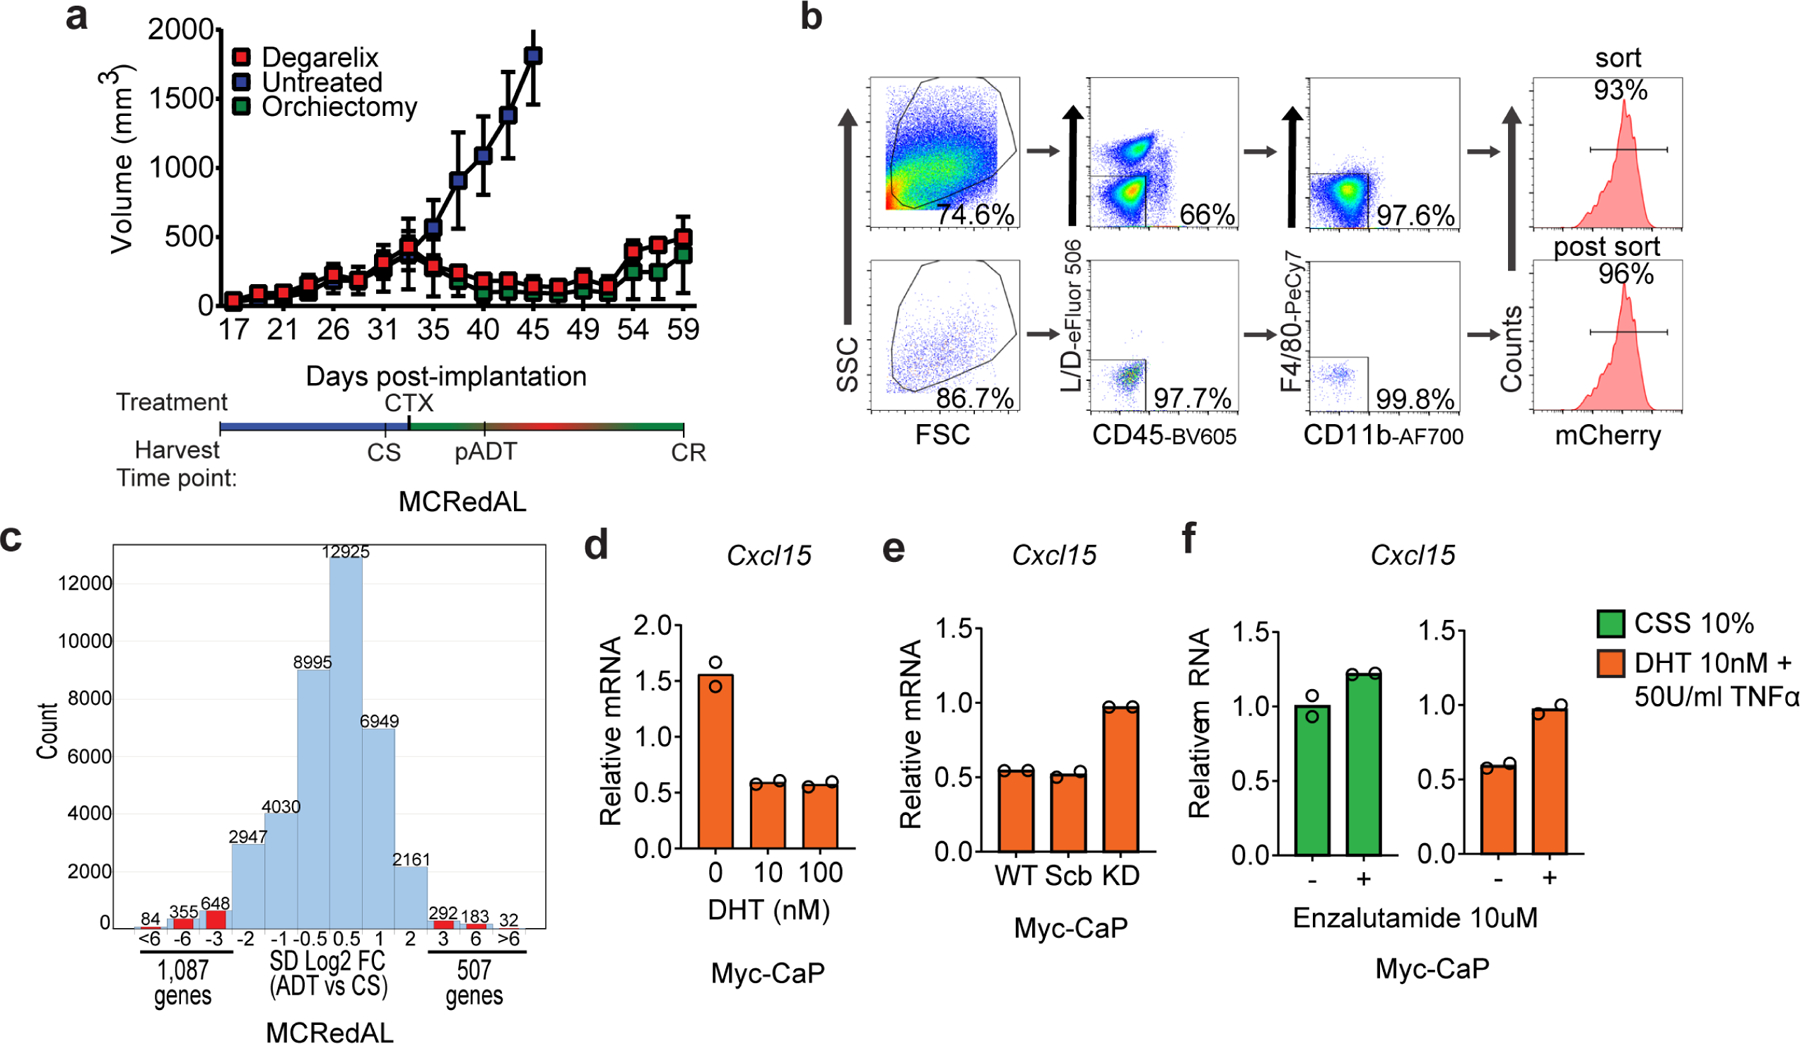
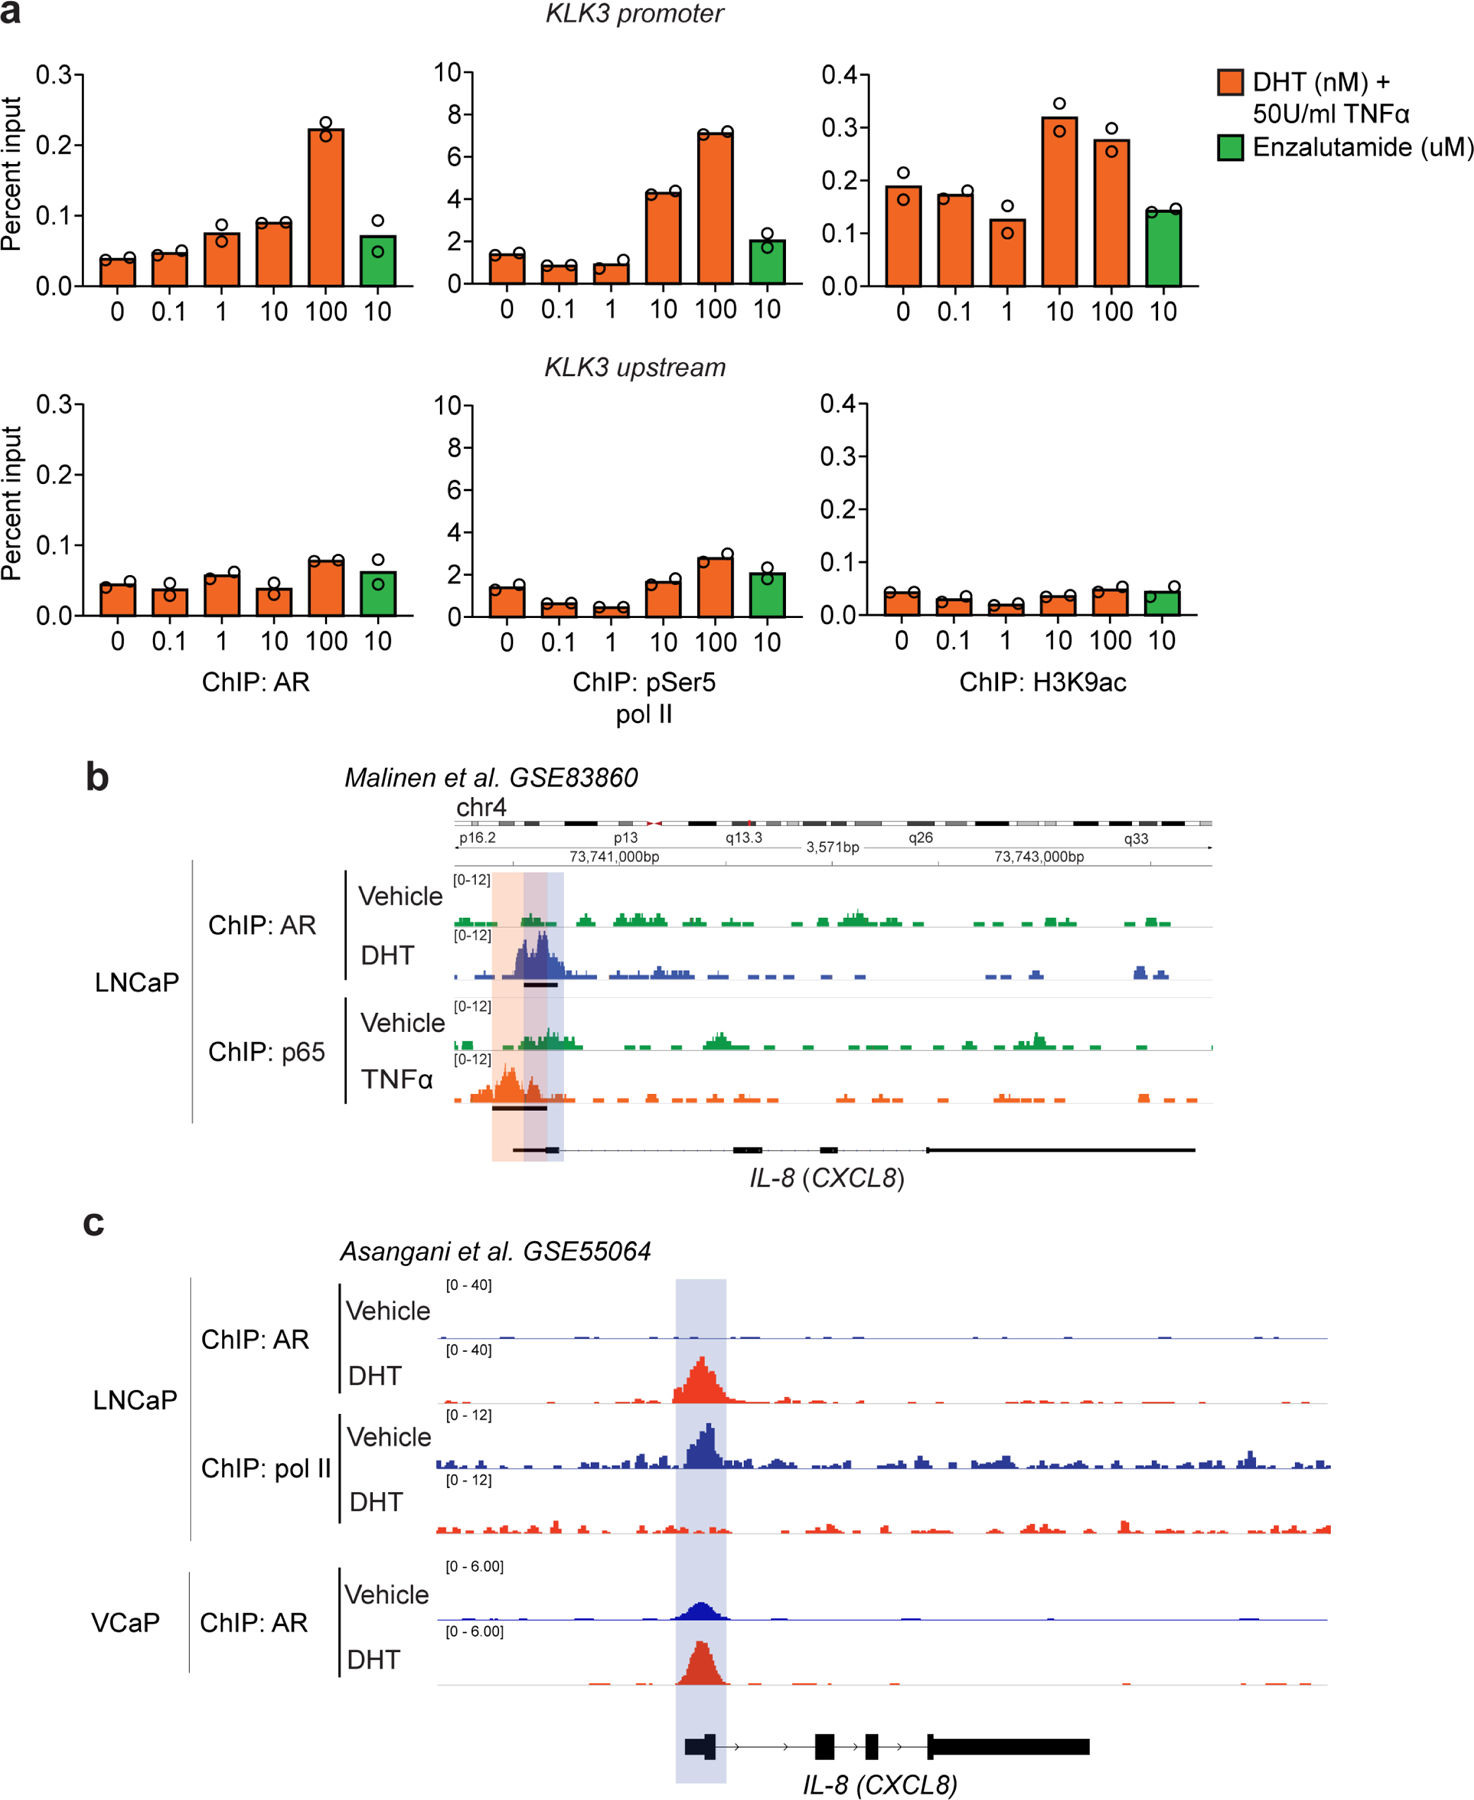
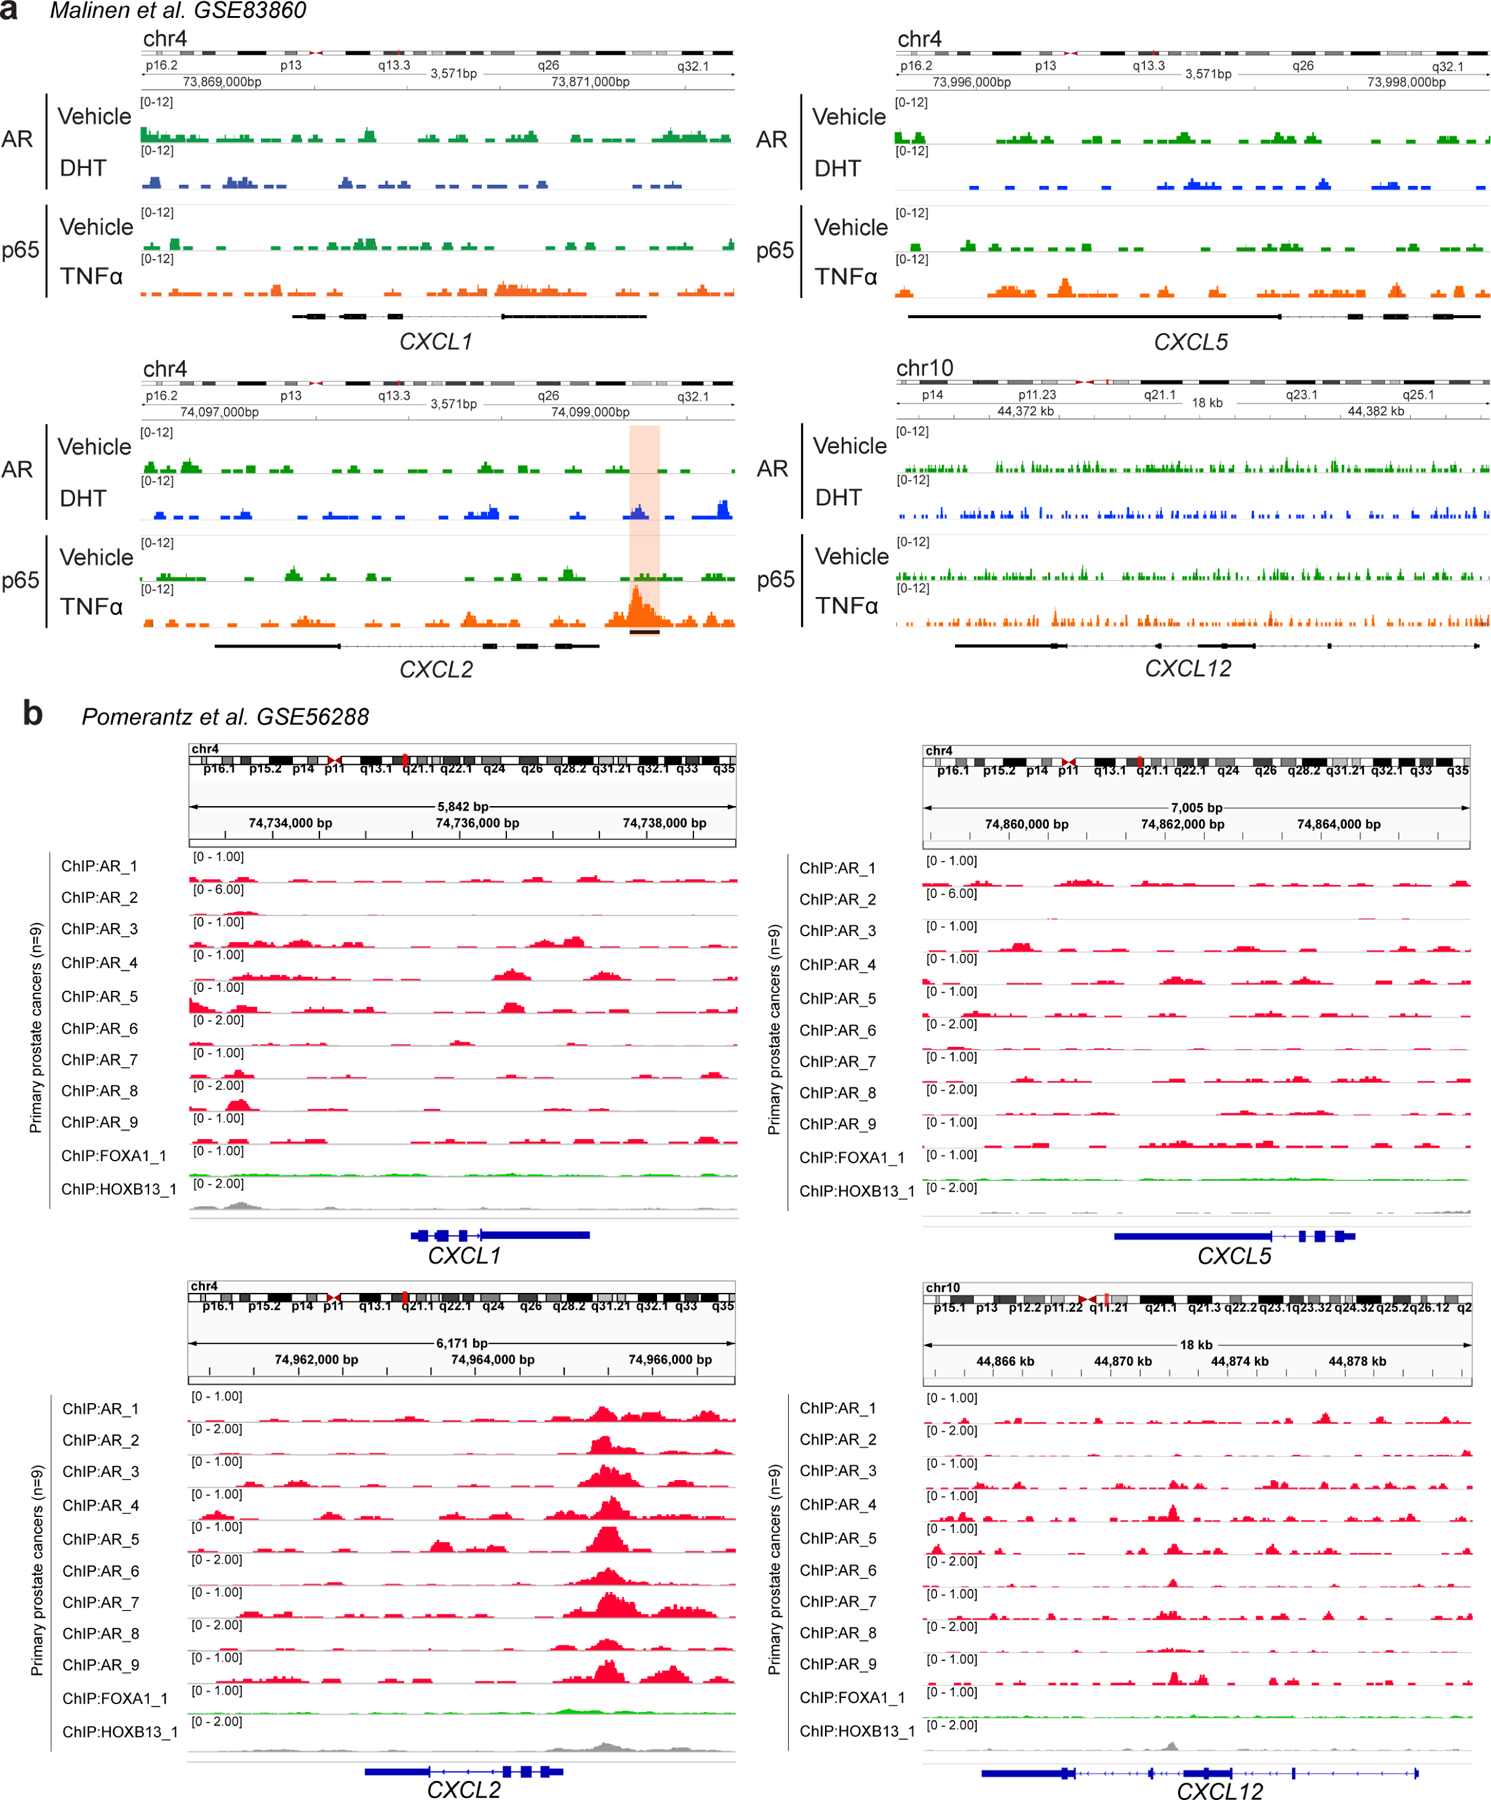
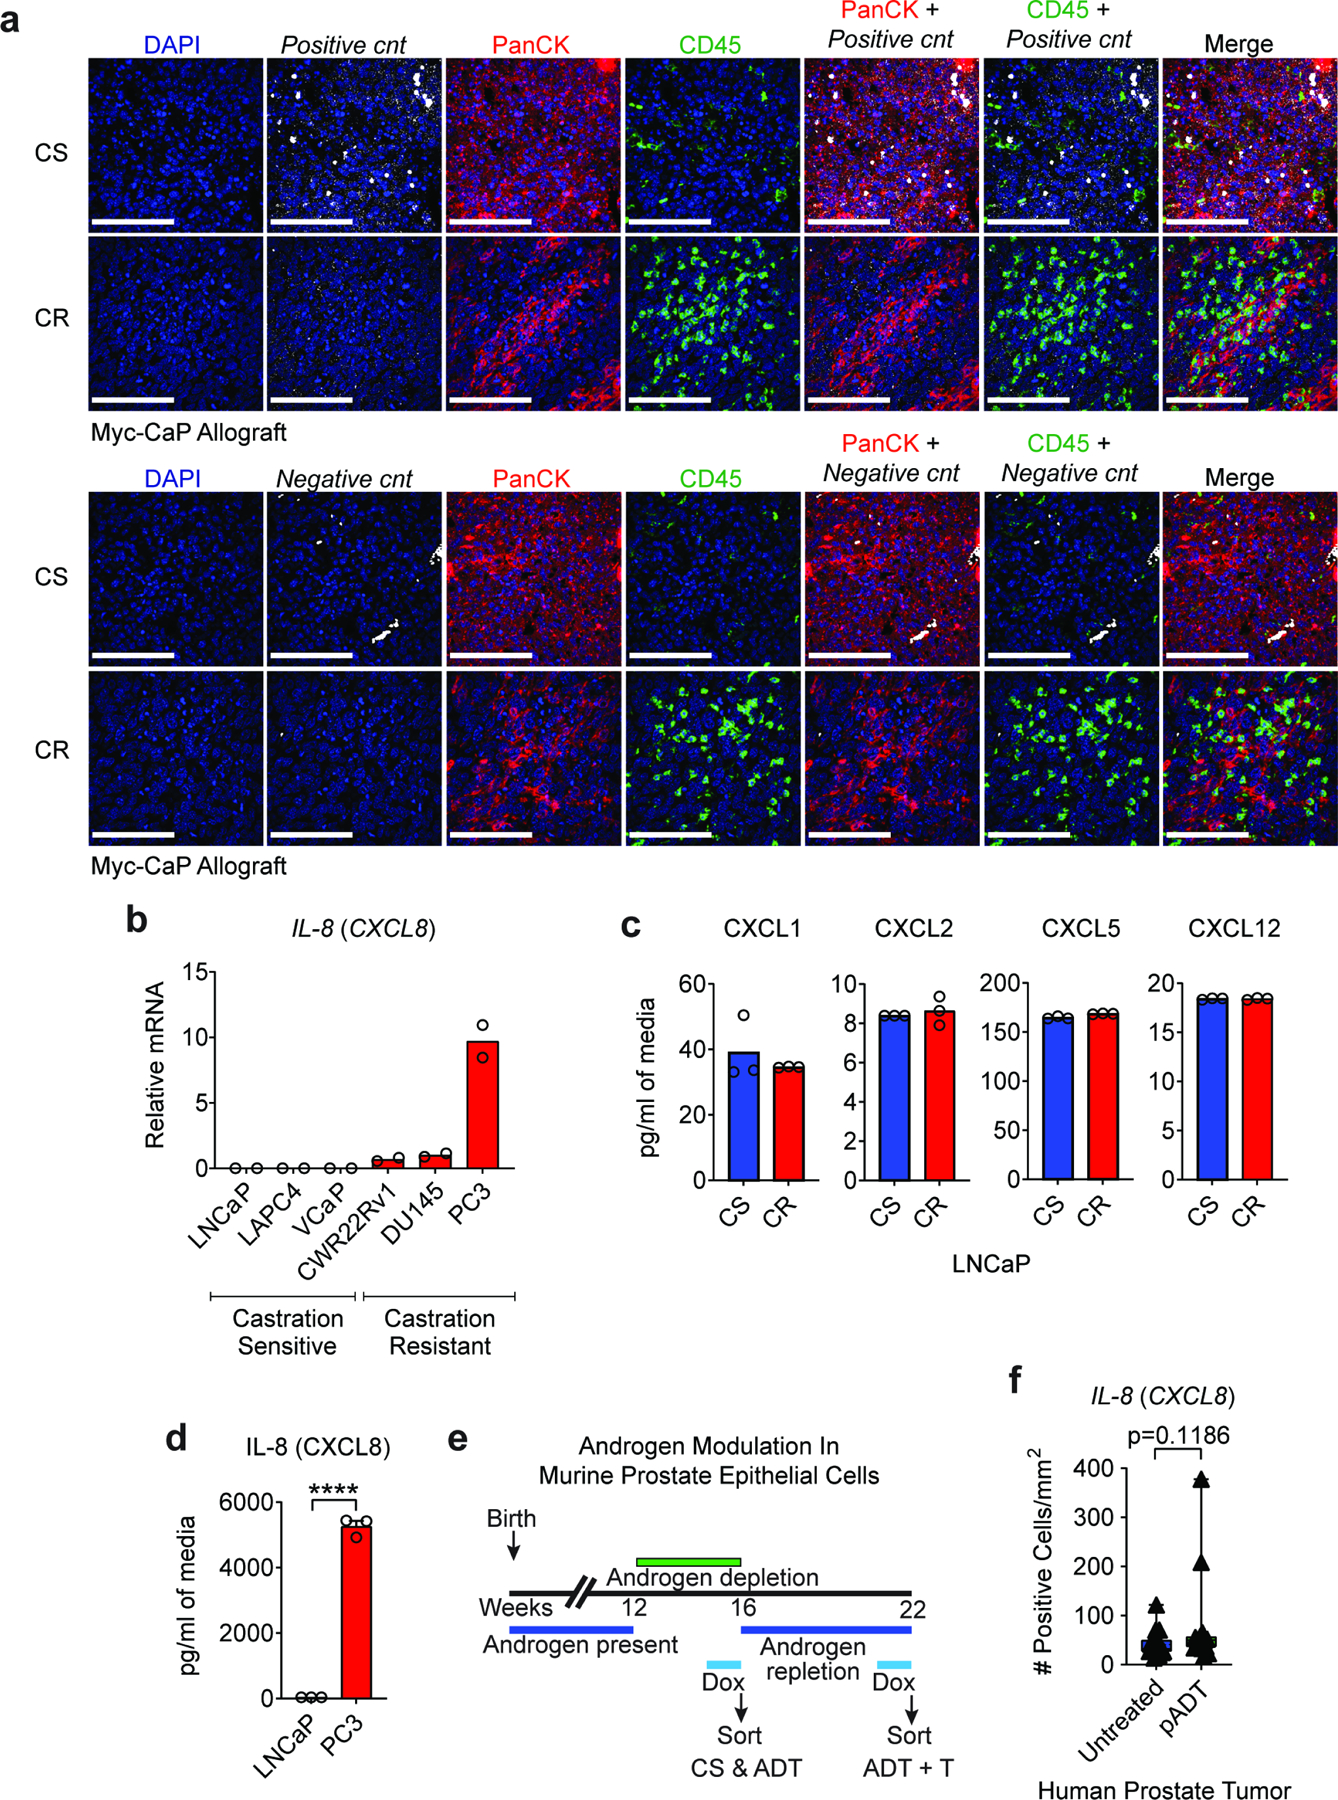
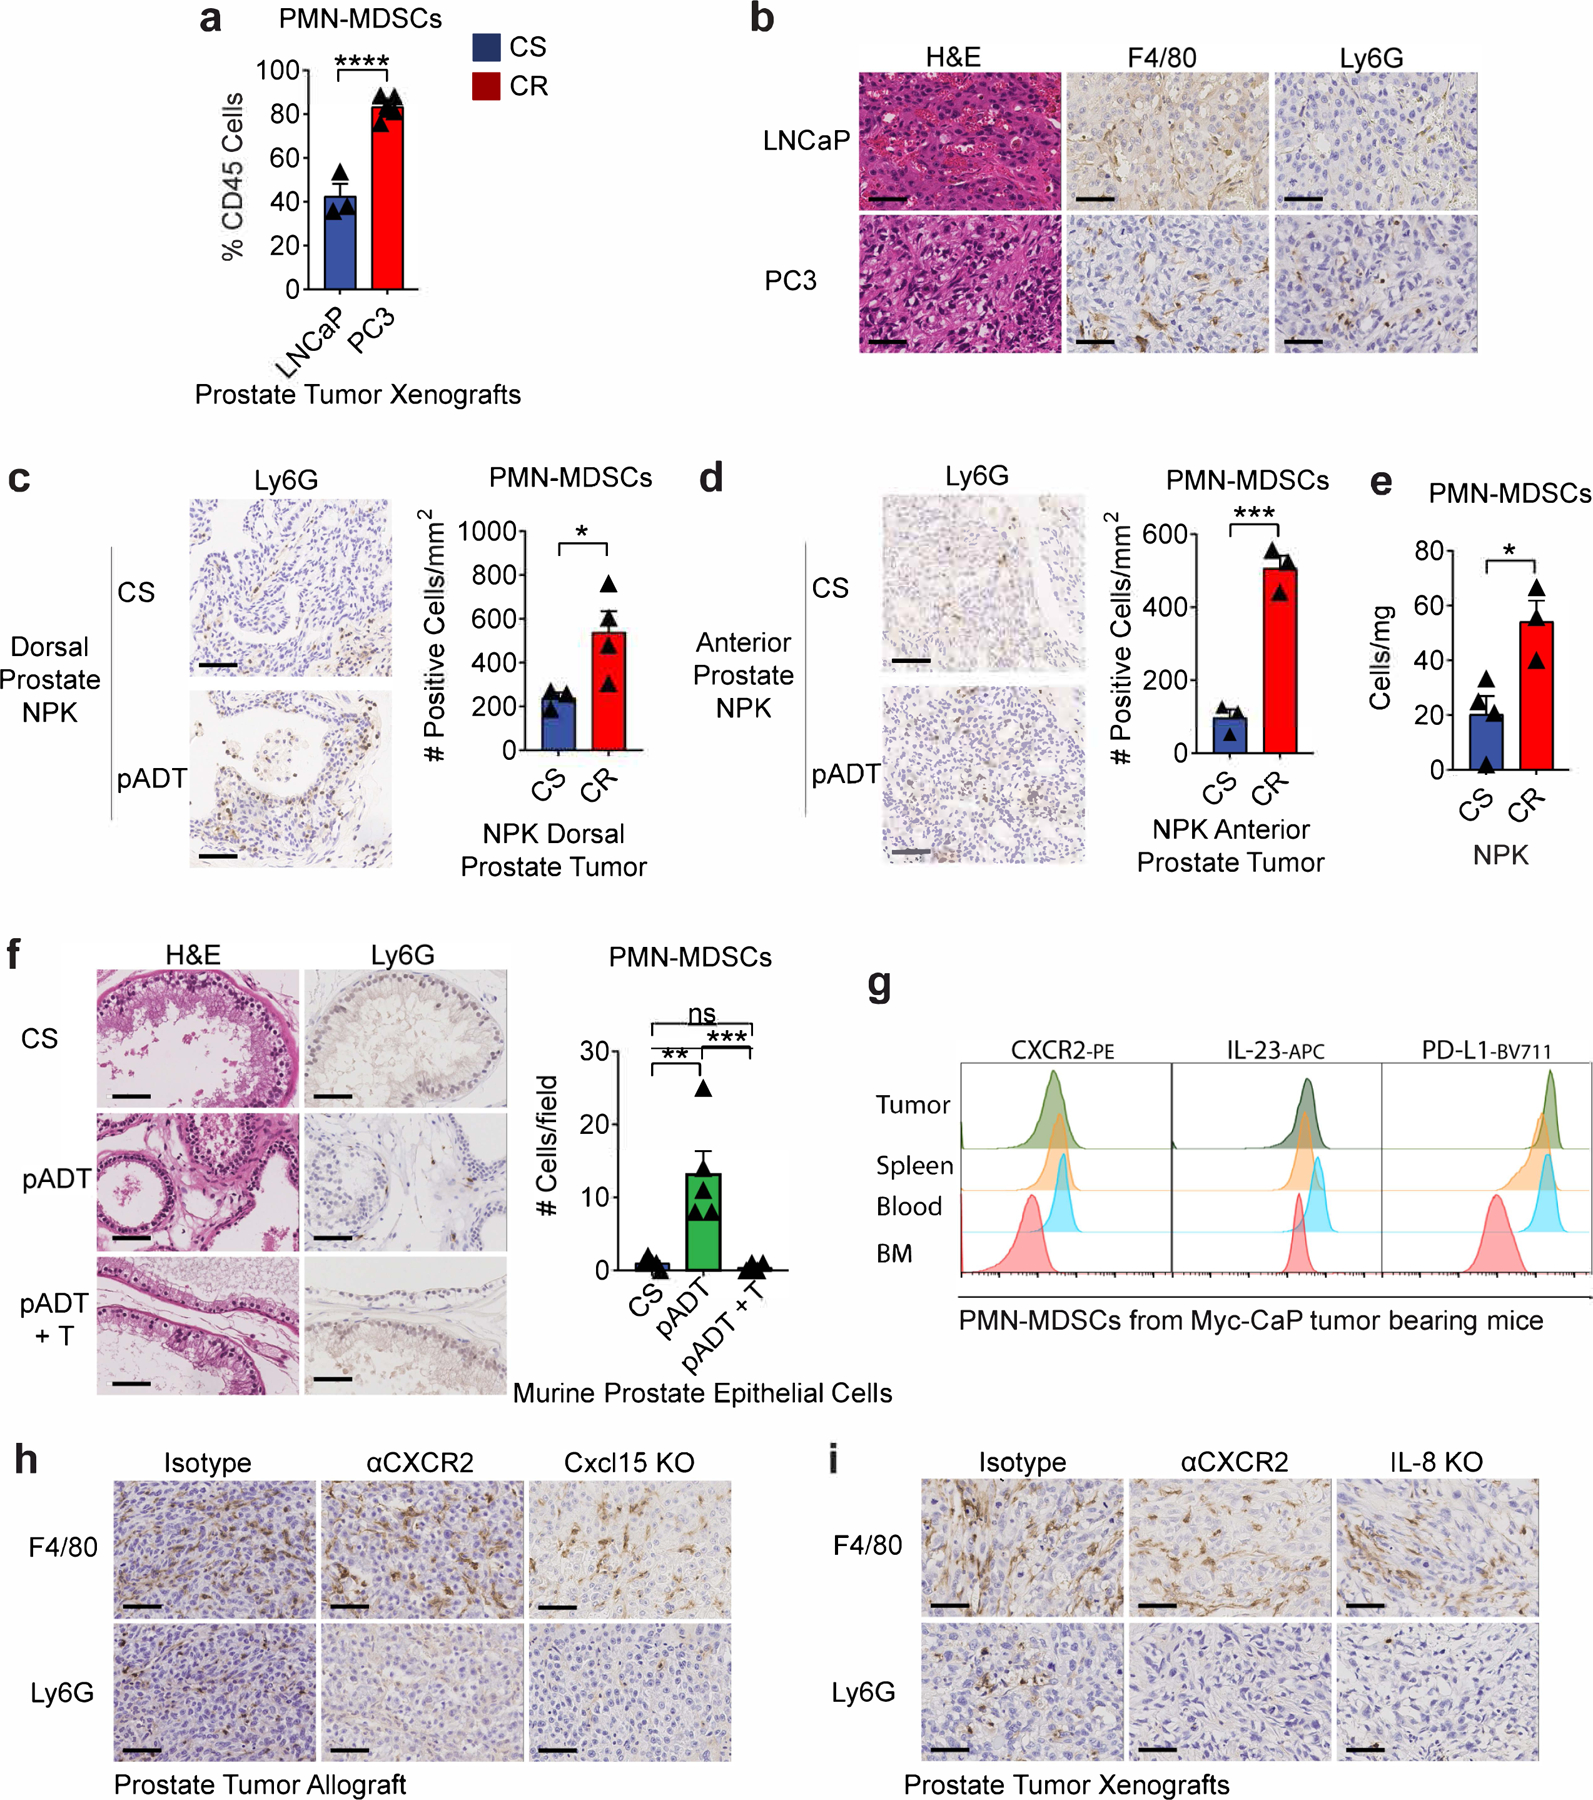
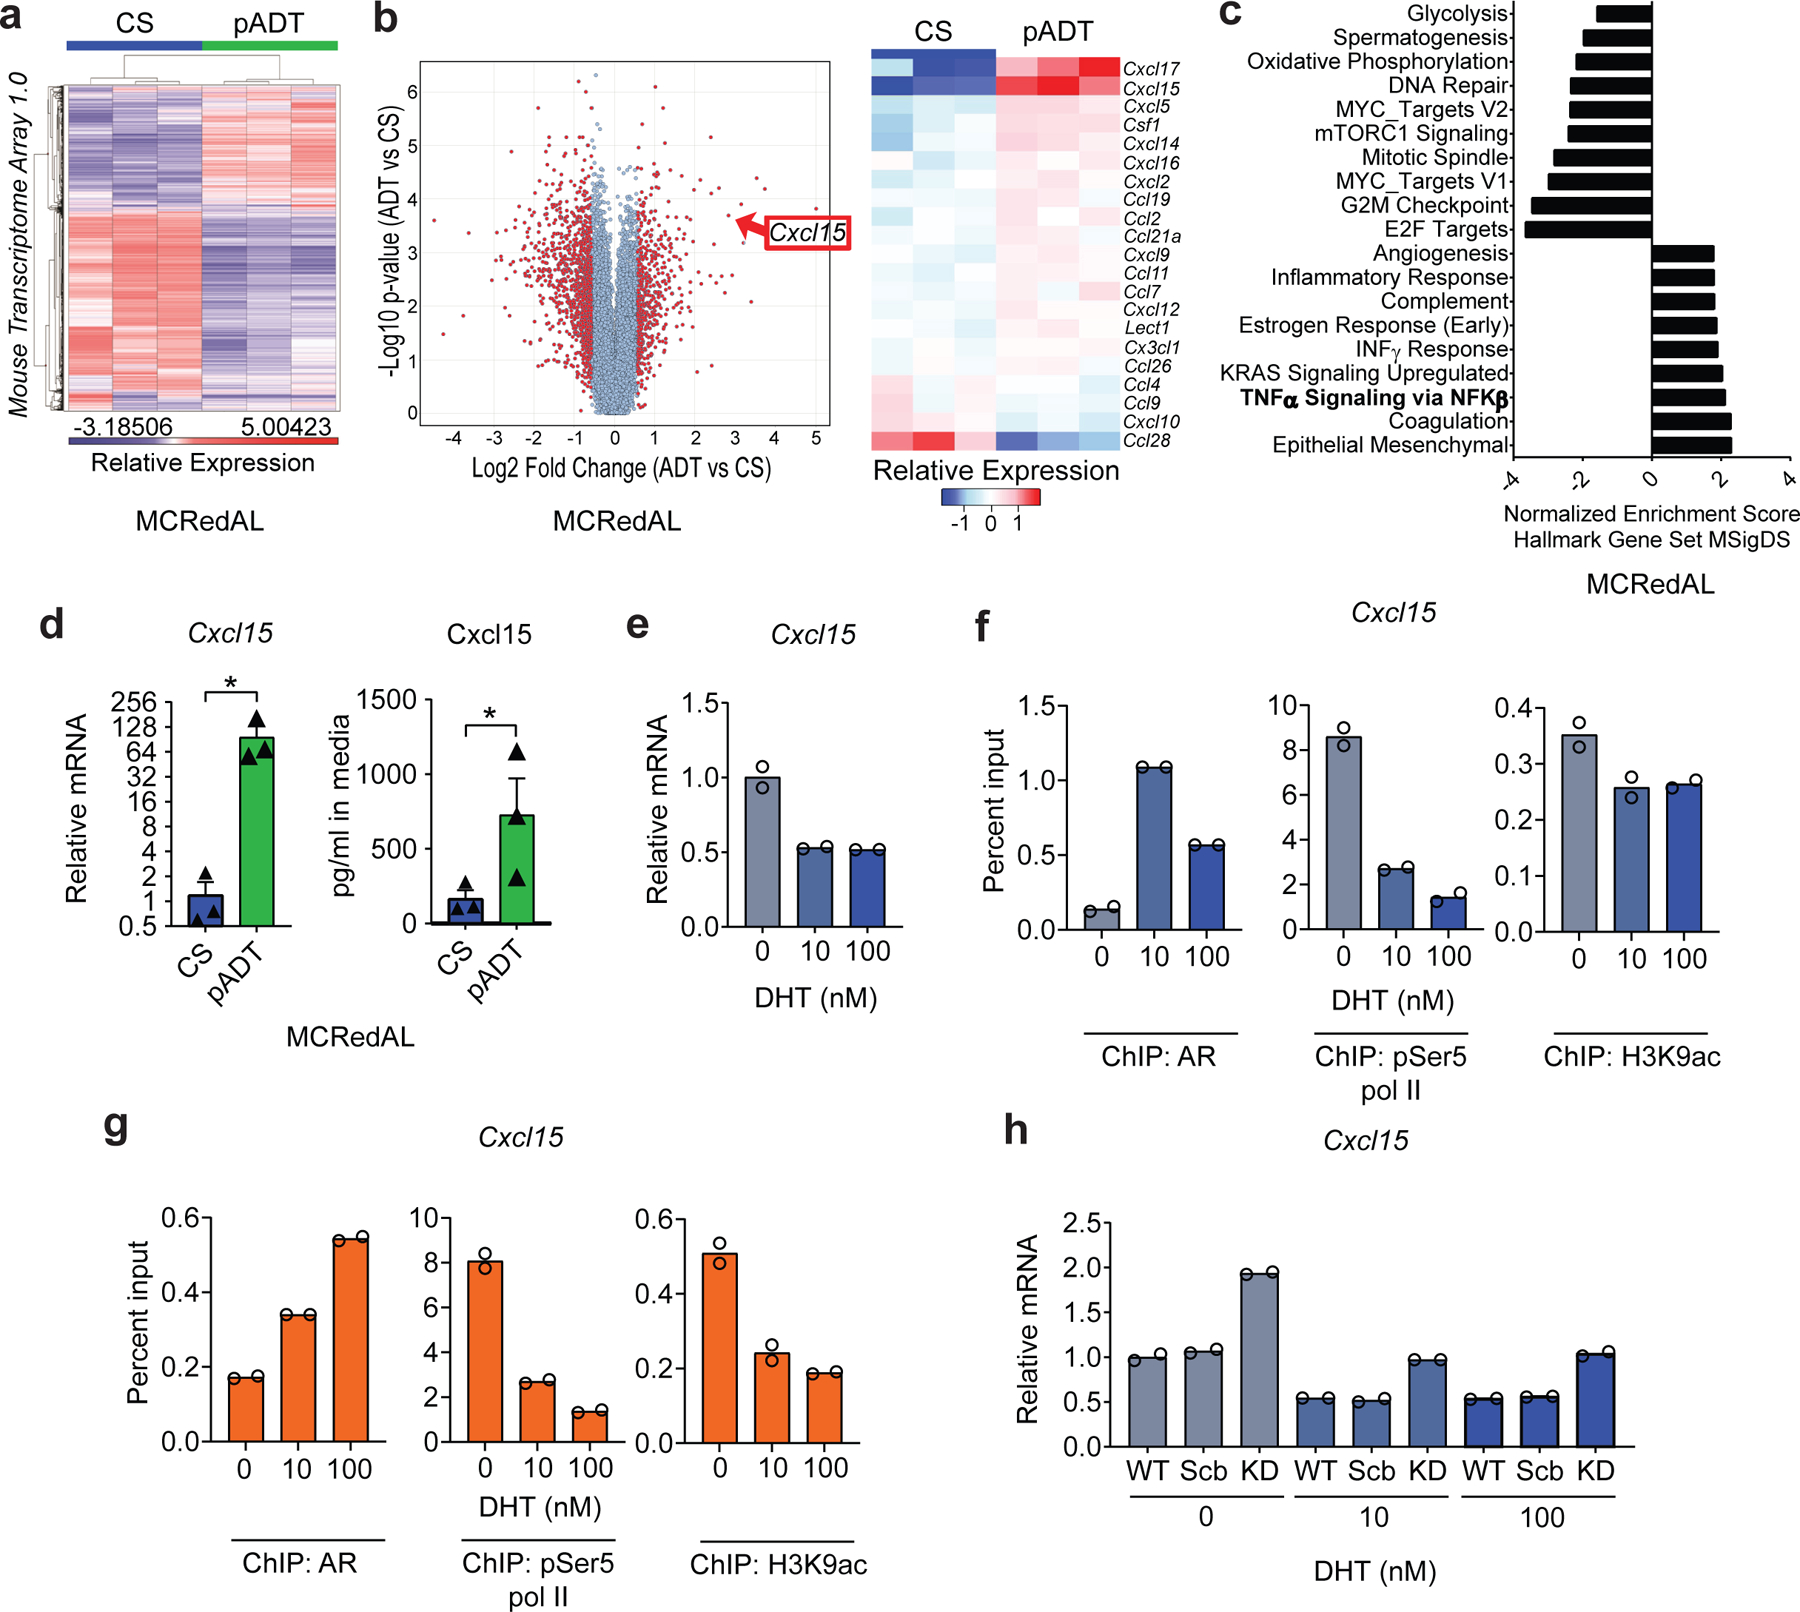
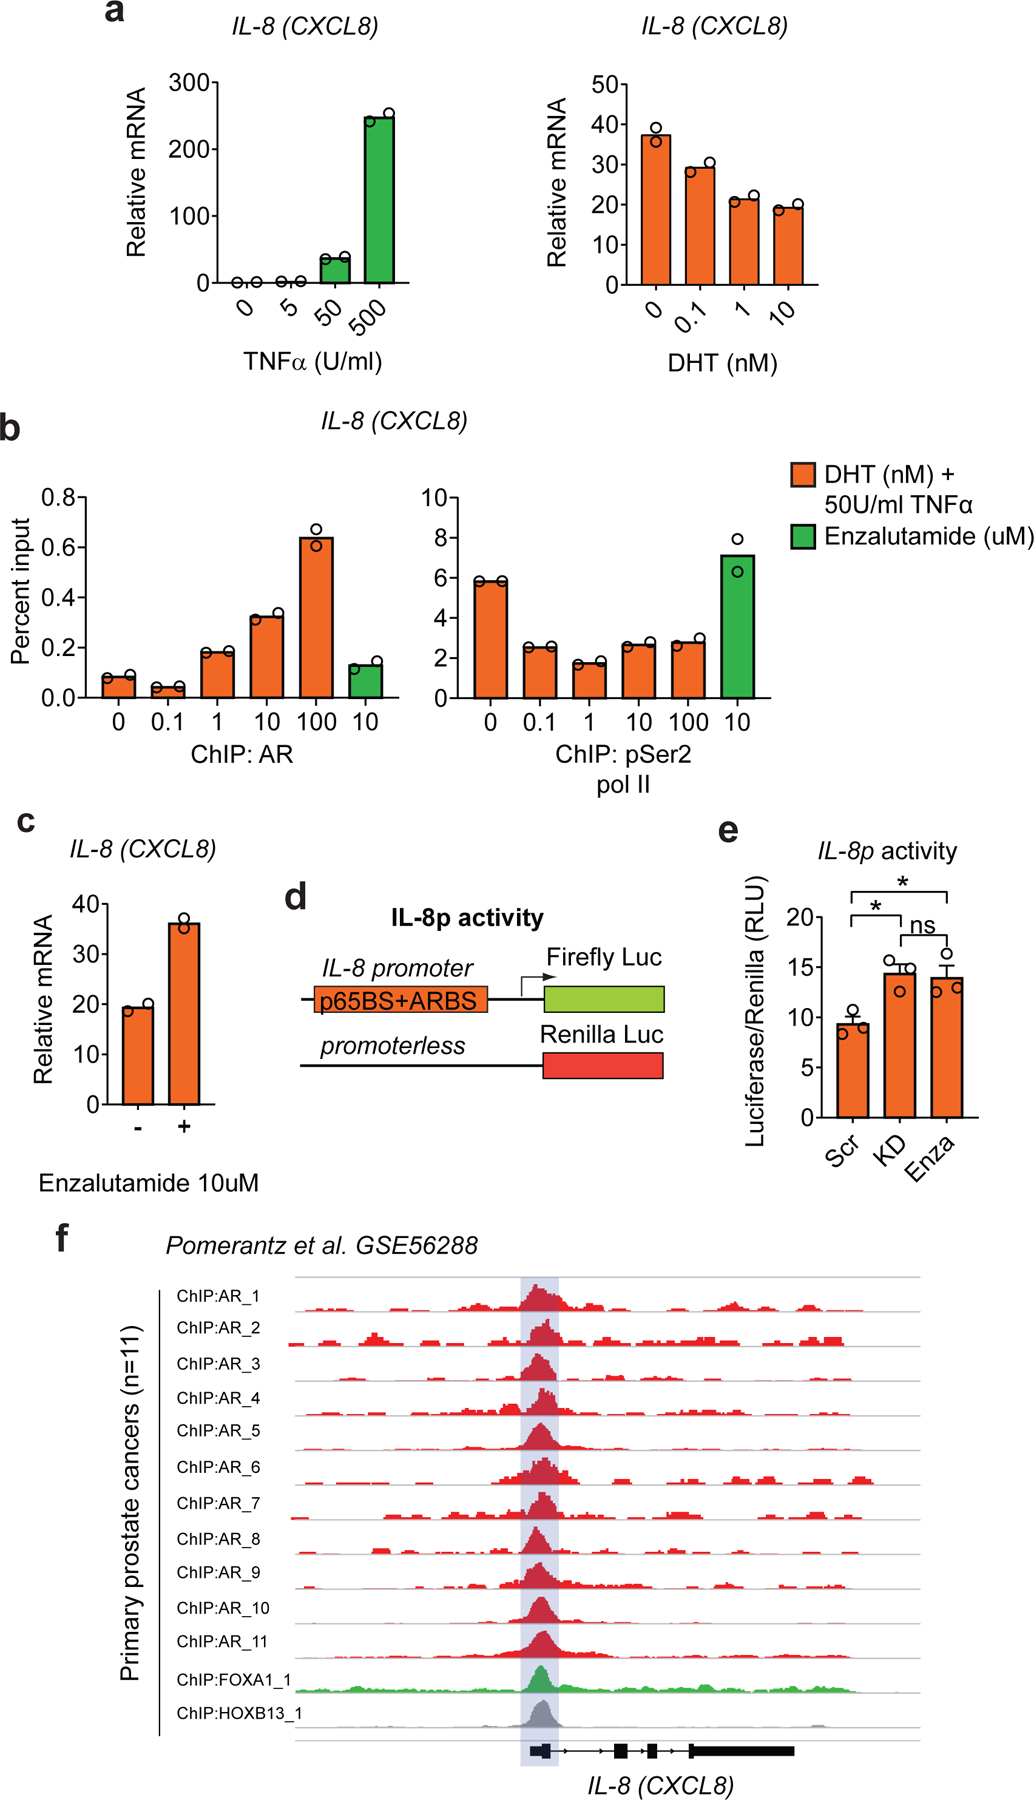
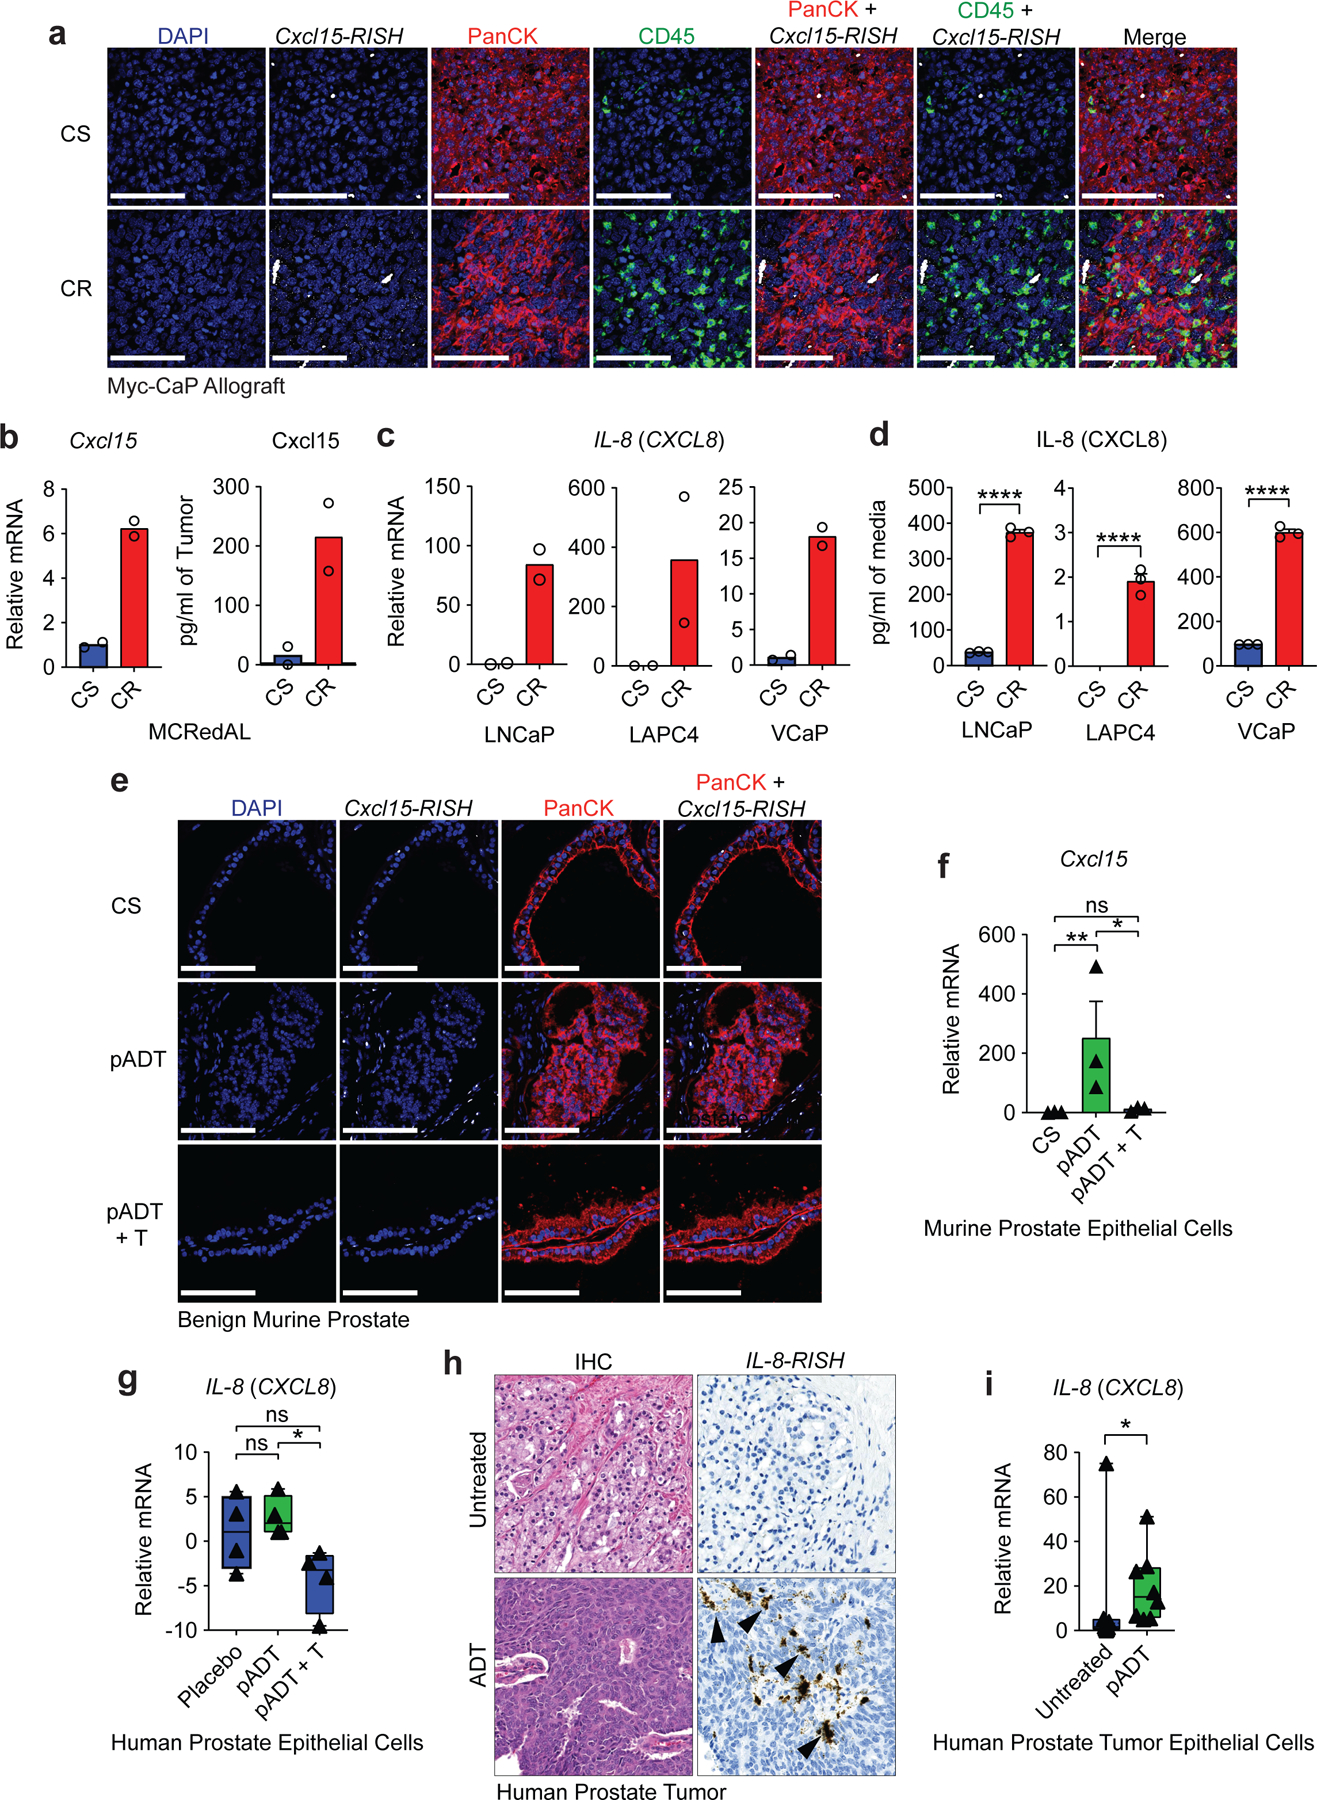
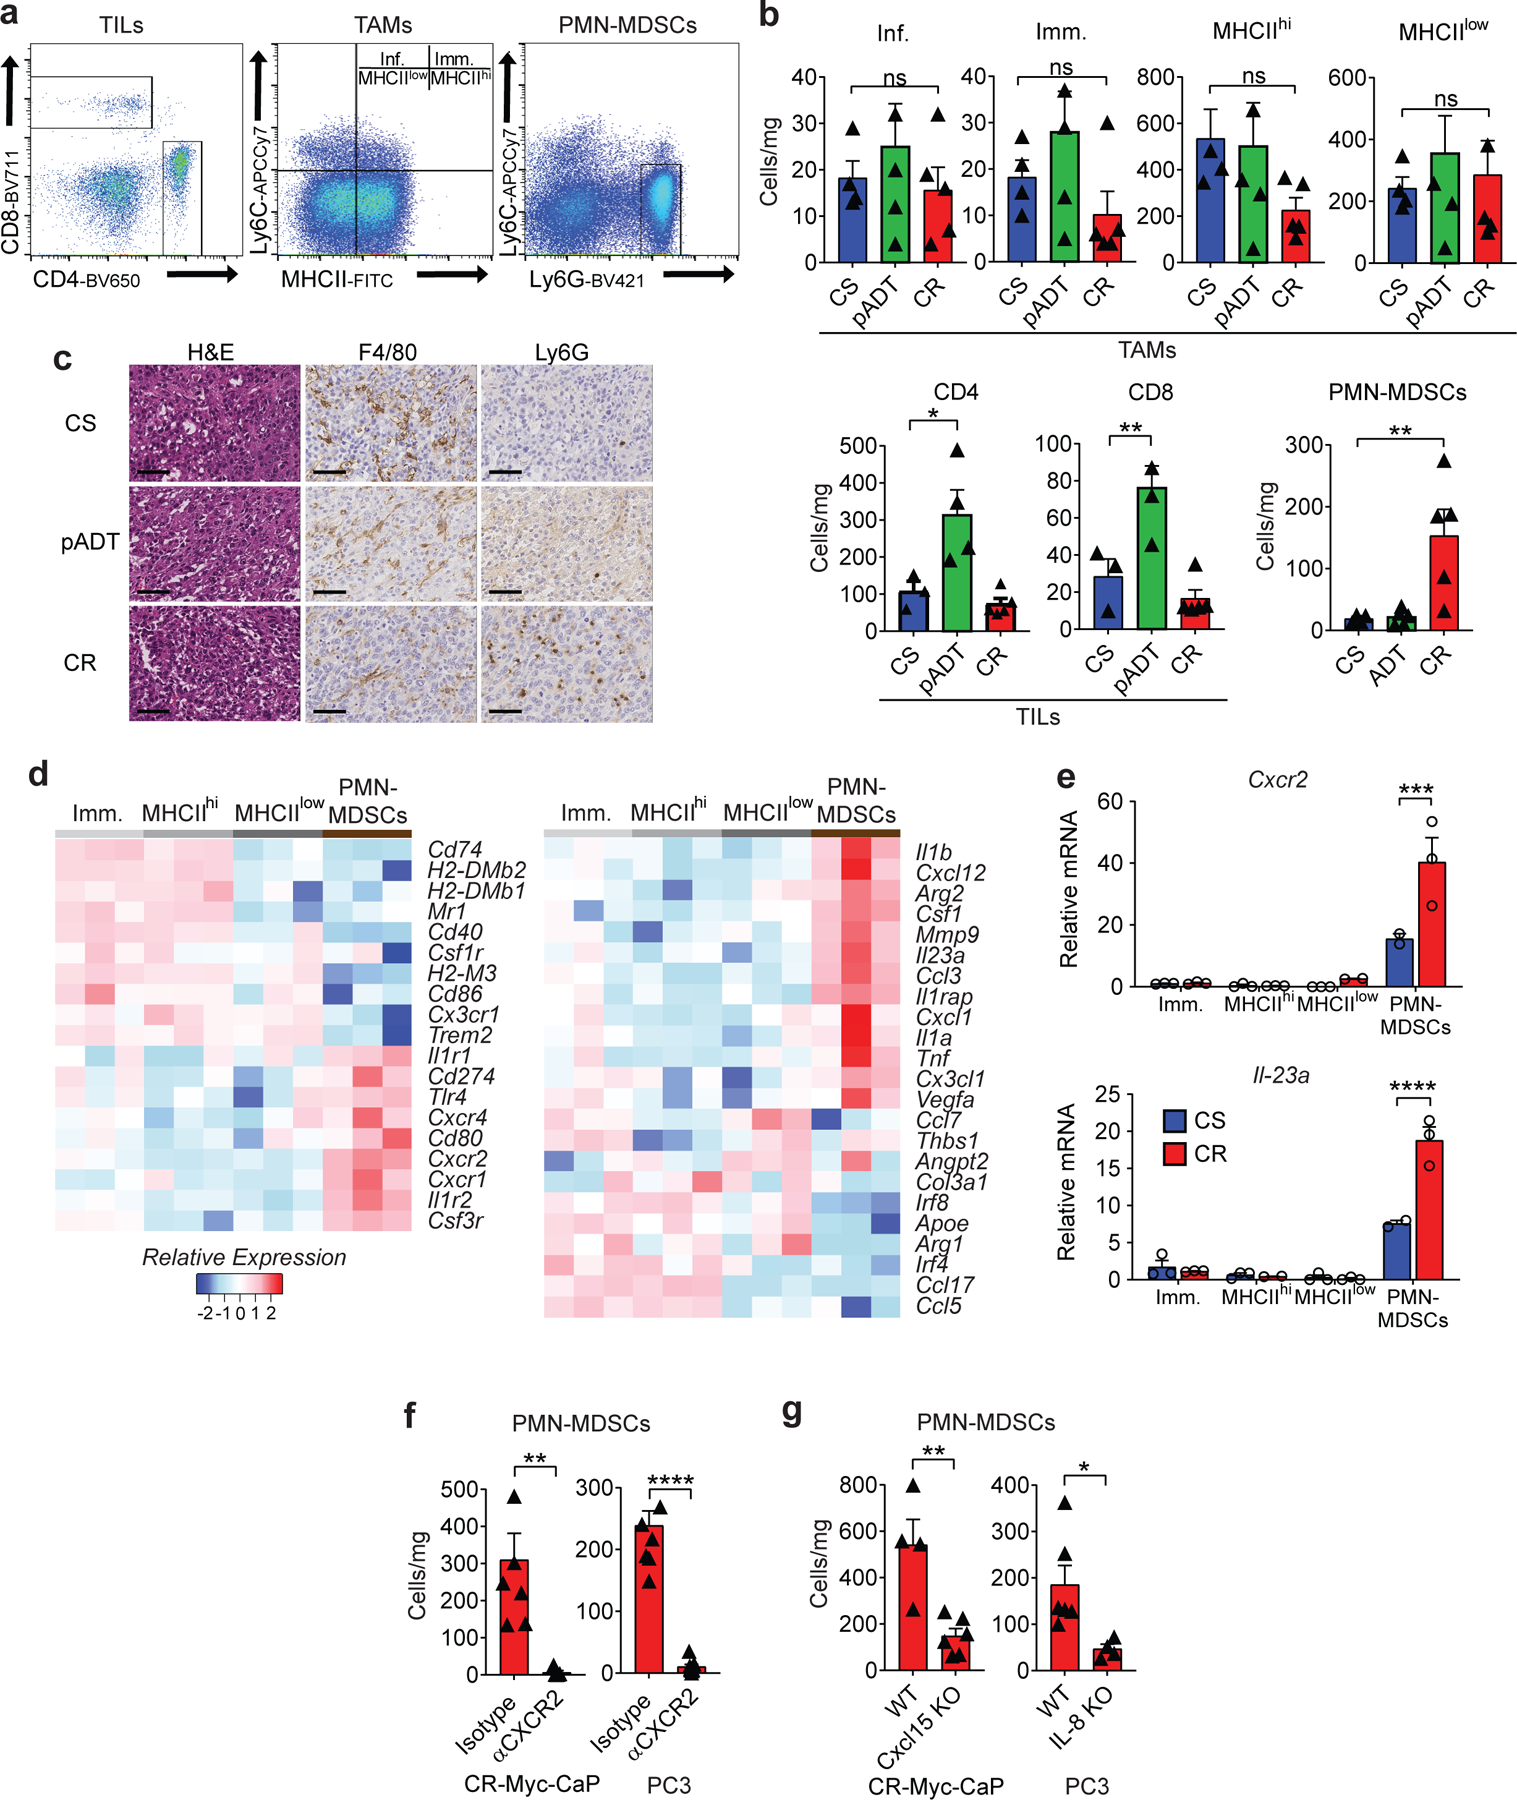
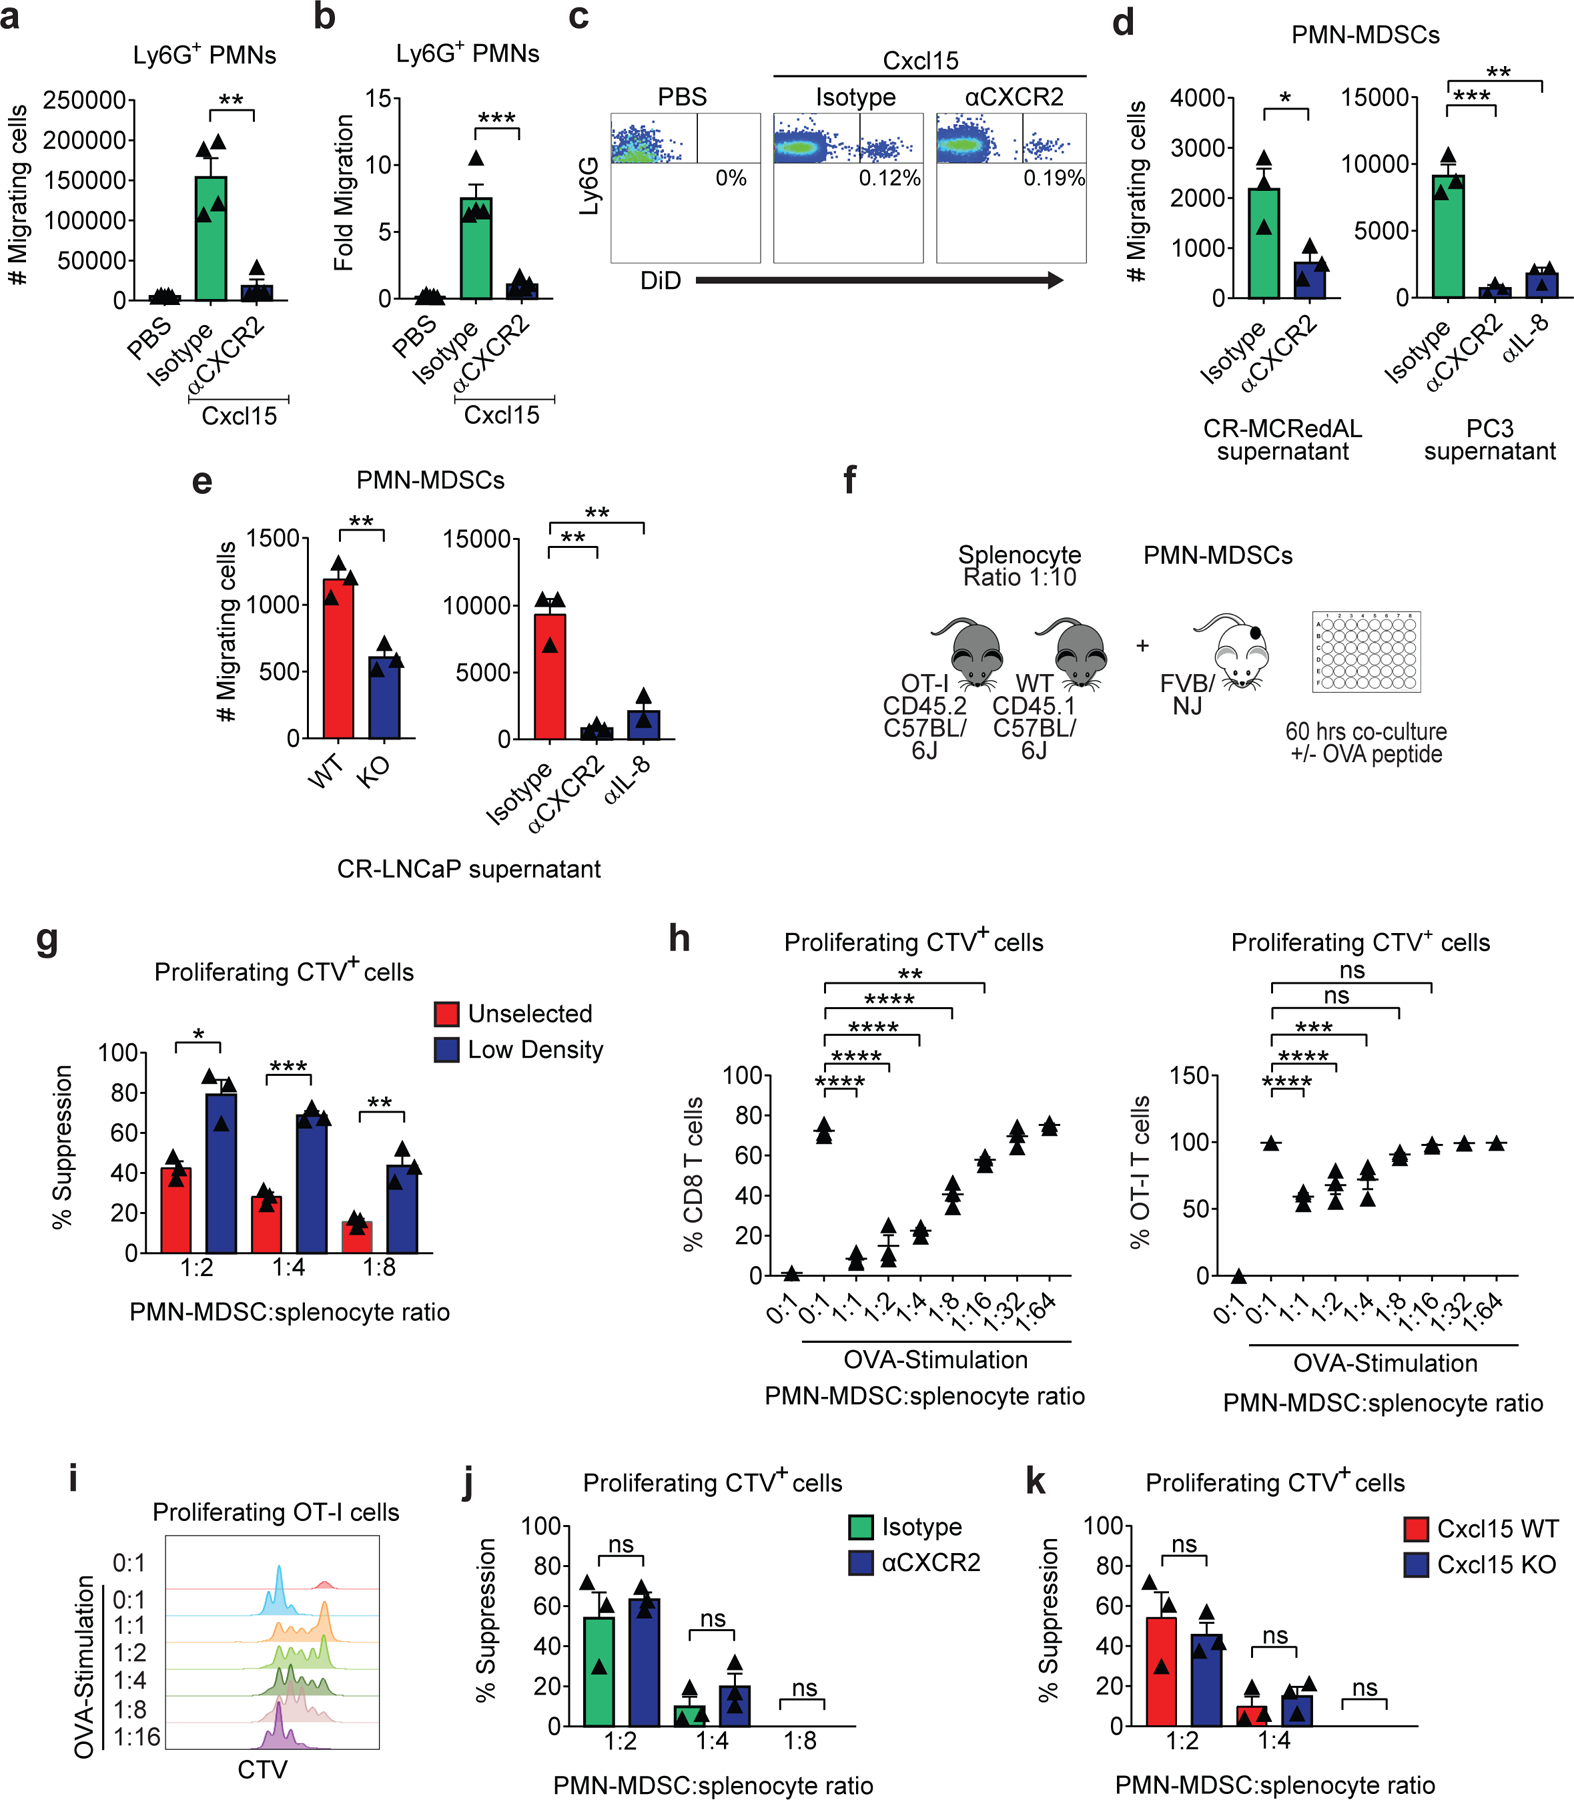
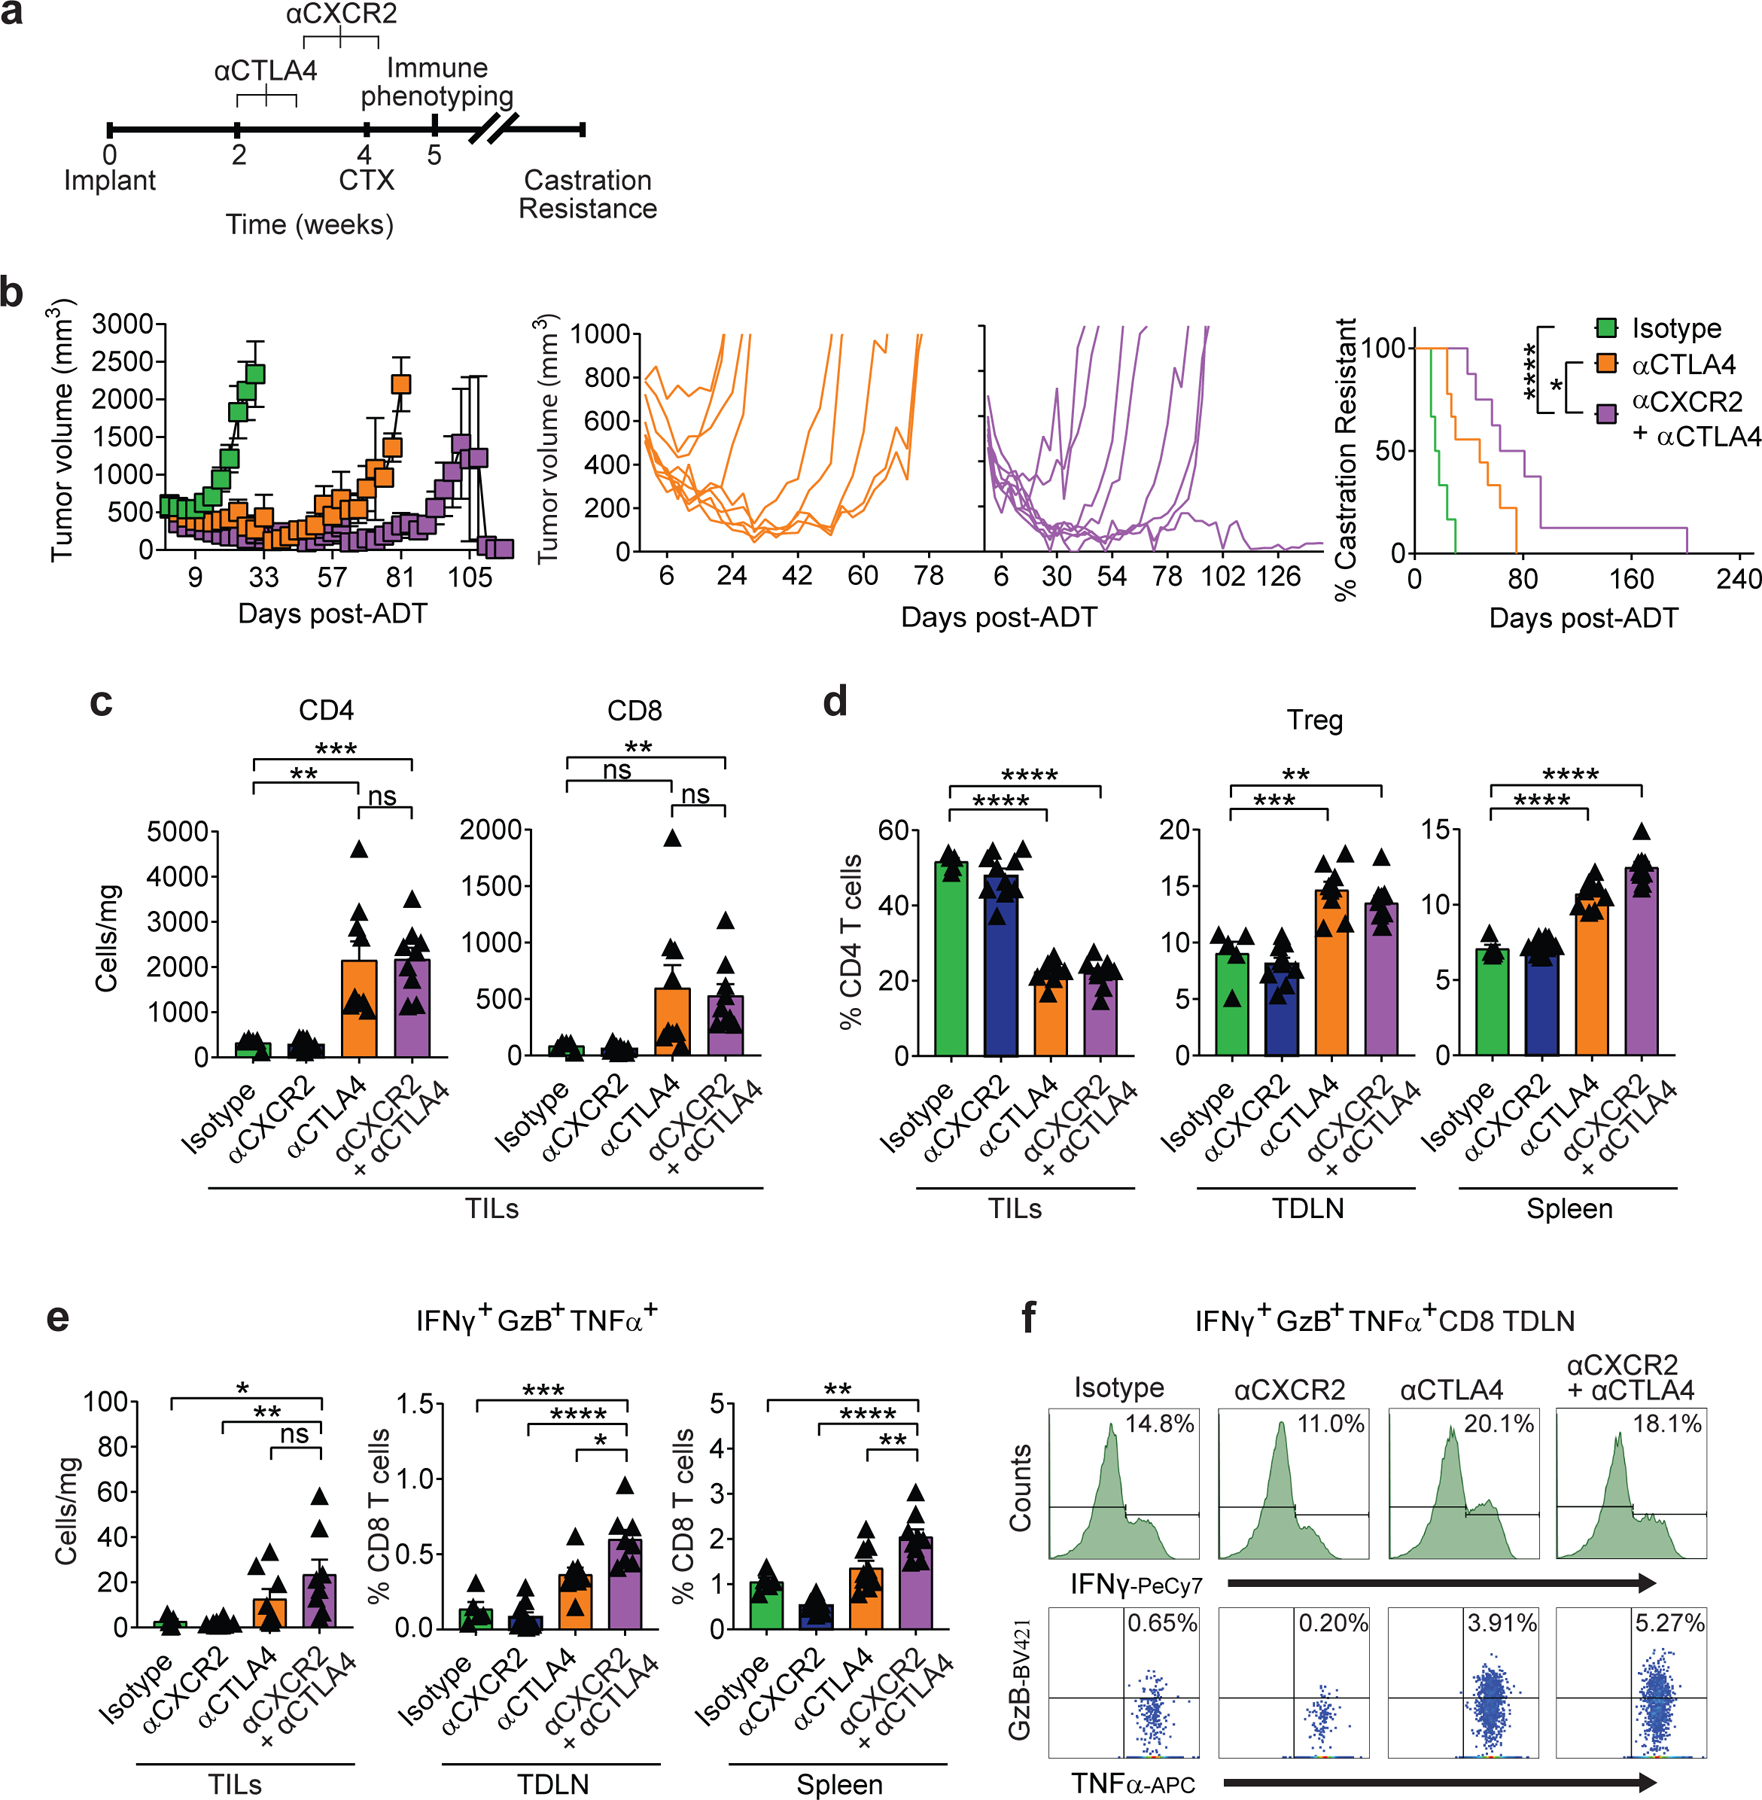
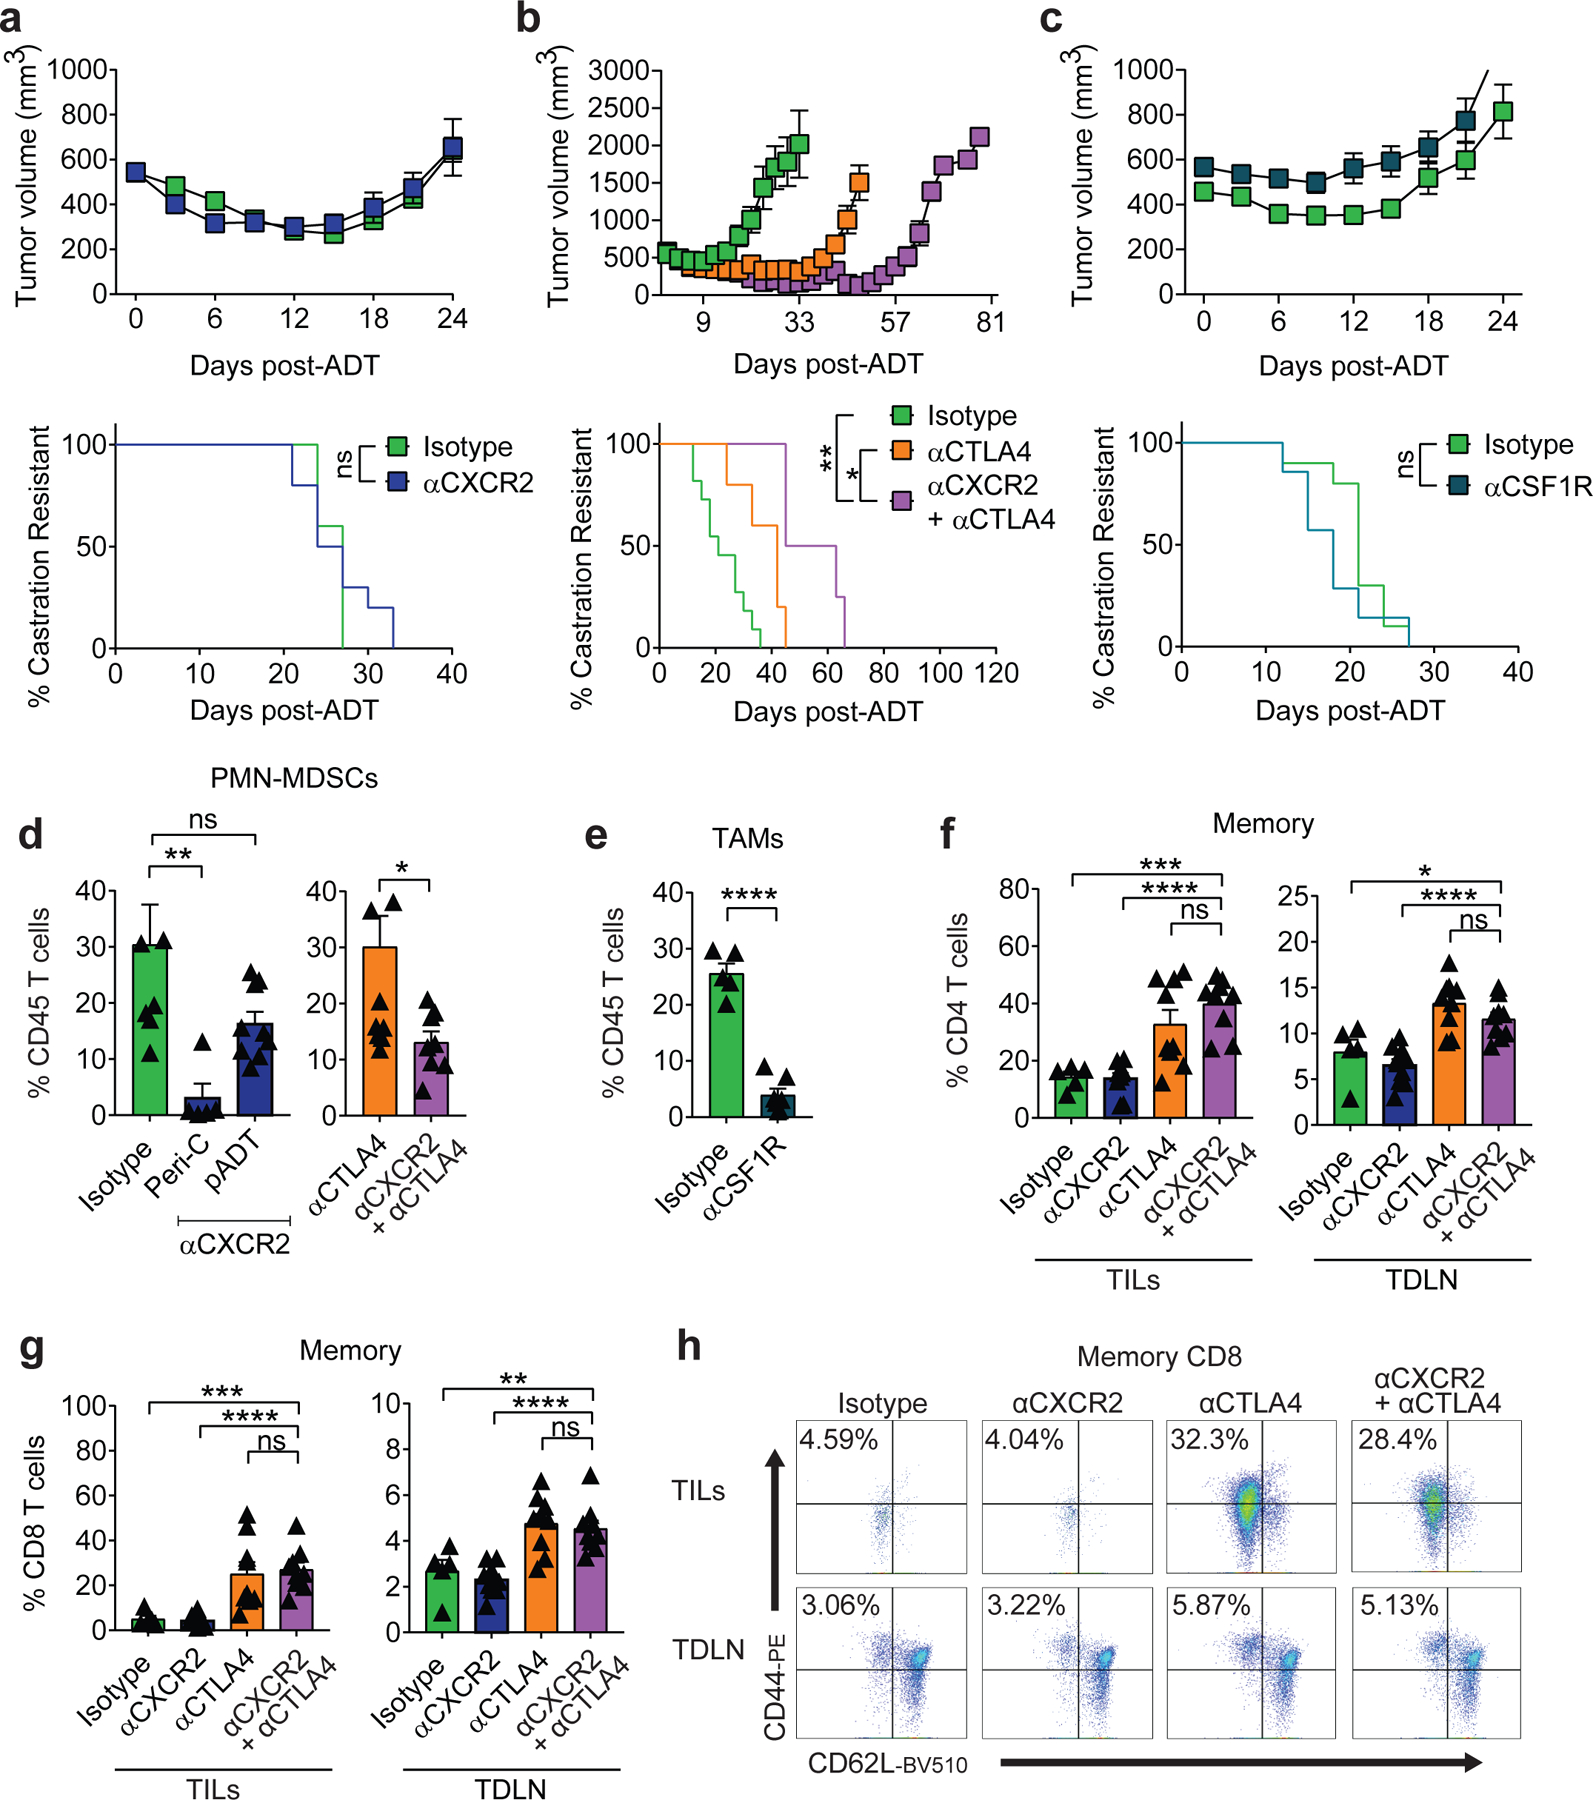
Unlike several other tumor types, prostate cancer rarely responds to immune checkpoint blockade (ICB). To define tumor cell intrinsic factors that contribute to prostate cancer progression and resistance to ICB, we analyzed prostate cancer epithelial cells from castration-sensitive and -resistant samples using implanted tumors, cell lines, transgenic models and human tissue. We found that castration resulted in increased expression of interleukin-8 (IL-8) and its probable murine homolog Cxcl15 in prostate epithelial cells. We showed that these chemokines drove subsequent intratumoral infiltration of tumor-promoting polymorphonuclear myeloid-derived suppressor cells (PMN-MDSCs), which was largely abrogated when IL-8 signaling was blocked genetically or pharmacologically. Targeting IL-8 signaling in combination with ICB delayed the onset of castration resistance and increased the density of polyfunctional CD8 T cells in tumors. Our findings establish a novel mechanism by which castration mediates IL-8 secretion and subsequent PMN-MDSC infiltration, and highlight blockade of the IL-8/CXCR2 axis as a potential therapeutic intervention.


Conflict of interest statement

Competing Interests

C.G.D. has served as a consultant for Agenus, Dendreon, Janssen Oncology, Eli Lilly, Merck, AstraZeneca, MedImmune, Pierre Fabre, Genentech, and Genocea Biosciences. A.M.C. is a shareholder of Aclaris Therapeutics, Inc, and a consultant for Dermira, Inc. and Aclaris Therapeutics, Inc. Columbia University has filed a US patent claiming the benefit of U.S. Provisional Patent Application No. 62/809,060 (inventors C.G.D. and Z.A.L.B.) on the use of IL-8 / CXCR2 blockade of PMN-MDSC recruitment to the TME for the treatment of prostate cancer. The remaining authors declare no competing interests.

Figures

Extended Data Figure 1 |
Extended Data Figure 1 |. Cxcl15 Regulation Upon AR signaling Stimulation and Inflammatory Stimuli in Prostate Tumor Epithelial Cells.
a, Androgen responsive prostate tumor cells progressed from castration-sensitive (CS) to androgen responsive (pADT), and eventually developed castration-resistance (CR). CR was tumor size defined as ≥ 30% of nadir tumor volume. Top, tumor growth curve of MCRedAL tumors (n=3 mice per group, repeated x2); bottom: treatment and harvest timeline. CTX: Castration. b, Upper: sorting strategy to isolate tumor epithelial cells from a based on their expression of mCherry and their CD45CD11bF4/80phenotype; Lower: purity check of mCherry+ sorted cells. c, Histogram of log2 fold change comparisons (SD Log2 FC) between pADT and CS groups among all the microarray transcripts (n=3 tumors per group). d, qRT-PCR quantification of Cxcl15 in Myc-CaP cells cultured at indicated concentrations of DHT for 8hrs and TNFα (50Units/ml) for 6hrs, cells cultured in androgen-free media for 48 hours before stimulation (n=2 independently cultured replicates per condition, repeated x2). Expression levels normalized to mean ΔCT level in samples cultured in androgen free media without TNFα or DHT. e, qRT-PCR quantification of Cxcl15 in Myc-CaP WT cells expressing either nothing, scramble (Scr) shRNA, or an anti-AR shRNA (KD: knock-down) cultured in the presence of DHT (10nM) for 8hrs and TNFα (50Units/ml) for 6hrs, cells cultured in androgen-free media for 24hrs before DHT stimulation (n=2 independently cultured replicates per condition, repeated x2). Expression levels normalized to mean ΔCT level in WT samples cultured in androgen free media without TNFα or DHT. f, qRT-PCR quantification of Cxcl15 in Myc-CaP cells cultured at indicated concentrations of DHT for 8hrs and TNFα (50Units/ml) for 6hrs in the presence and absence of the AR blocker Enzalutamide (10µM), cells cultured in androgen-free media for 48hrs before stimulation (n=2 independently cultured replicates per condition, repeated x2). Bar plots represent means with SEM. Unpaired two-tailed (d-f) t-tests were performed, p-values ≤ 0.0001 (****); p-values ≥ 0.05 (ns).
Extended Data Figure 2 |
Extended Data Figure 2 |. IL-8 Regulation in Prostate Tumor Epithelial Cells.
a, Percentage input bound in ChIP-qPCR assays assessing binding of AR, pSer5 Pol II, and H3K9ac at the KLK3 (PSA) promoter (top) and upstream region (bottom) in LNCaP cells cultured at indicated concentrations of DHT for 8hrs and TNFα (50Units/ml) for 6hrs, cells cultured in androgen-free media for 72hrs before DHT stimulation (n=2 independently cultured replicates per group). b, ChIP-Seq analysis of AR and NF-κB p65 subunit at the IL-8 (CXCL8) promoter in LNCaP cells cultured in the presence of either vehicle (DMSO), DHT (100nM), or TNFα (1000U/ml) (n=2 replicates per group; GSE83860). c, ChIP-Seq analysis at the IL-8 (CXCL8) promoter for AR and RNA pol II binding in LNCaP cells (top), and AR binding in VCaP cells (bottom). Both cell lines were cultured in the presence of either vehicle (DMSO) or DHT (10nM) (GSE55064). For b, loci with significant differential binding (black bar) were identified as described in materials and methods. Blue shading marks AR binding site; while orange shading marks NF-κB p65 subunit binding site. Bar plots represent means with SEM. Unpaired one-tailed t-tests were performed, p-values ≤ 0.0001 (****); p-values ≥ 0.05 (ns).
Extended Data Figure 3 |
Extended Data Figure 3 |. Chemokine Regulation in Prostate Tumor Epithelial Cells.
a, ChIP-Seq enrichment of AR and NF-κB p65 subunit at the CXCL1, CXCL2, CXCL5, and CXCL12 promoters in LNCaP cells cultured in the presence of either vehicle (DMSO), AR signaling (DHT: 100nM), or an inflammatory stimuli (TNFα: 1000U/ml) (n=2 independently cultured replicates per group; GSE83860). Orange shading marks NF-κB p65 subunit binding site. b, ChIP-Seq enrichment of AR at the CXCL1, CXCL2, CXCL5, and CXCL12 promoters in primary human prostate cancers (n=9 patients; GSE56288).
Extended Data Figure 4 |
Extended Data Figure 4 |. IL-8 Expression in Mouse and Human Prostate Cancer.
a, Representative images of positive and negative controls (cnts: murine and bacteria probe, respectively) in Myc-CaP tumors from indicated treatment groups highlight the specificity of RNA In situ hybridization independently of treatment groups. Tumors were harvested when tumor volume reached ~500mm3 (CS group) or at the time of castration-resistance (CR). Prostate tumor tissue sections were hybridized with CF568-labeled probe sets (white) to Cxcl15, CF640-labeled anti-PanCK antibody (red), and CF488-labeled anti-CD45 antibody (green). Nuclei were counterstained with DAPI (blue). b, qRT-PCR quantification of IL-8 in AR positive castration-sensitive (LNCaP, LAPC4, and VCaP) and AR independent castration-resistant (CWR22Rv1, DU145, and PC3) human prostate cancer cell lines (n=2 independently cultured replicates per group, repeated x2). IL-8 expression levels were normalized to mean ΔCT level in DU145 samples. c, CXCL1, CXCL2, CXCL5, and CXCL12 protein expression in human AR positive castration-sensitive LNCaP cell line (CS) and it’s isogenic castration-resistant counterpart LNCaP-abl (CR) quantified by MSD (n=3 independently cultured replicates per group, repeated x1). d, IL-8 protein expression in LNCaP and AR-independent PC3 human prostate cancer cell lines quantified by MSD, replicates as in c. e, Treatment scheme for GFP induction with Doxycycline (DOX) in transgenic Hoxb13-rtTA|TetO-H2BGFP mice for specific isolation of benign murine prostate epithelial cells from castration-sensitive (CS), androgen-deprivation treated (pADT) non-tumor bearing mice, and ADT-treated mice that received testosterone repletion (pADT + T). f, IL-8-RISH quantification in human prostate tumor specimens from untreated (n=20 patients) or ADT-treated (n=15 patients; NCT01696877). Quantification was restricted to tumor areas and represented as number of positive cells per mm2. Images representative of 3 independent experiments. RISH images are 60X magnification; scale bar=100 μm. For b, Tukey’s multiple comparisons test with a single pooled variance was performed, p-values ≤ 0.0001 (****). Bar plots represent means with SEM. Unpaired two-tailed (c-d) t-tests were performed, p-values ≤ 0.0001 (****); p-values ≥ 0.05 (ns). For f a Mann-Whitney U test was used due to the non-normal data distribution observed. The box plot includes 25th to 75th of all IL-8 positive cells/mm2 values with horizontal line indicating the median values. The whiskers represent the highest values, including outliers and extremes.
Extended Data Figure 5 |
Extended Data Figure 5 |. PMN-MDSCs Infiltration Relays on IL-8 (Cxcl15) / CXCR2 Signaling Following ADT.
a, PMN-MDSCs as a percentage of CD45+ cells in the TME of indicated human prostate tumors as determined by flow cytometry (n=3 LNCaP and n=6 PC3 tumors per group, 2 independent experiments). b, Representative H&E and immunohistochemistry (Ly6G and F4/80) sections of the indicated human prostate xenografts (repeated x3). c, Dorsal prostate transgenic NPK tumors (p=0.0493) and d, Anterior prostate transgenic NPK tumor (p=0.0006). Left: representative H&E and immunohistochemistry of Ly6G in transgenic NPK tamoxifen-inducible prostate tumors harvested from untreated (CS group) or ADT-treated mice (CR group). CTX (degarelix) was administrated 3 months after tamoxifen-induction, and tumors were harvest 30 days later; right: Ly6G positive counts per mm2 of tumor area as described in the methods section. e, PMN-MDSC density normalized to mg of tumor weight in transgenic NPK tamoxifen-inducible prostate tumors from mice treated as described in c-d (p=0.0208; cells/mg; n=4 CS & n=3 CR tumors per group). f, Left: representative H&E and immunohistochemistry of Ly6G in non-cancerous murine prostate from castration-sensitive (CS), androgen-deprivation treated (pADT) non-tumor bearing mice, and ADT-treated mice that received testosterone repletion (pADT + T). Repeated x2; right: counts of Ly6G positive cells per field as described in the methods section. g, Representative histograms of protein expression determined by flow cytometry in PMN-MDSCs from indicated organs (repeated x2). h, Representative H&E and immunohistochemistry (Ly6G and F4/80) on CR-Myc-CaP allografts treated as indicated (repeated x3). i, Representative H&E and immunohistochemistry (Ly6G and F4/80) in PC3 tumor xenografts treated as indicated (repeated x3). H&E and IHC images are 40X magnification; scale bar=50 μm. Bar plots represent means with SEM. Unpaired two-tailed (a-e) t-tests were performed, p-values ≤ 0.0001 (****); p-values ≥ 0.05 (ns). For f, Tukey’s multiple comparisons test with a single pooled variance was performed.
Figure 1 |
Figure 1 |. Androgen-Deprivation Therapy (ADT) Regulates Cxcl15 Expression in Murine Prostate Cancer Cells.
a, Differential expression profile of tumor epithelial cells isolated from castration-sensitive (CS) and ADT-treated MCRedAL tumor bearing mice. Heatmap showing transcripts 3 standard deviations away from the mean (n=3 biologically-independent samples per group). b, Differential chemokine expression of tumor epithelial cells isolated from CS and pADT tumor bearing mice, replicates as in a. Left, volcano plot showing differential gene expression among all MTA 1.0 microarray transcripts. Right, heatmap of normalized chemokine transcripts. c, Hallmarks gene sets pathway analysis post-ADT shows NF-κB up-regulation by castration. d, Gene and protein expression of Cxcl15 in indicated sorted MCRedAL tumor cells in vitro by qRT-PCR (p=0.0237) and ELISA (p=0.0436), respectively, replicates as in a. e, qRT-PCR quantification of Cxcl15 in Myc-CaP cells cultured at indicated concentrations of DHT for 8hrs, cells cultured in androgen-free media for 48hrs before DHT stimulation (n=2 independently cultured replicates per condition, repeated x2). Expression levels normalized to mean ∆CT level in samples cultured in androgen free media without DHT. f, Percentage input bound in ChIP-qPCR assays assessing binding of AR, pSer5 Pol II, and H3K9ac at the Cxcl15 promoter in Myc-CaP cells cultured at indicated concentrations of DHT for 8hrs, cells cultured in androgen-free media for 48hrs before DHT stimulation (n=2 technical replicates per group, repeated x1). g, Percentage input bound in ChIP-qPCR assays assessing binding of AR, pSer5 Pol II, and H3K9ac at the Cxcl15 promoter in Myc-CaP cells cultured at indicated concentrations of DHT for 8hrs and TNFα (50Units/ml) for 6hrs, cells cultured in androgen-free media for 48hrs before DHT stimulation (replicates as in f). h, qRT-PCR quantification of Cxcl15 in Myc-CaP WT cells expressing either nothing, scramble (Scr) shRNA, or an anti-AR shRNA (KD: knockdown) cultured at indicated concentrations of DHT for 8hrs, cells cultured in androgen-free media for 24hrs before DHT stimulation (n=2 independently cultured replicates per condition, repeated x2). Expression levels normalized to mean ∆CT level in WT samples cultured in androgen free media without DHT. Bar plots represent means with SEM. Unpaired one-tailed t-tests were performed.
Figure 2 |
Figure 2 |. Androgen Receptor Signaling Modulates IL-8 Expression in Human Prostate Cancer Cells.
a, qRT-PCR quantification of IL-8 in LNCaP cells cultured at indicated concentrations of TNFα (Units/ml) for 6hrs (left) or of DHT for 8hrs and TNFα (50Units/ml) for 6hrs (right), cells cultured in androgen-free media for 72hrs before TNFα or DHT stimulation (n=2 independently cultured replicates per condition, repeated x2). Expression levels normalized to mean ∆CT level in samples cultured in androgen free media without TNFα or DHT. b, Percentage input bound in ChIP-qPCR assays assessing binding of AR and pSer5 Pol II at the IL-8 (CXCL8) promoter in LNCaP cells cultured at indicated concentrations of DHT for 8hrs and TNFα (50Units/ml) for 6hrs, cells cultured in androgen-free media for 72hrs before DHT stimulation (n=2 technical replicates per group, repeated x1). An Enzalutamide (10µM) treated group was included as a control. c, qRT-PCR quantification of IL-8 in LNCaP cells cultured in the presence of DHT (10nM) for 8hrs and TNFα (50Units/ml) for 6hrs in the presence and absence of the AR blocker Enzalutamide (10µM), cells cultured in androgen-free media for 72hrs before stimulation (n=2 independently cultured replicates per condition, repeated x2). d, Schematic representation of the constructs involved in the dual luciferase assay; top: firefly luciferase construct driven by the IL-8 promoter containing AR binding sequence and NF-κB p65 subunit binding sequence (p65BS+ARBS) shown in Extended Data Figure 2a, and bottom: the promoterless renilla luciferase construct. e, Fold change in IL-8 promoter activity in co-transfected Myc-CaP cells cultured in the presence of DHT (10nM) for 8hrs and TNFα (50Units/ml) for 6hrs (p=0.0132 Scr vs. KD and p=0.0313 Scr vs. Enza; n=3 independently transfected replicates per condition, repeated x 2). f, ChIP-Seq enrichment of AR at the IL-8 (CXCL8) promoter in primary human prostate cancers (n=11 patients; GSE56288). Bar plots represent means with SEM. Unpaired two-tailed t-tests were performed, p-values ≥ 0.05 (ns).
Figure 3 |
Figure 3 |. Cxcl15 and IL-8 are Up-Regulated in Post-Castration and Castration-Resistant Prostate Cancer.
a, Representative images of Cxcl15 in Myc-CaP tumors. Tumors were harvested at ~500mm3 (CS group) or at the time of castration-resistance (CR), and hybridized with probe sets (white) to Cxcl15, anti-PanCK antibody (red), and anti-CD45 antibody (green). Nuclei were counterstained with DAPI (blue). b, Gene expression of Cxcl15 in sorted MCRedAL cells and protein expression in tumor lysates of indicated tumor samples by qRT-PCR (left) and ELISA (right), respectively (n=2 biologically-independent samples per group, repeated x2). c, qRT-PCR quantification of IL-8 in human AR positive castration-sensitive cells (CS: LNCaP, LAPC4, and VCaP) and their castration-resistant counterparts (CR: LNCaP-abl, LAPC4-CR, and VCaP-CR; n=2 technical replicates, repeated x2). d, IL-8 protein expression in isogenic cell pairs from c quantified by MSD (n=3 independently cultured replicates per condition, repeated x2). e, Representative images of Cxcl15 fluorescent detection in benign murine prostate tissue samples from castration-sensitive (CS), androgen-deprivation treated (pADT), and ADT-treated mice that received testosterone repletion (pADT + T). Tissue sections hybridized with probe sets (white) to Cxcl15, and anti-PanCK antibody (red). Nuclei were counterstained with DAPI (blue). f, qRT-PCR analysis of Cxcl15 expression in prostate luminal epithelial cells (PLECs) from indicated treatment groups (p=0.0074 CS vs pADT and p=0.0131 pADT vs pADT+T; n=3 biologically-independent samples per group). PLECs were isolated based on their GFP+CD49fintCD24+CD45F4/80CD11bexpression by flow sorting. g, Expression of IL-8 in human prostate epithelial cells micro-dissected from patients (NCT00161486) receiving placebo, androgen-deprivation treatment (pADT), or ADT plus testosterone repletion (pADT + T). Z-score values of microarray transcripts from benign prostate biopsies were normalized to placebo (p=0.0143 pADT vs pADT+T; n=4 biologically-independent samples per group; GSE8466). h, Representative images of IL-8 colorimetric detection in human prostate tumor specimens from untreated or ADT-treated (NCT01696877). i, Expression of IL-8 in human prostate cancer epithelial cells micro-dissected from untreated or ADT-treated (p=0.0148 Untreated vs pADT; n=8 biologically-independent samples per group) patients as determined by qRT-PCR. Images representative of 3 independent experiments. RISH images are at 60X magnification; scale bar=100 μm. Gene expression levels were normalized to CS, untreated or placebo samples. Bar plots represent means with SEM. Unpaired two-tailed (d-f) t-tests were performed, p-values ≤ 0.0001 (****); p-values ≥ 0.05 (ns). For c & f, Log2 transformed values were used. For g & i, a Mann-Whitney U test was used due to the non-normal data distribution observed. The box plot includes 25th to 75th of all IL-8 expression values with horizontal line indicating the median values. The whiskers represent the highest values, including outliers and extremes.
Figure 4 |
Figure 4 |. Castration-mediated IL-8 Up-Regulation Promotes PMN-MDSC Infiltration.
a, Gating strategy used to profile the immune compartment of the TME by flow cytometry. Tumor associated macrophages (TAMs) gated based on CD45+Ly6GF4/80+CD11b+, Inflammatory (Inf.) TAMs as CD45+CD11b+F4/80+Ly6C+MHCII, immature (Imm.) TAMs as CD45+CD11b+F4/80+Ly6C+MHCII+, MHCIIhi TAMs as CD45+CD11b+F4/80+Ly6CMHCII+, MHCIIlow TAMs as CD45+CD11b+F4/80+Ly6CMHCII, tumor Infiltrating Lymphocytes (TILs) CD45+CD4+ or CD45+CD8+, tumor infiltrating polymorphonuclear myeloid-derived suppressor cells (PMN-MDSCs) as CD45+CD11b+Ly6C+Ly6G+. b, TAM, TIL, and PMN-MDSC density normalized to mg of tumor weight (cells/mg; p=0.0189 CD4, p=0.0093 CD8, and p=0.0099 PMN-MDSCs; Myeloid cells: n=4 CS, n=5 pADT, n=5 CR and T cells: n=3 CS, n=4 pADT, n=5 CR tumors per group, repeated x2). c, Representative H&E and immunohistochemistry (F4/80 and Ly6G) of indicated murine allografts (repeated x3). d, Normalized expression of selected genes determined by NanoString nCounter gene analysis in sorted myeloid fractions defined as in a (n=3 tumors per group). e, qRT-PCR quantification of Cxcr2 and Il-23 in indicated populations of Myc-CaP tumors (Imm.: n=3 CS & CR, MHCIIhi: n=3 CS & CR, MHCIIlow: n=3 CS & n=2 CR, and PMN-MDSCs: n=2 CS & n=3 CR tumors per group). f and g, Density of PMN-MDSCs normalized to mg of tumor weight (cells/mg) in Myc-CaP (p=0.0054 anti-CXCR2; n=7 isotype and n=5 anti-CXCR2 tumors per group; p=0.0033 Cxcl15 KO; n=4 WT and n=6 Cxcl15 KO tumors per group, repeated x2) and PC3 tumors (p<0.0001 anti-CXCR2; n=8 isotype and n=9 anti-CXCR2 tumors per group; p=0.0303 IL-8 KO; n=6 WT and n=4 IL-8 KO tumors per group, repeated x2). Cells quantified by flow cytometry as in a, tumors implanted and harvested as in materials and methods. H&E and IHC images at 40X magnification; scale bar=50 μm. Gene expression levels normalized to the mean ∆CT level in samples from the Immature TAMs (Imm.) group. Bar plots represent means with SEM. Unpaired two-tailed (f-g) t-tests were performed, p-values ≤ 0.0001 (****); p-values ≥ 0.05 (ns). Tukey’s (b) multiple comparisons test were performed for one-way and two-way ANOVAs respectively.
Figure 5 |
Figure 5 |. The Cxcl15/CXCR2 (IL-8/CXCR2) Axis Regulates PMN-MDSCs Migration, but Not Their Ability to Suppress T Cell Function.
a-c, Analyses of Cxcl15 driven Ly6G+ PMNs migration to the peritoneum in animals pretreated with either isotype or anti-CXCR2 (n=5 PBS, n=4 isotype, and n=4 anti-CXCR2 mice per group, repeated x2). a, Cell numbers (p=0.0015). b, Fold change calculated as the number of Ly6G+ PMNs in peritoneal washings divided by PMN numbers in peripheral blood (p=0.0008). c, Representative flow plots of Ly6G+ PMNs in peritoneal washings d, PMN-MDSC in vitro migration towards tumor supernatants in the presence of either isotype, anti-CXCR2, or anti-IL-8 (200µg/ml). Antibodies were added at the beginning of the experiment (p=0.0304 CR-MCRedAL, p=0.0015 anti-CXCR2 and p=0.0006 anti-IL-8 for PC3 supernatant; n=3 independent assays per group, repeated x2). e, PMN-MDSC in vitro migration towards CR-LNCaP (also known as LNCaP-abl) WT or IL-8 KO tumor supernatants (left; p=0.0034) and towards WT supernatants in the presence of either isotype, anti-CXCR2, or anti-IL-8 (200µg/ml; right; p=0.0018 anti-CXCR2 and p=0.005 anti-IL-8) (n=3 independent assays per group, repeated x2). f, Schematic representation of PMN-MDSC suppression assay. OT-I splenocytes (CD45.2) were mixed with naïve splenocytes (CD45.1) in a 1:10 ratio, labeled with CTV, and co-cultured with PMN-MDSCs at the indicated ratios. Antigen-specific T cell proliferation stimulated (Stim) by OVA peptide (5pM) for 60hrs. g, Percent suppression with either unselected or low-density PMN-MDSCs (p=0.0101 1:2, 0.0002 1:4, and p=0.0051 1:8; n=3 independent assays per group, repeated x3). h, Percentage of CD8 T cells (left; p<0.0001 1:1–1:8 and p=0.0055 1:16) and antigen specific OT-I cells (CD45.2; right; p<0.0001 1:1–1:2 and p=0.0002 1:4) proliferating at different proportions of PMN-MDSCs when stimulated with or without 5pM of OVA, replicate numbers as in g. i, Representative histograms of antigen specific OT-I cell proliferation based on the dilution of CTV dye when stimulated as in h (repeated x2). j, Percent suppression in the presence of either isotype or anti-CXCR2 (200µg/ml). Antibodies were added at the beginning of the experiment (n=3 independent assays per group, repeated x2). k, Percent suppression of PMN-MDSCs derived from spleens of WT or Cxcl15 KO Myc-CaP tumor bearing mice (n=3 independent assays per group, repeated x2). Bar plots represent means with SEM. Unpaired two-tailed (a-g, j-k) t-tests were performed, p-values ≤ 0.0001 (****); p-values ≥ 0.05 (ns). For h, Tukey’s multiple comparisons test with a single pooled variance was performed.
Figure 6 |
Figure 6 |. CXCR2 Blockade Improves Response to Immune Checkpoint Blockade Following Androgen-Deprivation Therapy.
a, Treatment scheme, scale=weeks. Animals sacrificed for immune phenotyping 1 week after castration (CTX). b, Tumor growth and survival curves of mice from isotype (n=6) vs. anti-CTLA-4 (n=9) vs. anti-CXCR2 + anti-CTLA-4 (n=8) groups treated as described in a (black line vs. orange line vs. purple line, respectively; p<0.0001 for anti-CXCR2 + anti-CTLA4 and p=0.0328 for anti-CTLA4 survival analysis; 2 independent experiments). c, Tumor infiltrating lymphocyte (TILs) density in indicated treatment groups (p=0.008 anti-CTLA4 and p=0.0002 anti-CXCR2 + anti-CTLA4 for CD4, and p=0.0088 anti-CXCR2 + anti-CTLA4 for CD8; n=5 isotype, n=10 anti-CXCR2, n=9 anti-CTLA4, and n=9 anti-CXCR2 + anti-CTLA4 mice per group, 2 independent experiments). d, Treg percentages (as fraction of CD4) in indicated tissues (replicates as in c; p=0.0007 anti-CTLA4 and p=0.0021 anti-CXCR2 + anti-CTLA4 in TDLN). e, Polyfunctional CD8 T cells, left panel=density (p=0.0331 isotype and p=0.0021 anti-CXCR2 vs. anti-CXCR2 + anti-CTLA4), center/right panels = percentage of total CD8, animal numbers as in d (center: p=0.0003 for isotype and p=0.0102 for anti-CTLA4 vs. anti-CXCR2 + anti-CTLA4; right: p=0.0012 isotype and p=0.0084 anti-CTLA4 vs. anti-CXCR2 + anti-CTLA4). f, Representative histograms and dot plots of polyfunctional CD8+ IFNγ+GzB+TNFα+ from tumor draining lymph nodes (TDLN). Repeated x 2. For a-f, treatment was initiated when tumor volumes reached 200mm3. Average tumor volume (with SEM) for each experimental group. Log-rank (Mantel-Cox) test used for survival analysis. Flow cytometry as in materials and methods. Bar plots represent means with SEM. Unpaired two-tailed (c-e) t-tests were performed, p-values ≤ 0.0001 (****); p-values ≥ 0.05 (ns).
Figure 7 |
Figure 7 |. The Therapeutic Effect of the Triple Combination is Associated with PMN-MDSC Reduction.
a, Tumor growth and survival curves of mice from isotype vs. anti-CXCR2 treatment groups (green vs. blue, respectively; n=10 biologically-independent animals per group, 2 independent experiments). b, Tumor growth and survival curves of mice from isotype (n=11) and anti-CTLA4 (n=5) vs. anti-CXCR2 + anti-CTLA4 (n=4) treatment groups (green p=0.0201 and orange p=0.0014 vs. purple, respectively; 2 independent experiments). c, Tumor growth and survival curves of mice from isotype (n=6) vs. αCSF1R (n=7) treatment groups (green vs. purple, respectively; 2 independent experiments). d, PMN-MDSCs as a percentage of CD45+ cells in the TME of: left, mice treated with either isotype (n=8) vs. αCXCR2 peri-castration (n=5; Peri-C p=0.0034) or 7 days after castration (n=9; pADT p=0.0725), and right, mice treated with either αCTLA-4 (n=11) vs. αCTLA-4 + αCXCR2 (n=8; p=0.0221). e, TAMs as a percentage of CD45+ cells in the TME of indicated treatment groups (n=5 isotype and n=7 anti-CSF1R tumors per group). f, Memory CD4 T cells as a percentage of CD45+CD4+ T cells in the tumor (p=0.0001 isotype vs anti-CXCR2+ anti-CTLA4 in tumor infiltrating lymphocytes: TILs) and tumor-draining lymph node (p=0.0234 isotype vs anti-CXCR2 + anti-CTLA4 in TDLN) of indicated treatment groups (n=5 isotype, n=10 anti-CXCR2, n=9 anti-CTLA4, and n=9 anti-CXCR2 + anti-CTLA4 tumors per group, repeated x2). g, Memory CD8 T cells as a percentage of CD45+CD8+ TILs and TDLN of indicated treatment groups, p=0.0004 and p=0.0084 isotype vs anti-CXCR2+ anti-CTLA4 in TIL and TDLN respectively, replicates as in f. h, Representative plot of memory CD8+ TILs and TDLN of indicated treatment groups (repeated x2). For a-c, treatment started when tumor volumes reached 400mm3. For d-h, treatment started when tumor volumes reached 200mm3. Average tumor volume (with SEM) for each experimental group. Log-rank (Mantel-Cox) test was used for survival analysis. Flow cytometry as in materials and methods. Tukey’s multiple comparisons test with a single pooled variance was performed for PMN-MDSC depletion experiment. Bar plots represent means with SEM. Unpaired two-tailed (d-g) t-tests were performed, p-values ≤ 0.0001 (****); p-values ≥ 0.05 (ns).

Comment in

References

    1. Kantoff PW et al. Sipuleucel-T immunotherapy for castration-resistant prostate cancer. N Engl J Med 363, 411–422, doi:10.1056/NEJMoa1001294 (2010). - DOI - PubMed
    1. Kwon ED et al. Ipilimumab versus placebo after radiotherapy in patients with metastatic castration-resistant prostate cancer that had progressed after docetaxel chemotherapy (CA184–043): a multicentre, randomised, double-blind, phase 3 trial. Lancet Oncol 15, 700–712, doi:10.1016/S1470-2045(14)70189-5 (2014). - DOI - PMC - PubMed
    1. Beer TM et al. Randomized, Double-Blind, Phase III Trial of Ipilimumab Versus Placebo in Asymptomatic or Minimally Symptomatic Patients With Metastatic Chemotherapy-Naive Castration-Resistant Prostate Cancer. J Clin Oncol 35, 40–47, doi:10.1200/JCO.2016.69.1584 (2017). - DOI - PubMed
    1. Topalian SL, Drake CG & Pardoll DM Immune checkpoint blockade: a common denominator approach to cancer therapy. Cancer Cell 27, 450–461, doi:10.1016/j.ccell.2015.03.001 (2015). - DOI - PMC - PubMed
    1. Topalian SL et al. Safety, activity, and immune correlates of anti-PD-1 antibody in cancer. N Engl J Med 366, 2443–2454, doi:10.1056/NEJMoa1200690 (2012). - DOI - PMC - PubMed

Publication types