. 2020 Jul;1(7):692-708.
doi: 10.1038/s43018-020-0082-y. Epub 2020 Jun 29.

Cancer-associated fibroblast compositions change with breast cancer progression linking the ratio of S100A4+ and PDPN+ CAFs to clinical outcome

Affiliations

Cancer-associated fibroblast compositions change with breast cancer progression linking the ratio of S100A4+ and PDPN+ CAFs to clinical outcome

Gil Friedman et al. Nat Cancer. 2020 Jul.

Abstract

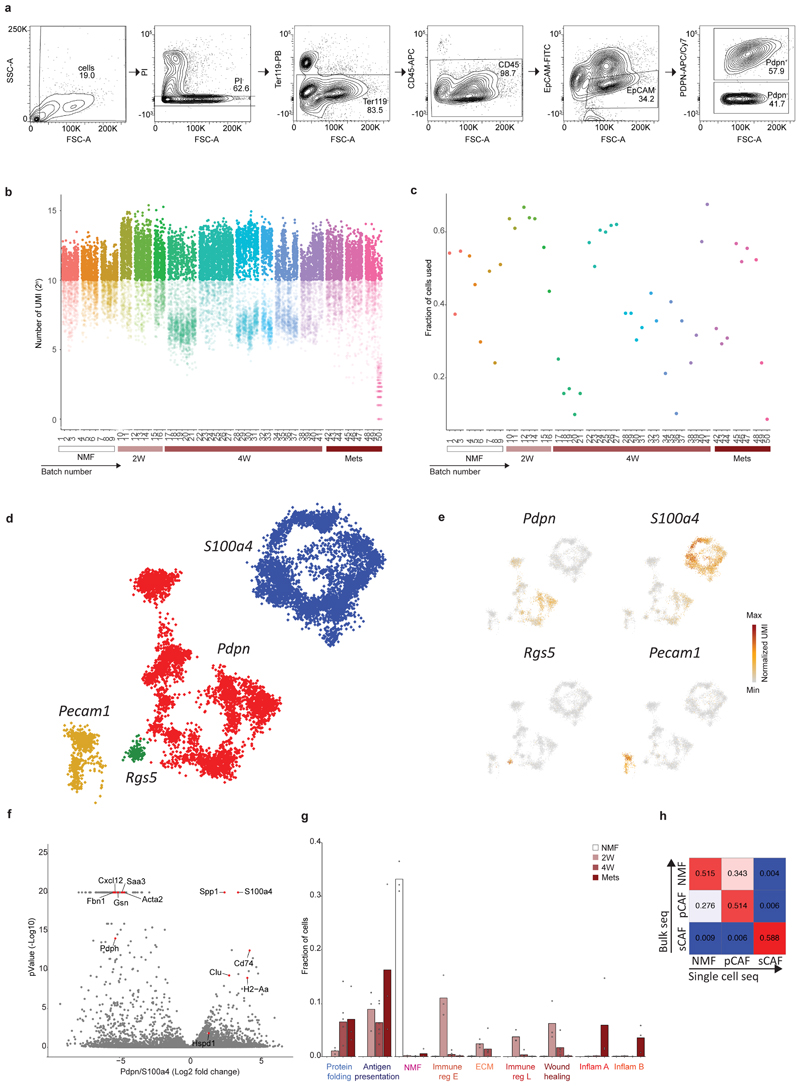
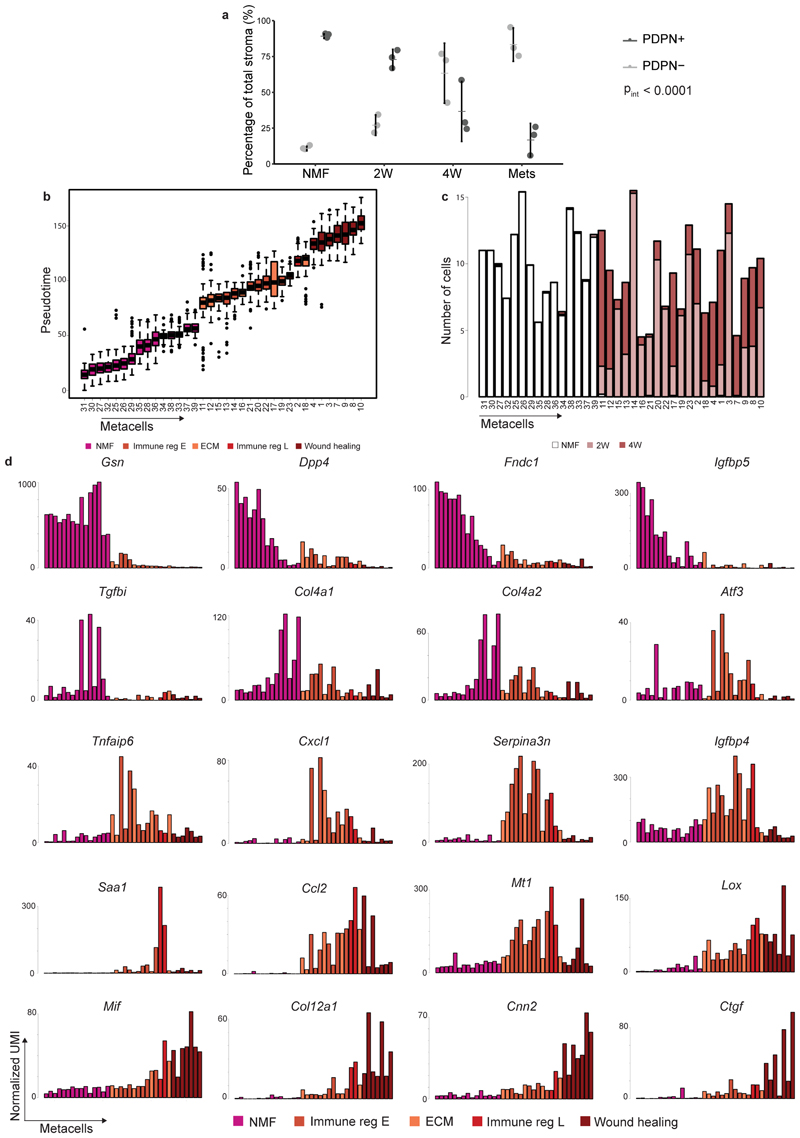
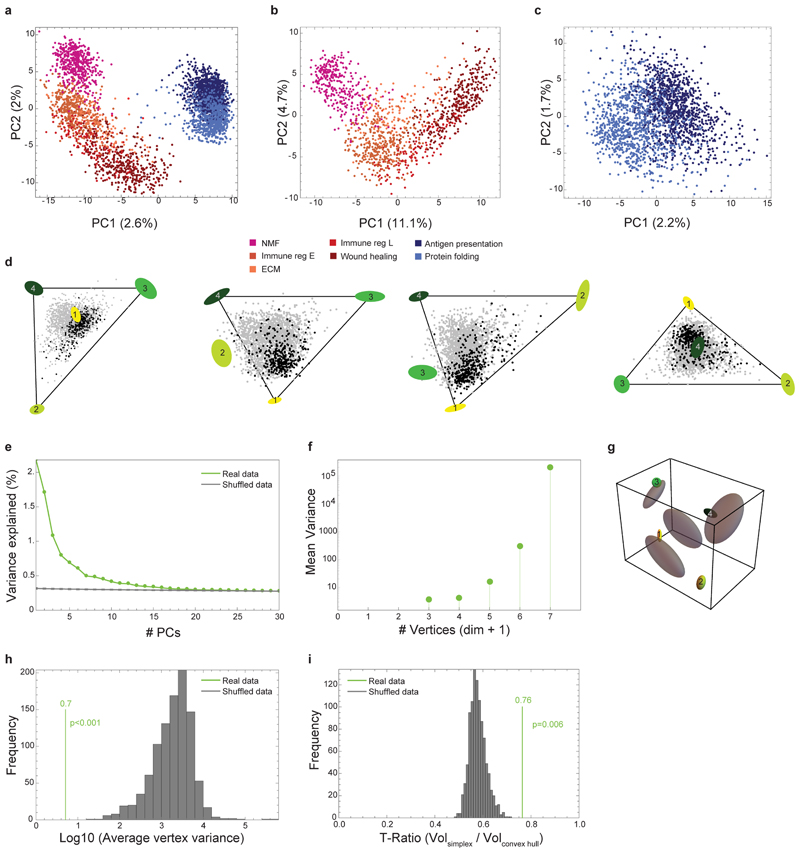
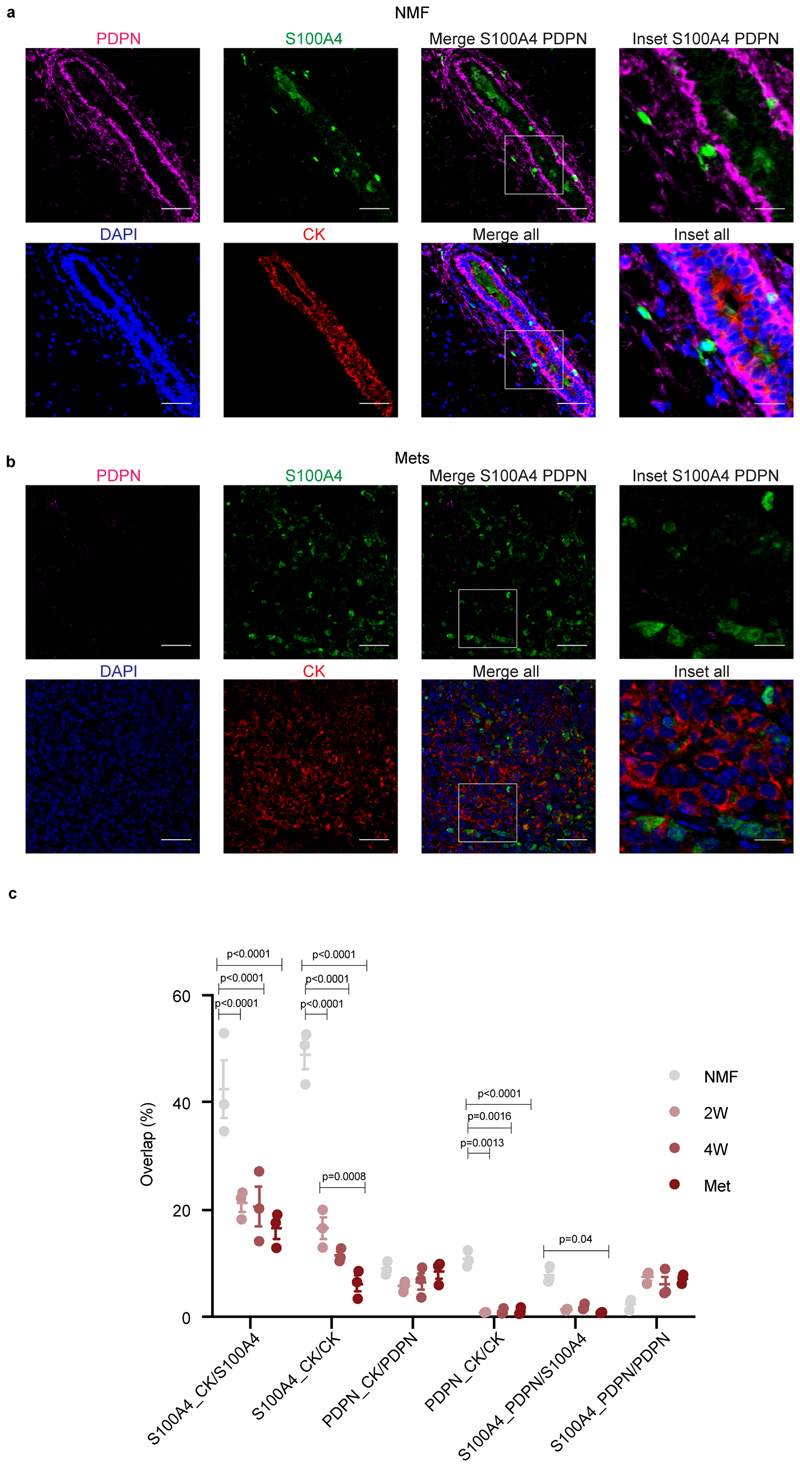
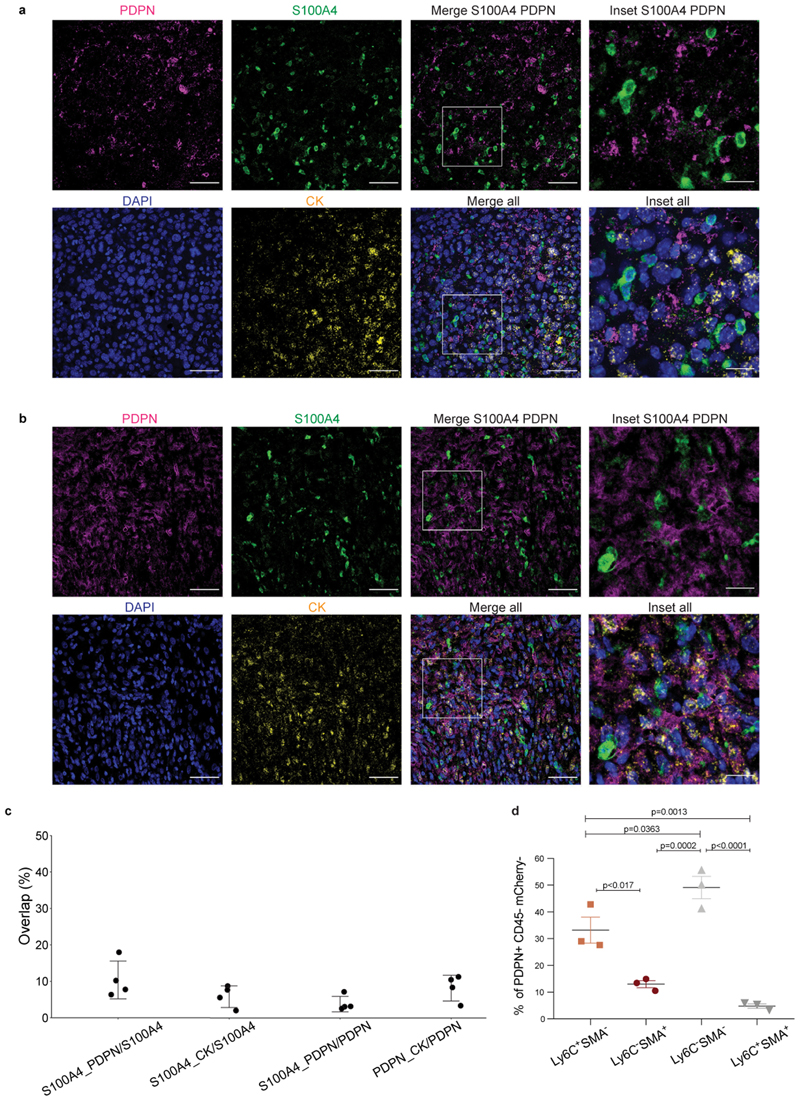
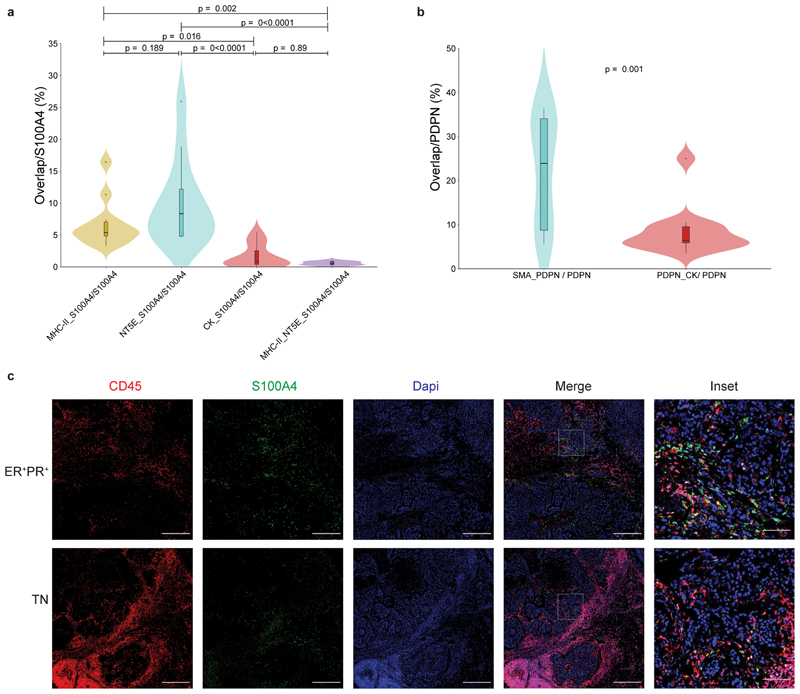
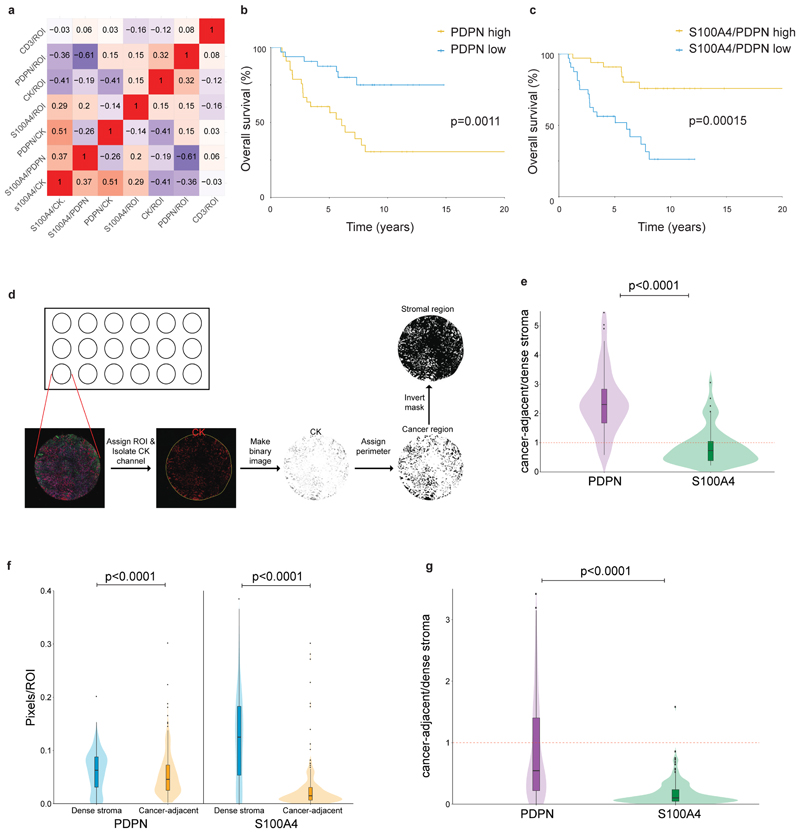
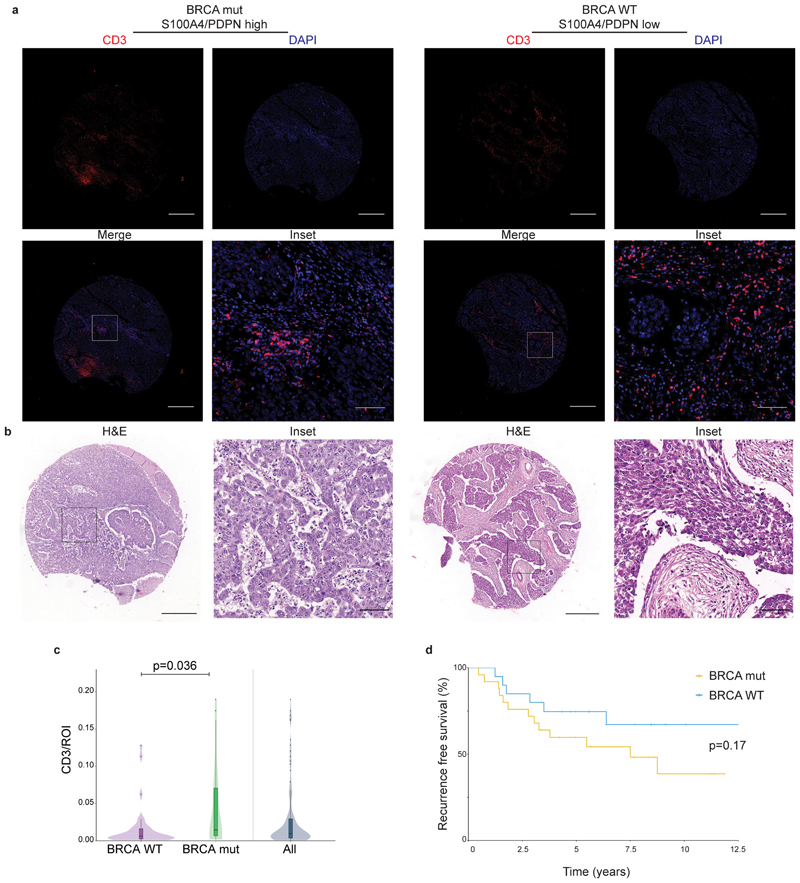
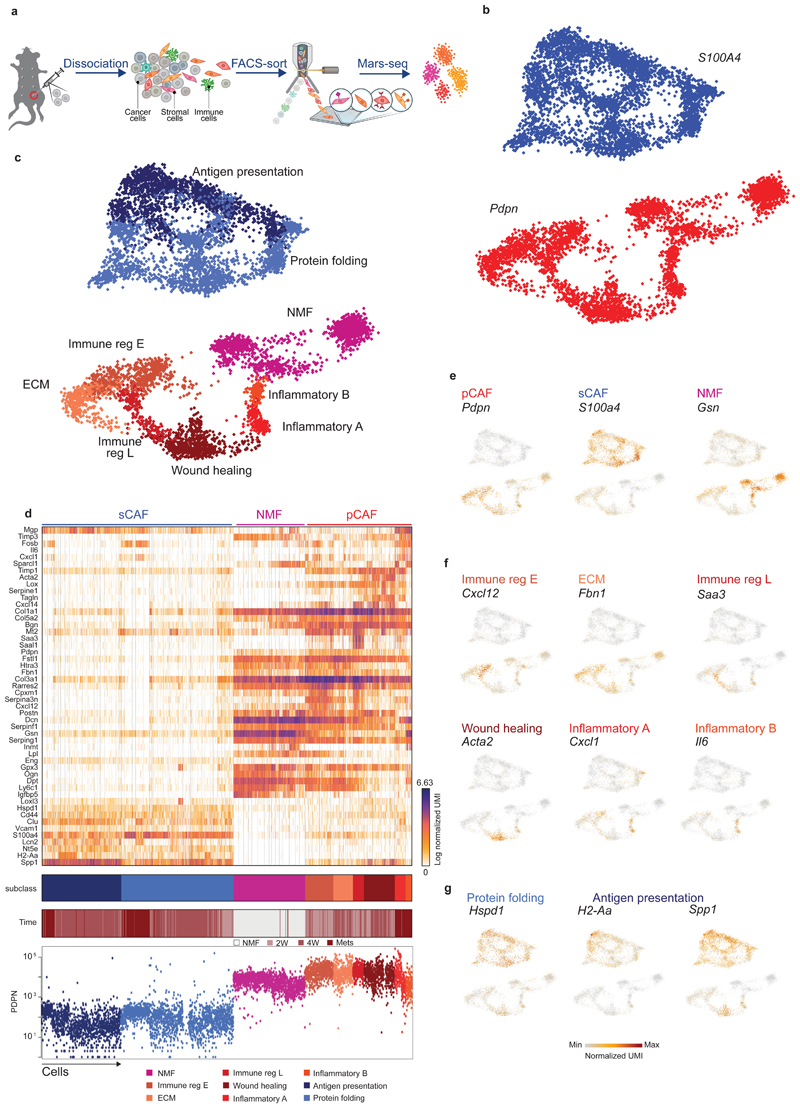
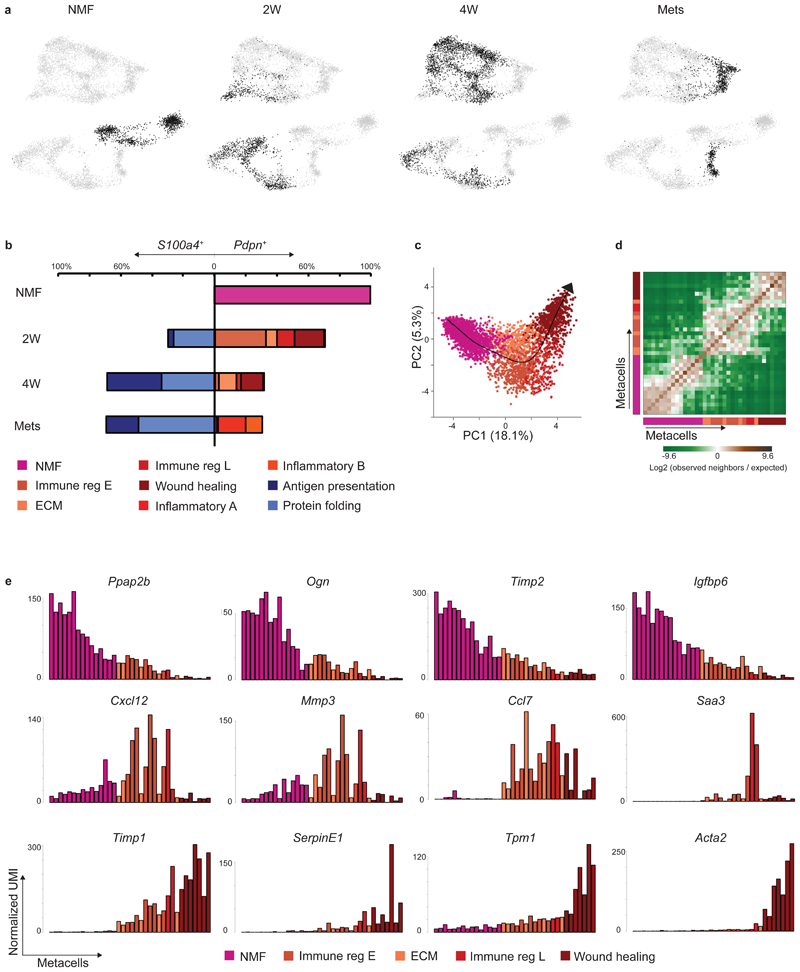
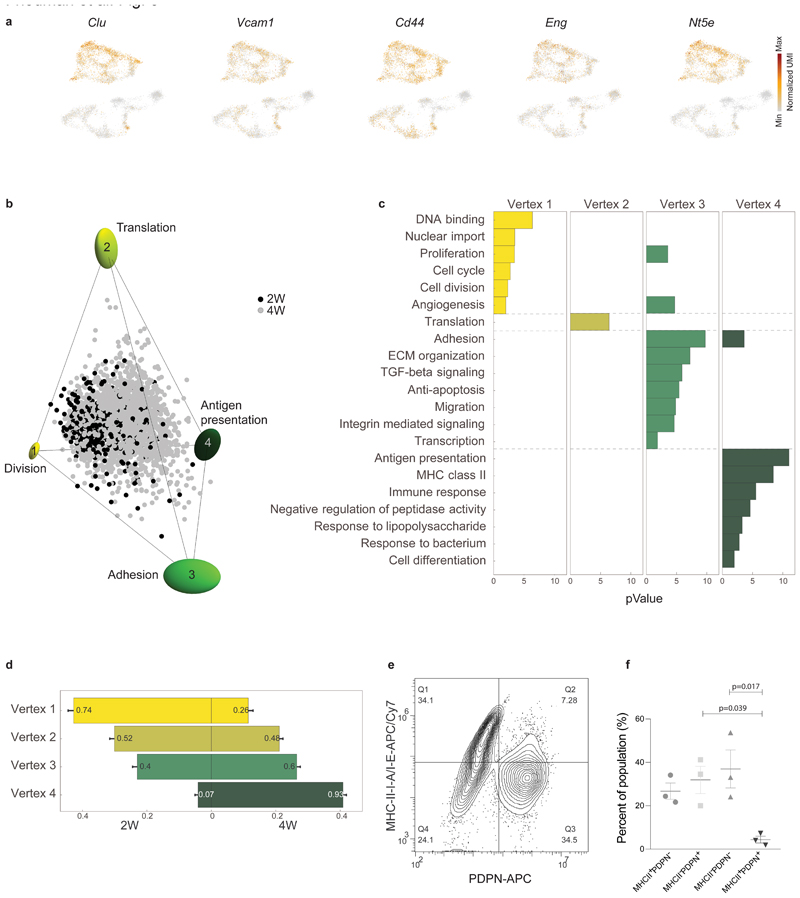
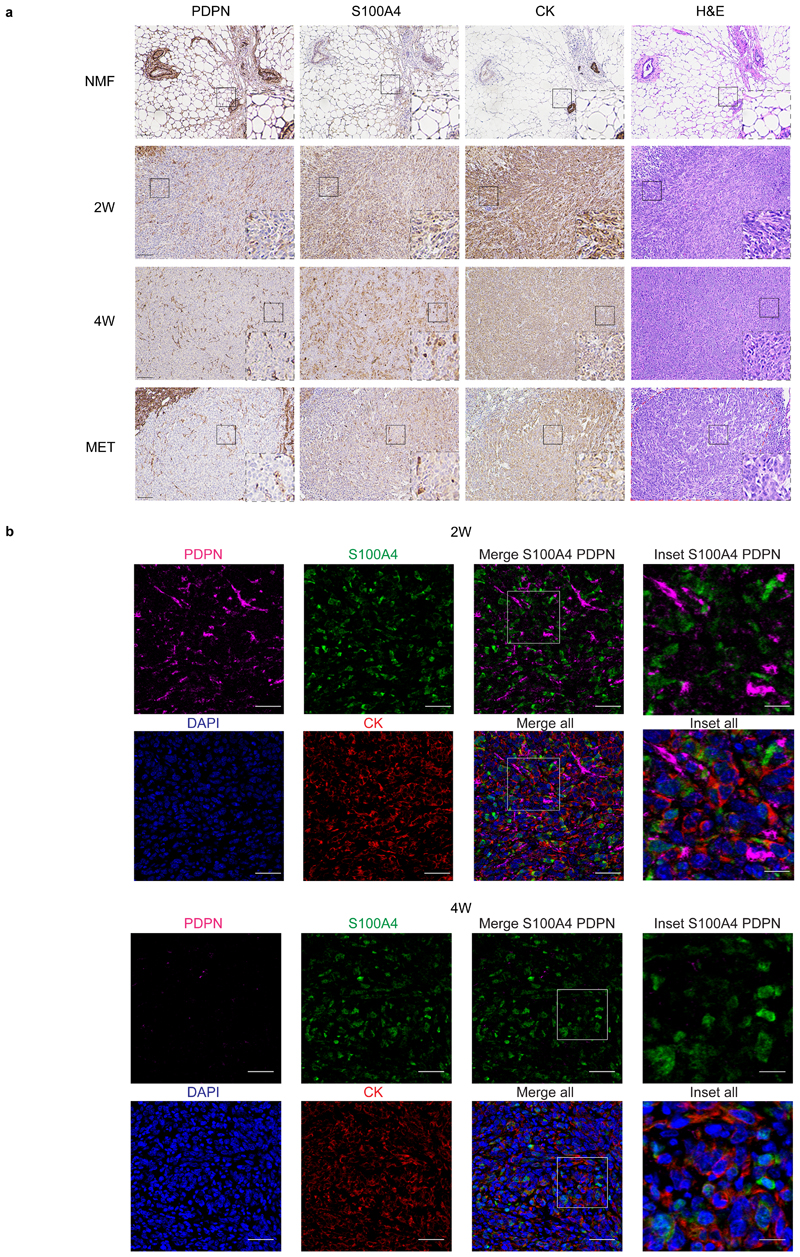
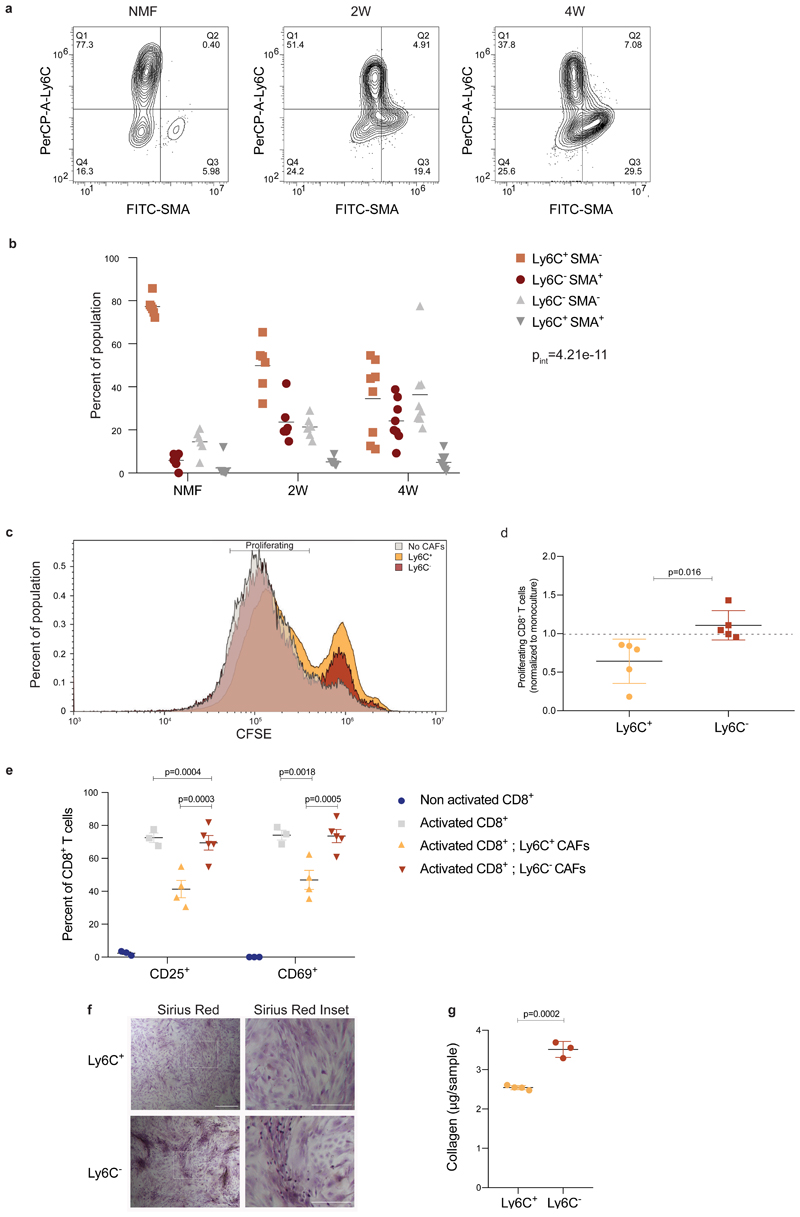
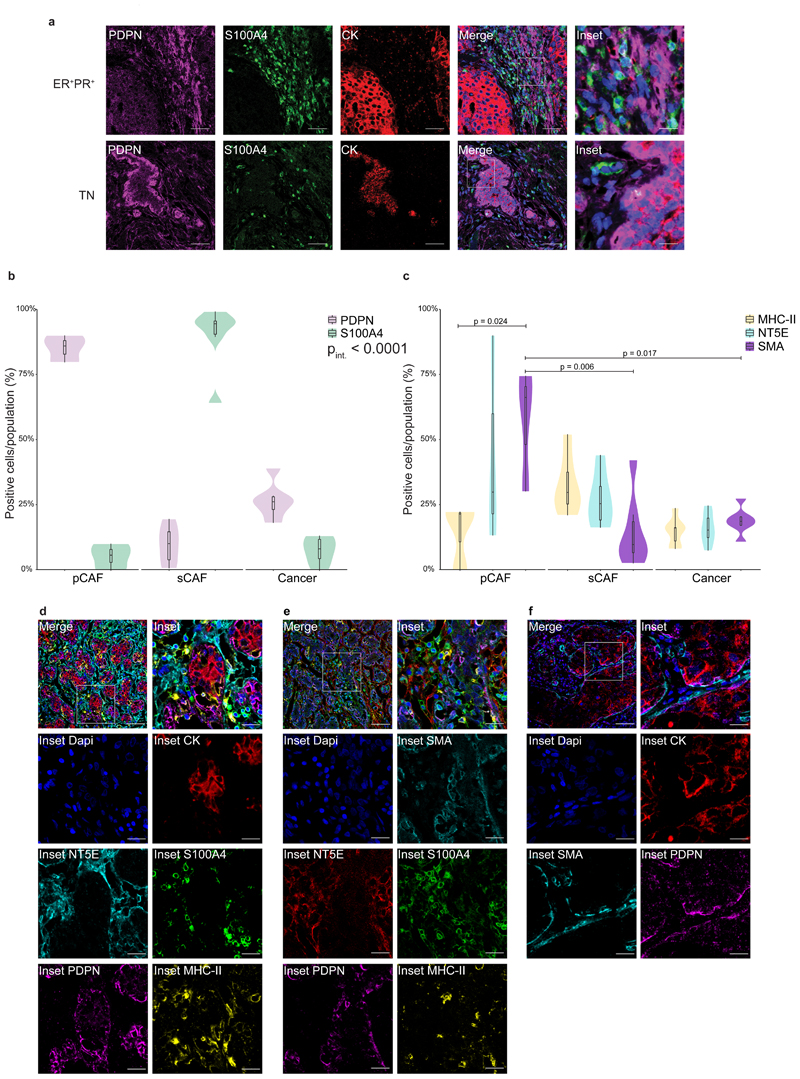
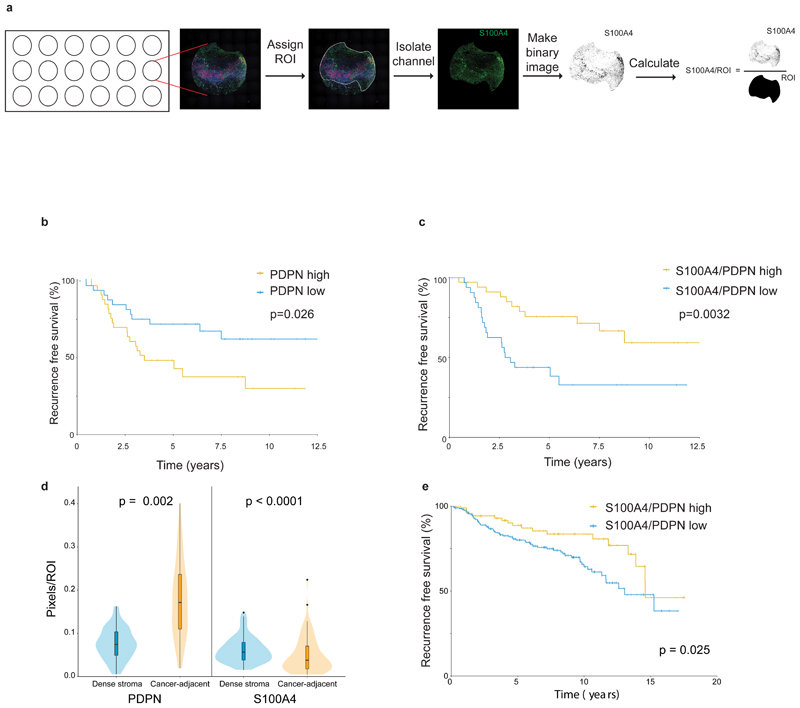
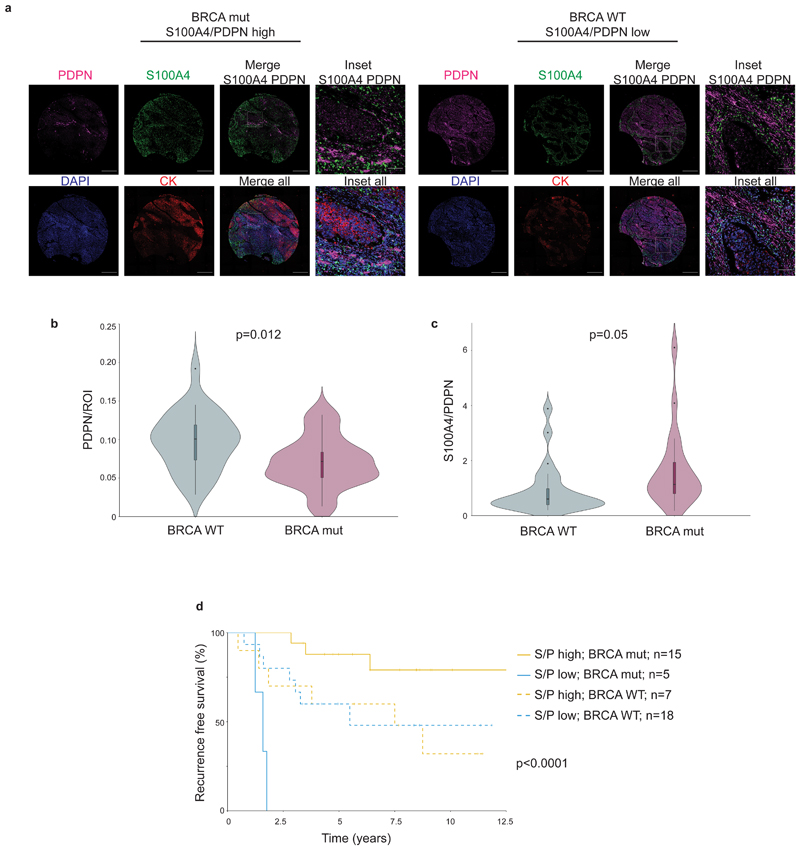
Tumors are supported by cancer-associated fibroblasts (CAFs). CAFs are heterogeneous and carry out distinct cancer-associated functions. Understanding the full repertoire of CAFs and their dynamic changes as tumors evolve could improve the precision of cancer treatment. Here we comprehensively analyze CAFs using index and transcriptional single-cell sorting at several time points along breast tumor progression in mice, uncovering distinct subpopulations. Notably, the transcriptional programs of these subpopulations change over time and in metastases, transitioning from an immunoregulatory program to wound-healing and antigen-presentation programs, indicating that CAFs and their functions are dynamic. Two main CAF subpopulations are also found in human breast tumors, where their ratio is associated with disease outcome across subtypes and is particularly correlated with BRCA mutations in triple-negative breast cancer. These findings indicate that the repertoire of CAF changes over time in breast cancer progression, with direct clinical implications.


Conflict of interest statement

Competing interests

The authors declare no competing financial interests.

Figures

Extended Data Fig. 1
Extended Data Fig. 1. A single cell map of breast cancer stroma.
a, Sorting strategy: All live single cells (PI negative cells after debris and doublet exclusion) staining negative for Ter119 (Red blood cells); CD45 (immune); and EpCAM (epithelial) were collected and single cell sorted. PDPN was used for index sorting of pCAFs. Data are combined from 8 independent experiments, with a total n=15 mice. FACS plots from a representative 4W tumor are shown. b-c, Quality control metrics of single cells analyzed in this study. b, Total unique molecular identifier (UMI) per cell. Cells are grouped by batch (plate) and color-coded by biological replicate (mouse). The time point for each batch is indicated. Cells with less than 1,000 UMI were discarded from the analysis. c, Fraction of analyzed cells/batch after filtering. Batches are grouped and color-coded as described in b. d, Single cell RNA-seq data from n=8987 QC positive cells staining negative for Ter119, CD45 and EpCAM was analyzed and clustered using the MetaCell algorithm, resulting in a two-dimensional projection of cells from 15 mice. 88 meta-cells were associated with 4 broad clusters, annotated and marked by color code. e, Expression of the hallmark genes for the 4 clusters presented in d on top of the two-dimensional projection of breast cancer stroma. Colors indicate log transformed UMI counts normalized to total counts per cell. f, Volcano plot displaying differentially expressed genes between Pdpn+ fibroblasts and S100a4+ fibroblasts (see also Supplementary Table 4). Marker genes for NMF, pCAF, and sCAF are highlighted. A total of n=8033 cells was analyzed using FDR adjusted two-sided chi square test. g, Fraction of cells originated from each mouse and subset, from all cells originated in their time point. Bar values represent the mean fraction values. Time points and subclasses are annotated and colored as in Fig. 1d. h, Squared Pearson correlation matrix for n=1045 genes between bulk and single-cell RNA-sequencing results for NMF, pCAF, and sCAF.
Extended Data Fig. 2
Extended Data Fig. 2. Pdpn+ fibroblasts undergo dynamic changes in gene expression and subset composition during tumor progression.
a, Cell-surface PDPN protein expression levels obtained from the sorting data were used to quantify the percent of PDPN+ and PDPN- cells in the CD45- EpCAM- stroma in the different time points.Data are combined from 7 independent experiments; n=3 mice per group. Error bars represent 95% CI of the mean. P-value of the two-way ANOVA interaction between fibroblast subtype and time point is presented.b, Pseudo-time of expression for individual metacells (color coded by functional subclasses as in Fig. 2) included in the slingshot analysis. A total of n=3465 cells was analyzed. Box plots display median bar, first–third quartile box and 5th–95th percentile whiskers. c, Distribution of cells across time points (color coded) within metacells included in the slingshot analysis. Metacell numbers and order are consistent across all figure panels and match the order in Fig. 2. d, Expression of hallmark NMF and pCAF genes (additional to those presented in Fig. 2e) across metacells (average UMI/cell), ordered by pseudo-time.
Extended Data Fig. 3
Extended Data Fig. 3. pCAFs and NMFs form a curve in gene-expression space, whereas a tetrahedron describes sCAF gene expression.
a, PCA analysis of NMF, and pCAF and sCAF from 2W and 4W, color coded according to the subclasses defined in Fig. 1c. n=3703 cells. b-c, PCA analyses for NMF and pCAF (b) and for sCAF (c) color coded as in a. n=3703 cells. d, Data projected on the four faces of the tetrahedron. e, Explained variance as a function of the number of PCs (real data) vs. random. Note that the total variance explained by the first 3 PCs, about 5%, is typical of single-cell gene expression data22. f, Variance of vertex positions as a function of the number of vertices considered, using PCHA with k=3-7 vertices. g, Variation of vertex position (bootstrapping) for the real data (ellipses color-coded as in Fig. 3) vs shuffled data (grey ellipses). h, Histogram depicting the average variation of vertex positions calculated for the real data (green) vs multiple runs of shuffled data (grey). i, Histogram depicting the ratio between the volumes of the convex hull of the data and the minimal enclosing tetrahedron (t-ratio). The t-ratio of the real data (green) is compared to t-ratios of shuffled data (1000 shuffles; grey).
Extended Data Fig. 4
Extended Data Fig. 4. PDPN and S100A4 proteins mark distinct types of cells in 4T1 mouse tumors, the majority of which are CK-negative.
a-b, Representative images of normal mammary fat pads (NMF; a) and lung metastases (Mets; b) (see Fig. 4a) stained with antibodies against the indicated proteins. n=3 mice per time point; Scale bar = 50 m, inset scale bar = 17μm. c, Quantification of the average overlap between CK, PDPN, and S100A4 staining in NMFs, primary tumors (2W and 4W) and Mets. Points represent the number of overlapping pixels between two channels, divided by the total number of pixels of the originating channels, in n=3 biological replicates (each dot is an average of 9 images per mouse). Mean ± SEM, p-values were calculated by two-way ANOVA followed by Tukey’s multiple comparisons test.
Extended Data Fig. 5
Extended Data Fig. 5. PDPN and S100A4 proteins mark distinct types of cells in E0771 mouse tumors, the majority of which are CK-negative.
a-b, E0771 cancer cells were injected into the mammary fad pad of C57BL/6 mice. 4W post injection the tumors were excised and fixed. Formalin fixed paraffin embedded (FFPE) tissue sections were immunostained with antibodies against the indicated proteins (n=4 mice in two independent experiments). Representative images from 2 different mice are shown in (a) and (b). Scale bar = 50 m, inset scale bar = 17μm. c, Quantification of the average overlap between CK, PDPN, and S100A4 staining in E0771 tumors. n=4 mice in two independent experiments, 3-7 images per mouse. Mean ±SD, P-values were calculated by two-way ANOVA correcting for multiple comparisons and were not found to be significant (p>0.05), no multiple comparison test was performed. d, FACS analysis of Ly6C and SMA expression in CD45- mCherry- PDPN+ cells freshly harvested from 4W E0771 tumors and immediately fixed. The results from n=3 biological replicates are quantified and analyzed utilizing one-way ANOVA followed by Tuckey’s multiple comparisons test, Mean ±SEM,.
Extended Data Fig. 6
Extended Data Fig. 6. Subsets of human sCAFs express MHC class II and NT5E, whereas a subset of pCAFs expresses SMA.
a-b, The overlap between S100A4, CK, MHC-II and NT5E stains (a; n=12 patients, average scores of 3 images per patient) and between PDPN, CK, and SMA stains (b; n=14 patients, average scores of 2-4 images per patient) in TNBC patients. Median is presented with 1st and 3rd quartiles, with untrimmed violin plot overlay. P-values were calculated by two-way ANOVA followed by Tuckey's multiple comparisons test. c, Representative images of MxIF staining of serial sections from the same patients presented in Fig. 6a with antibodies against the indicated proteins. Scale bar = 500 μm.; inset scale bar = 90 μm.
Extended Data Fig. 7
Extended Data Fig. 7. pCAFs tend to localize to cancer-adjacent regions more often than sCAFs in human breast cancer patients.
a, Heat map showing Pearson’s correlation coefficients of the staining scores for different cell type markers (n=70 patients). b-c, The association with overall survival of PDPN (b) or S100A4/PDPN (c) scored and classified as in Fig. 7b was assessed by KM analysis (n=70 patients, P-values were calculated using log rank test, two-sided).d, Illustration of the regional analysis workflow. e, The ratio of cancer-adjacent/dense stroma PDPN and S100A4 staining was determined for each core in the TNBC TMA (See also Fig. 7d). n=70, median is presented with 1st and 3rd quartiles with trimmed violin plot overlay, P-value was calculated using two-sided Wilcoxon matched pairs signed rank test. f-g, Cancer-adjacent regions and regions of dense stroma were determined for each core in the METABRIC TMA based on CK staining (see Methods section), PDPN and S100A4 staining in each region was scored (f) and the ratio of cancer-adjacent/dense stroma PDPN and S100A4 staining was determined (g). n=219, median is presented with 1st and 3rd quartiles with trimmed violin plot overlay, P-value was calculated using two-sided Wilcoxon matched pairs signed rank test.
Extended Data Fig. 8
Extended Data Fig. 8. BRCA status is not significantly correlated with recurrence free survival in a cohort of TNBC patients.
a, CD3 and DAPI staining was performed on n=68 patients from the TNBC cohort. Representative staining in a BRCA mutated (mut) patient and a BRCA WT patient is shown. b, Representative H&E stains of a BRCA mutated (mut) patient and a BRCA WT patient are shown (n=25 BRCA WT; n=20 BRCA mut;Serial sections of the same cores used in Fig. 8a are shown in a and b). Scale bar = 500 m; inset scale bar = 80 m. c, Box plot depicting CD3 staining scores (see Methods section) in patients with known BRCA status from our TNBC cohort (n=23 BRCA WT; n=20 BRCA mut) as well as the total TNBC cohort (All, n=68). Median is presented with 1st and 3rd quartiles with trimmed violin plot overlay. P-value was calculated using a two-sided Student’s t-test. d, TNBC patients were stratified by BRCA mutational status and the association with recurrence free survival was assessed by KM analysis. n=45, P-value was calculated using two-sided log rank test.
Fig. 1
Fig. 1. Breast CAFs are comprised of distinct subsets with diverse transcriptional profiles.
a, Illustration of the experimental procedure. b and c, Single cell RNA-seq data from CAF and NMF was analyzed and clustered using the MetaCell algorithm, resulting in a two-dimensional projection of 8033 cells from 15 mice. 83 meta-cells were associated with 2 broad fibroblast populations (b) and 9 functional subclasses (c) annotated and marked by color code. (d) Gene expression of key markers genes across single cells from all subclasses of NMF, pCAF, and sCAF. Lower panels indicate the association to subclass, the time-point, and the PDPN index sorting data, showing protein level intensity in each cell. e-g, Expression of key markers genes for NMF, pCAF, and sCAF (e); functional annotation for pCAF subclasses (f) and sCAF subclasses (g) on top of the two-dimensional projection of breast CAFs. Colors indicate log transformed UMI counts normalized to total counts per cell.
Fig. 2
Fig. 2. CAF composition and gene expression changes with tumor growth and metastasis.
a, Projection of 8033 cells from different time points (black) on top of the 2D map of breast fibroblasts (presented in Fig. 1b-c). b, Compositions of Pdpn+ fibroblasts (right) and S100a4+ fibroblasts (left) at different time points (normalized to 100% total fibroblasts). Subclasses are annotated and color-coded. c-e, Slingshot analysis of pseudo-time trajectory from NMF to pCAF from 2W and 4W. A total of 3465 cells was analyzed. Cells are color-coded as in b. c, Suggested trajectory from NMF to pCAF projected over the top two principal components. d, Heat map showing enrichment (log2 fold change) for kNN connections between metacells over their expected distribution. Metacells are ordered by their position on the Slingshot pseudotime. e, Expression of hallmark NMF and pCAF genes across metacells (average UMI/cell), ordered by pseudo-time.
Fig. 3
Fig. 3. sCAFs show a continuum of cell states which fills a tetrahedron in gene-expression space, suggesting trade-off between 4 functions.
a, Expression of hallmark mesenchymal stem cell marker genes on top of the two-dimensional projection of breast cancer stroma (presented in Fig. 1b-c), in a total of n=8033 cells from 15 mice. Colors indicate log transformed UMI counts normalized to total counts per cell. b, ParTI analysis of 2W and 4W sCAF single-cell gene-expression in the space of the first 3 principal components shows a continuum that can be well enclosed by a tetrahedron. At the vertices are ellipses that indicate standard deviation of vertex position from bootstrapping. Cells are color-coded according to time point. Vertices are annotated and color-coded. n=2292 cells. c, Gene ontology enrichment in the different vertices. (see full list in Supplementary Table 6). n=2292 cells, gene enrichment was calculated by Spearman rank correlation between the gene’s expression and the euclidean distance of cells from the vertex, as detailed in Methods. d, Relative representation of each time point in the 4 vertices. The x-axis shows the fraction of cells from 2W and 4W closest to each vertex. Numbers in the bars are the fraction of each time point in the 100 cells closest to each archetype. e-f, Flow cytometry analysis of cell surface expression of MHC-II molecules I-A/I-E vs PDPN in CD45- EpCAM- cells from 4W tumors. A representative flow cytometry plot is shown in (e), quantification of results is presented in (f). n=3 mice, mean± SEM, P-values were calculated using one-way ANOVA followed by Tuckey's multiple comparisons test.
Fig. 4
Fig. 4. PDPN and S100A4 proteins are expressed on distinct types of breast CAFs in mouse tumors.
a, Consecutive formalin fixed paraffin embedded (FFPE) tissue sections of tumors, metastases, or normal mammary fat pads were immunostained with antibodies against the indicated proteins, or stained with hematoxylin & eosin (H&E). n=3 mice per time point; Representative images are shown. All images were collected at the same magnification and are presented at the same size. Scale bar = 100μm. For each panel, regions marked by rectangles are shown as 2.5X insets in black dashed rectangles. A dashed red line on the H&E marks the metastatic region in the lung. b, Multiplexed immunofluorescent (MxIF) staining was performed with antibodies against the indicated proteins. n=3 mice per time point; Representative images of 2W and 4W tumor FFPE sections are shown. Scale bar = 50 μm, inset scale bar = 17μm.
Fig. 5
Fig. 5. Ly6C+ pCAFs suppress CD8 T-cell proliferation, in vitro.
a-b, FACS analysis of Ly6C and SMA expression in CD45- EpCAM- PDPN+ cells freshly harvested from normal mammary fat pads, 2W tumors, and 4W tumors, and immediately fixed. Representative flow cytometry plots from one mouse are shown in (a) and the results are quantified in (b). n=6 mice for NMF and 2W; n=8 mice for 4W, data are combined from 3 independent experiments and are presented as mean, analyzed using two-way ANOVA followed by Tuckey's multiple comparisons test. Pint – P interation between time and population. c-d, CD45- EpCAM- PDPN+ cells from 4W tumors were sorted to Ly6C+ vs Ly6C- populations, which were then incubated in vitro at 1:1 ratio with CD8+ T cells activated by CD3/CD28 beads and marked by CFSE for 48h. Representative FACS plots of CFSE signals from one experiment are shown in (c) and the results from n=5 independent experiments, each with different mice, normalized to the average proliferation with no CAFs per experiment are presented in (d) as mean ± SD, analyzed utilizing two-sided Students’ T-test. e, Flow cytometry analysis of CD25 and CD69 activation markers in CD8+ T cells activated and co-cultured with pCAFs as described in (c), or incubated in monoculture with and without activation. The experiment was repeated 3 times, each with different mice. Results from one representative experiment are shown in (e). For non-activated CD8+ and activated CD8+ n=3; for activated CD8+ with Ly6C+ CAFs n=4; for activated CD8+ with Ly6C- CAFs n=5 independent culture wells;mean±SEM; two-way ANOVA followed by Tuckey’s multiple comparisons test. f-g, CD45- EpCAM- PDPN+ cells from 4W 4T1 tumors were sorted to Ly6C+ vs Ly6C- populations, which were then grown to confluence in vitro, passaged once, allowed to secrete collagen for 4 days and stained with Sirius Red (see Methods section). The experiment was repeated 4 times, each with different mice. Results from one representative experiment are shown in (f). Quantification of Sirius Red staining in a representative experiment is shown in (g). n=4 Ly6C+; n=3 Ly6C- independent culture wells. Mean±SEM, two tailed Student’s T-test. Scale bar = 500 μm, inset scale bar = 250 μm.
Fig. 6
Fig. 6. PDPN and S100A4 mark distinct populations of CAFs in human breast cancer.
a, MxIF staining of FFPE tissue sections from ER+ or TN breast cancer (BC) patients with antibodies against the indicated proteins. Staining was performed on 5 ER+ and 6 TN patients, representative images from an ER+ PR+ HER2- and a TN patient are shown. n=11 patients, combined from two independent experiments. Scale bar = 50 μm; inset scale bar = 12.5 μm. b-f, FFPE tumor sections from 12 TNBC patients were MxIF stained with antibodies against the indicated proteins. Cells were classified using QuPath (see Methods section) to pCAFs, sCAFs or cancer cells based on PDPN, S100A4 and CK staining (b) and the expression of MHC-II, NT5E and SMA in each class was determined (c). n=3 patients for pCAF; n=6 patients for sCAF and Cancer. Median is presented with 1st and 3rd quartiles, with trimmed violin plot overlay. Probability comparisons were done using two-way ANOVA (b-c) with Tukey correction for multiple comparisons in (c). P-value of the interaction of cell and marker (Pint) is shown in (b). Representative merged images and insets of the independent channels are shown in (d-f). n=8 patients for d; n=6 patients for e; n=5 patients for f. Scale bar = 50 μm; inset scale bar = 17 μm.
Fig. 7
Fig. 7. PDPN and S100A4 stromal staining is correlated with disease outcome in human breast cancer patients.
a, Illustration of pixel-based image analysis workflow. b-c, FFPE tumor microarray (TMA) sections from a cohort of TNBC patients (n=70) were immunostained for PDPN, S100A4 and CK and scored (see Methods section). PDPN scores (b) or S100A4/PDPN scores (c) were classified as higher or lower than the median, and the association with recurrence-free survival of n=70 patients was assessed by Kaplan Meier (KM) analysis. P-value was calculated using log rank test (two sided).d, Cancer-adjacent regions and regions of dense stroma were determined for each core in the TNBC TMA based on CK staining (see Methods section), and PDPN and S100A4 staining in each region was scored.n=70 patients, median is presented with 1st and 3rd quartiles with trimmed violin plot overlay, P-value was calculated using Wilcoxon matched pairs signed rank test, two sided.e, FFPE TMA sections of breast cancer patients from the METABRIC cohort (n=288 patients) were stained and scored for PDPN, S100A4 and CK as described in (b-c). S100A4/PDPN scores were classified as higher (n=88) or lower (n=200) than 1 (5 outlier samples were omitted from the analysis; see Methods section), and the association with recurrence-free survival was assessed by Kaplan Meier (KM) analysis. P-value was calculated using log rank test (two sided).
Fig. 8
Fig. 8. S100A4/PDPN ratio is a classifier of recurrence-free survival in BRCA mutated TNBC.
a, Representative images of PDPN, S100A4, cytokeratin (CK) and DAPI staining in a BRCA mutated (mut) patient and a BRCA WT patient from our cohort of 72 TNBC patients. Scale bar = 500 μm; inset scale bar = 80 μm b-c, Untrimmed vase-box plots depicting PDPN (b) or S100A4/PDPN (c) staining scores (see Methods section) in BRCA WT (n=25) vs BRCA mut (n=20) patients from the TNBC cohort. Median is presented with 1st and 3rd quartiles, with untrimmed violin plot overlay. P-value was calculated using a two-sided Student’s t-test.d, Multivariate analysis through Cox PH model for the TNBC data was performed, then TNBC patients were stratified by BRCA mutational status, and the association of S100A4/PDPN scores (higher vs lower than median) with recurrence free survival was assessed by KM analysis. P-value for the model was calculated using two-sided log rank test.

References

    1. McGranahan N, et al. Clonal status of actionable driver events and the timing of mutational processes in cancer evolution. Sci Transl Med. 2015;7 doi: 10.1126/scitranslmed.aaa1408. 283ra254. - DOI - PMC - PubMed
    1. Pereira B, et al. The somatic mutation profiles of 2,433 breast cancers refines their genomic and transcriptomic landscapes. Nat Commun. 2016;7 doi: 10.1038/ncomms11479. 11479. - DOI - PMC - PubMed
    1. Tabassum DP, Polyak K. Tumorigenesis: it takes a village. Nat Rev Cancer. 2015;15:473–483. - PubMed
    1. Hanahan D, Coussens LM. Accessories to the crime: functions of cells recruited to the tumor microenvironment. Cancer Cell. 2012;21:309–322. S1535-6108(12)00082-7 [pii] - PubMed
    1. Kalluri R, Zeisberg M. Fibroblasts in cancer. Nat Rev Cancer. 2006;6:392–401. nrc1877 [pii] - PubMed

Publication types